Non-technical summary
Light stimulates ion flow through the retina. This generates a potential change at the cornea which is recorded as an electroretinogram (ERG). Our understanding of the role of potassium ions in generating the ERG is based on animal models. The KCJN10 gene constitutes Kir4.1, the principle potassium channel expressed on the retinal Muller cell. We have been able to study the impact of this potassium channel on the human retina for the first time by recording the ERGs of patients with EAST syndrome who have known mutations of KCJN10. Our data show a reduction in the amplitude of the photopic negative response of the light-adapted ERG and a decrease in the sensitivity of the dark-adapted ERG. These data increase our understanding of how the ERG is generated and why these ERG parameters may be affected in disease.
Abstract
Abstract
The K+ channel expressed by the KCNJ10 gene (Kir4.1) has previously demonstrated importance in retinal function in animal experiments. Recently, mutations in KCNJ10 were recognised as pathogenic in man, causing a constellation of symptoms, including epilepsy, ataxia, sensorineural deafness and a renal tubulopathy designated as EAST syndrome. We have studied the impact of KCNJ10 mutations on the human electroretinogram (ERG) in four unrelated patients with EAST syndrome. Corneal ganzfeld ERGs were elicited in response to flash stimuli of strengths of 0.001–10 phot cd s/m2 presented scotopically, and 0.3–10 phot cd s/m2 presented photopically. ERG waveforms from light-adapted retinae of all patients showed reduced amplitudes of the photopic negative response (PhNR) (P < 0.001). The photopic ERGs showed a delay in b-wave time to peak, but the photopic hill, i.e. the relative variation of time to peak and amplitude with luminance flash strength, was preserved. Scotopic ERGs to flash strengths 0.01 to 0.1 phot cd s/m2 showed a delay of up to 20 ms before the onset of the b-wave in two patients compared to controls. Stimulus–response functions were fitted by Michaelis–Menten equations and showed significantly lower retinal sensitivity in two patients than in controls (P < 0.001). Our study for the first time in the human ERG shows changes in association with KCNJ10 mutations affecting a Muller cell K+ channel. These data illustrate the role of KCNJ10 function in the physiology of proximal and possibly also the distal human retina.
Introduction
Mutations in the KCNJ10 gene were recently recognised as pathogenic in man, causing a constellation of symptoms, including epilepsy, ataxia, sensorineural deafness and a renal tubulopathy designated as EAST syndrome (Bockenhauer et al. 2009), independently described as SeSAME syndrome (Scholl et al. 2009). KCNJ10, also known as Kir4.1, constitutes the primary inward rectifying potassium channel of retinal Muller cells (Kofuji et al. 2000). Muller glial cells span the retinal layers, extending radially from the proximal vitreal surface to the distal sub-retinal space next to the photoreceptor outer segments. Glial potassium currents are fundamental to brain and retinal homeostasis. Here, we describe for the first time the impact of KCJN10 mutations on human retinal function as assessed in vivo using the flash electroretinogram (ERG).
Methods
Ethical approval
Electroretinograms (ERGs) were acquired as part of the routine clinical examination of these patients with informed parental consent and child assent. This study was registered with the Research Governance Team at Great Ormond Street Hospital for Children NHS Trust and Institute of Child Health, University College London UK (10DB11) and was considered a retrospective medical case note review that did not require research ethical approval.
Four apparently unrelated patients diagnosed with EAST syndrome underwent electroretinography aged 14, 16, 17 and 21 years, respectively. Clinical features of patients 1 and 4 have been previously described (Bockenhauer et al. 2009; Scholl et al. 2009), whereas patients 2 and 3 have been newly diagnosed based on the presence of the cardinal clinical features. Mutational analysis of the KCNJ10 potassium channel gene showed the same homozygous missense mutation p.R65P in patients 1 and 2, a homozygous p.R297C mutation in patient 3 and compound heterozygous mutations p.R65P and p.R199X in patient 4.
All patients presented with infantile epilepsy, but the EEG was normal in patients 1 and 2 by 7 years and 8 years, respectively, and neither patient was taking anti-epileptic medication. Patient 3 takes lamotrigine and patient 4 lamotrigine and clonazepam. Patients 1, 2 and 3 had normal fundal appearances and normal or near-normal visual acuity LogMAR 0.0 to 0.1 right and left without spectacle correction. Patient 4 wore spectacles to correct hyperopia with best corrected vision of LogMAR 0.4 BEO. He also had mild disc pallor. Patients 2 and 4 were photophobic. No patients or parents reported nyctalopia on direct questioning. Steady positioning for an optical coherence tomogram (OCT) of retinal nerve fibre layer thickness was achieved only by patient 3, in whom it was normal (Fig. 1).
Figure 1. Retinal nerve fibre layer (RNFL) thickness.
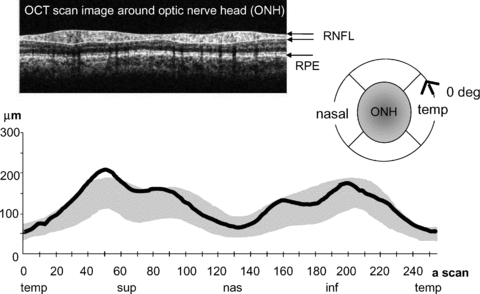
RNFL thickness (continuous black line) is plotted against axial-scan location on horizontal axis (256 a-scans through 360 deg). The grey region indicates 5–95th centile of normal peri-papillary thickness. Temporal (temp), superior (sup), nasal (nas) and inferior (inf) quadrants are indicated below the graph. ONH, optic nerve head; RPE, retinal pigment epithelium. The scan was acquired with Zeiss Stratus OCT3.
Electroretinograms (ERGs) were recorded after pupillary dilatation using DTL corneal electrodes referred to ipsilateral outer canthal skin electrodes. Ganzfeld ERGs were elicited from each patient to a range of flash strengths presented scotopically after 20 min dark adaptation and photopically after 10 min light adaptation to 30 cd m−2. Flash strengths of 0.001–10 phot cd s/m2 were presented scotopically and 0.3–10 phot cd s/m2 photopically. Responses were sampled at 1 kHz within bandpass filters of 0.312–100 Hz. Amplifiers had a fixed gain with input range ±0.5 V (Espion, Diagnosys, Cambridge UK). Scotopic oscillatory potentials (OPs), recorded to 3 phot cd s/m2, were filtered between 100 and 300 Hz.
A typical photopic ERG waveform from a control is shown in the middle of Fig. 2A. Amplitudes and time to peaks were measured: the a-wave from baseline to trough, the b-wave from a-wave trough to b-wave peak, as is common practice. In addition, the amplitude of the PhNR, the negative wave following the b-wave, thought to reflect proximal retinal activity (Viswanathan et al. 1999, 2000; Machida et al. 2011) was measured from b-wave peak to the lowest amplitude trough following the b-wave. Also a ratio of PhNR amplitude to the b-wave amplitude, without and with subtraction of the a-wave, was calculated. This provides an alternative measure of PhNR which is relative to baseline. Ratios less than 1 indicate a PhNR that is above the baseline and greater than 1 below the baseline.
Figure 2. Photopic ERGs.
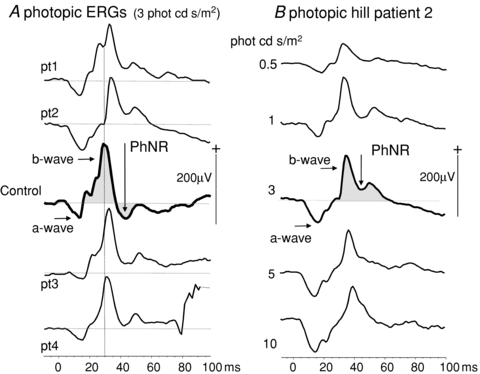
A, photopic ERGs to flashes of time-integrated luminance of 3 phot cd s/m2 are shown for all patients (pt1–4) with a control ERG of median amplitude for comparison (centre trace). The arrows and shaded areas show the difference in PhNR of patients and control; the control PhNR falls below the baseline. The dotted vertical reference line highlights the longer time to peak of all photopic b-waves compared to control data. B, a photopic luminance response series from patient 2 shows waveform and time to peak changes of the ‘photopic hill’. Arrows indicate the a-wave, b-wave and PhNR. The PhNR does not descend below the dotted baseline.
Statistical analyses were carried out comparing means and standard deviations of patient data with age-matched data from 15 control individuals; z-scores and independent t tests were calculated with SPSS v15 for Windows.
Results
In control subjects PhNRs fall below the baseline after the b-wave; in contrast, in patients the PhNRs are significantly smaller than the preceding b-wave and do not fall below the baseline (Fig. 2A). A subtraction of PhNR amplitude from the preceding b-wave showed the mean (± SD) amplitude difference between b-wave and PhNR was 5 ± 13 μV in controls and 71 ± 31 μV in patients (P < 0.02). In patients the mean ratio (± SD) (PhNR/(b amplitude)) was 0.67 ± 0.12 compared to the control mean ratio of 1.32 ± 0.26 (P < 0.001, independent t test) and to account for individual a-wave amplitudes we computed also the ratio of PhNR amplitude to b-wave minus a-wave amplitude. For patients, the mean ratio (± SD) (PhNR/(b – a amplitude)) was 0.83 ± 0.09 compared to control mean ratio of 1.27 ± 0.19 (P < 0.001, independent t test). The photopic ERG waveforms for all patients are shown in Fig. 2A. Across the range of flash strengths the photopic ERGs showed changes in waveform and b-wave time to peak described typically as the photopic hill (Ueno et al. 2004), i.e. at high flash strength the b-wave amplitude is smaller and the time to peak later than the b-waves elicited to standard and dimmer flash strength (Fig. 2B). Whilst showing a photopic hill, the photopic b-wave time to peaks exceed the 95th centile of normal at each flash luminance (Fig. 2A). The amplitude difference between PhNR and b-wave, and the ratios of PhNR amplitude to b-wave amplitude alone, and a baseline computed by subtracting the preceding a-wave from the b-wave amplitude, are shown graphically for patient mean data next to control mean data + 1 SD in Fig. 3A. The individual patient photopic a-wave, b-waves and PhNR amplitudes and time to peaks are displayed graphically with control data in Fig. 3B and C.
Figure 3. Photopic ERG amplitude and time to peak data.
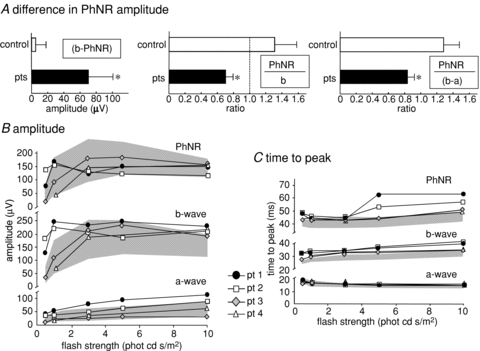
A, the patient mean difference in amplitude between the b-wave and PhNR for flash strength of 3 phot cd s/m2 is graphically presented with the control group (*P < 0.02). The patient mean ratio measure of PhNR amplitude:b-wave amplitude and PhNR amplitude:b-wave minus a-wave baseline amplitude are graphically presented with control data (*P < 0.001). The error bars represent +1 SD. Values less than the dotted reference line at ratio 1 occur if PhNR is smaller than the b-wave or does not reach the baseline. B, luminance response profiles are shown for amplitudes of PhNR, a-wave and b-wave compared with normal range shaded in grey. The PhNR amplitudes of the patients are smaller than the b-wave. C, luminance response profiles are shown for time to peaks for PhNR, a-wave and b-wave. The shaded area indicates normal range. Time to peak of b-wave and PhNR fall outside the upper limit of normal.
The scotopic b-wave amplitudes to dim flashes were small, falling at and just below the 5th centile for patients 1 and 2, but these amplitudes grew rapidly over a short range of increasing flash strength to reach the 95th centile. Patient 4 b-wave data showed the same trend, but increased more gradually to low flash strengths. Patient 3 had an entirely normal scotopic luminance response series. Data for all patients are shown graphically in Fig. 4 along with a-wave amplitudes, a- and b-wave time to peaks, each plotted within 5th and 95th confidence ranges of normal.
Figure 4. Scotopic ERG a-wave and b-wave amplitudes and time to peak data.
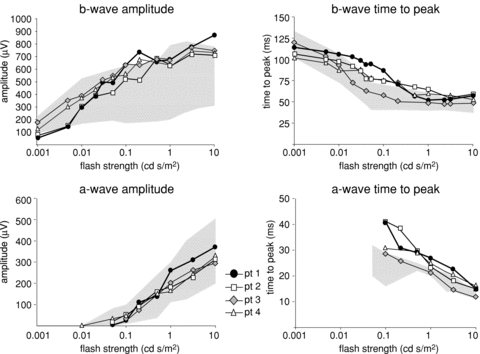
Scotopic luminance response series show the growth of b-wave amplitude from 5th to 95th centile; a-wave amplitudes were normal. The a- and b-wave times to peak showed delays outside the 95th centile. The shaded area of each graph indicates normal range.
Stimulus response functions were fitted to the scotopic ERG b-wave amplitudes elicited to flashes under 0.1 phot cd s/m2 by the Michaelis–Menten equation.
where V is the amplitude of the b-wave, Vmax is the asymptotic maximum amplitude, a measure of responsiveness, I is the flash luminance, K is the flash luminance needed to elicit a half-maximal amplitude ERG (half-saturation coefficient), providing a measure of retinal sensitivity, and n is a dimensionless constant (Evans et al. 1993). These data were calculated individually for controls and the parameters were then averaged. Patient values were normalised on Vmax for ease of comparison with control data. Figure 5 illustrates graphically the lower retinal sensitivity of EAST patients compared to controls. The luminance needed for half-maximal amplitude was significantly greater in patients 1 and 2 (z-scores 7.7 and 6.4, P < 0.0001) and patient 4 (z-score 2.6, P < 0.01) than controls.
Figure 5. Michaelis–Menten luminance response functions.
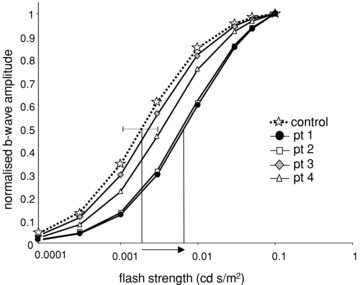
Michaelis–Menten functions were fitted to scotopic b-wave amplitudes from the 1st limb of the luminance response curve, i.e. flash time-integrated luminances ≤0.1 cd s/m2, for each patient. Normalised control data are shown by star symbols linked by dotted line, patients shown by solid lines. Vertical lines indicate the difference in flash luminance needed to elicit half-maximum response in a patient with p.R65P mutation and control. The dotted line shows ± 2 SD control mean of LogK. Mean control data: Vmax, 372 μV; n, 0.996; LogK, 0.002; SD 0.00078. Patient data: LogK pt1, 0.008; pt2, 0.007; pt3, 0.004; pt4, 0.003.
Scotopic b-wave peak times were delayed at mid-range flash strengths, but at the highest scotopic flash strength, b-wave time to peak and a-wave amplitude and peak time were normal. Closer inspection of scotopic ERG waveforms of patients 1 and 2 show the time to peak delay can be attributed to a marked delay in the onset of the b-wave. At its maximum, the onset was 20 ms later than controls (Fig. 6A). For clarity of comparison, the left eye data of patients are displayed with examples from two controls, who fall at the 5th and 95th centile. For patients 1 and 2, the dark-adapted response series, across a range of flash strengths, show the evolution of the b-wave characteristics in Fig. 6B.
Figure 6. Delay of scotopic b-wave onset.
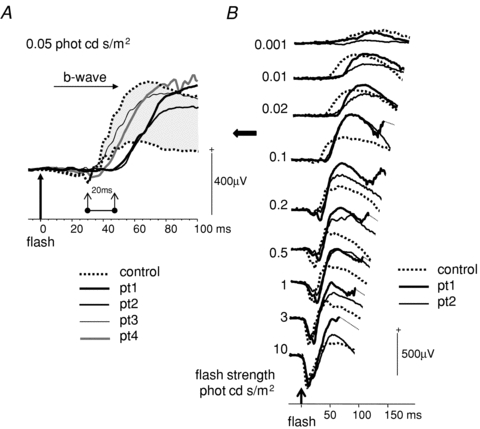
A, scotopic ERGs to 0.05 cd s/m2 time integrated flash luminance for all patients are shown with control data outlining the 5th and 95th centile shaded grey. The 20 ms delay in the onset of the b-wave in patients 1 and 2, compared to controls, is highlighted. B, scotopic ERGs from patients 1 and 2 to a range of flash strengths around the maximal onset delay are shown.
Scotopic OPs are shown in Fig. 7. OP1 and OP2 were later in patients than controls and OP3 was smaller. The mean latency of OP1 was16.7 ms (SD 0.32) in controls compared with 18 ms for patients 1 and 3, and 19 ms for patient 2 (z-scores 4.1 and 7.6, P < 0.001), and for OP2 control mean latency was 22.8 ms (SD 0.6) compared with 26 ms and 25 ms in patients 1 and 2 (z-scores 5.4 and 3.7, P < 0.001). OP3 was at normal latency, but for patient 1 merged on the falling phase of OP2 and for patient 2 was small, measuring 10 μV at 30 ms compared with control of 66 μV (SD 19) at 29.6 ms (SD 0.6; z-score 2.98, P < 0.01).
Figure 7. Oscillatory potentials (OPs).
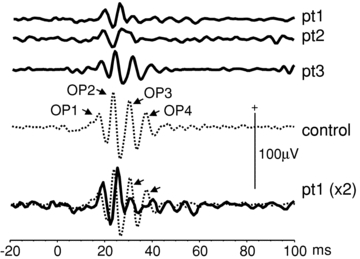
Scotopic OPs are shown from patients 1, 2 and 3. OPs could not be carried out in patient 4 due to poor compliance. The bottom traces show pt 1 data scaled ×2 and overlaid (black) on a control example of mean data (dotted). This highlights the reduction of later OPs.
Discussion
KCNJ10 constitutes the principle potassium ion channel of retinal Muller cells (Ishii et al. 1997; Kofuji et al. 2000). Our study for the first time shows changes in the human ERG due to Muller cell dysfunction in association with KCNJ10 mutations. The light-adapted PhNR, thought to be generated by proximal retina, retinal ganglion cell activity (Viswanathan et al. 1999; and specifically Machida et al. 2011), was consistently reduced in all four patients and did not fall below the baseline after the b-wave. In addition, dark-adapted retinal sensitivity, as judged by scotopic b-waves, was markedly affected in two patients, both with a homozygous mutation p.R65P. Whether this is a mutation-specific effect cannot be determined at this point, given the small number of patients investigated. However, the fact that the patient heterozygous for R65P with a presumably non-functional nonsense mutation p.R199X on the other allele was more mildly affected makes this questionable. Moreover, while the R65P mutation significantly impairs potassium currents compared to wild type in vitro, the reduction in current is the least of all mutations investigated so far (Reichold et al. 2010). Thus, individual variations in the ability to compensate for the loss of KCNJ10 function, possibly via heteromer formation, may explain this heterogeneity.
K+ channels are not distributed uniformly over retinal Muller cells and they have differential rectifying properties (Newman et al. 1984; Newman, 1984; Reichenbach et al. 1992; Connors & Kofuji, 2006; Kucheryavykh et al. 2008). The spatial inhomeogeneity of the Muller cell membrane K+ conductance most closely mirrors the distribution of KCNJ10 in mice (Newman & Reichenbach, 1996). Immunohistochemistry shows KCNJ10 expression on the end feet of Muller cells at the proximal vitreal surface, around blood vessels close to the inner and outer plexiform layers, and less markedly, around the distal Muller microvilli in the sub-retinal space (Kofuji et al. 2002). It is thought that KCNJ10 is important for a process called ‘K+ siphoning’ or ‘spatial buffering’ in Muller cells to maintain a constant extracellular K+ concentration (Newman, 1985; Reichenbach et al. 1992; Newman & Reichenbach, 1996).
K+ currents in the Muller cell are associated with three ERG responses: the slow plll (Kofuji et al. 2000), the scotopic threshold response (Frishman & Steinberg, 1989) and the PhNR (Viswanathan et al. 1999; Machida et al. 2008; Raz-Prag et al. 2010). Retinal Muller cells also have major K+-dependent glutamate metabolism pathways (Bringmann et al. 2009). The slow plll of Granit's classical analysis is a corneal negative response that relates to a light-evoked, distal decrease in the K+ concentration in the sub-retinal space [K+]o that passively hyperpolarises the Muller cell (Granit, 1947). This sets up a trans-retinal spatial buffer current. The decrease in distal [K+]o occurs when light stimulation interrupts the circulating dark current: cGMP channels in the outer segment close, preventing inward Na+ current, and the resulting hyperpolarization causes K+ leak from inner segments to cease. In turn, glutamate release is suppressed. The corneal negative slow plll counterbalances the corneal positive c-wave (Steinberg et al. 1980). The corneal positive c-wave is also due to K+ decrease in the sub-retinal space, but is attributed to a change in apical transmembrane potential of the retinal pigment epithelium (RPE) (Steinberg et al. 1970; Wu et al. 2004). The absence of the slow plll, corneal negative potential in KCNJ10−/− knockout mice (Kofuji et al. 2000), in combination with the positive potential generated by the apical RPE, is predicted to enhance the corneal positive c-wave. This has been confirmed in KCJN10 heterozygous mice (Wu et al. 2004). Two of our patients showed a delay in the onset of the b-wave at dim flash strengths that in part may reflect the raised distal K+ concentration in the outer retina, which impairs slow plll and delays the suppression of glutamate release.
Light-activated proximal retinal neurons release K+ in the inner plexiform layer that depolarises Muller cells. In the dark-adapted eye this generates the scotopic threshold response, elicited by extremely dim flashes. This is difficult to acquire clinically in humans and could not be evaluated in our study. In the light-adapted retina the K+ efflux in the proximal retina associated with spiking neuron activity could be responsible for the PhNR (Frishman et al. 1992). Up-regulation of KCNJ10 expression in experimental models of retinal dysfunction is associated with an increase in negative potential amplitude (Machida et al. 2008; Raz-Prag et al. 2010). In our patients the PhNRs, relative to the b-wave, were of significantly smaller amplitude than controls, which would be consistent with KCNJ10 dysfunction and impaired Muller cell K+ currents in the proximal retina. A potential alternative explanation may be that the small PhNR reflects reduced numbers of ganglion cell axons, but the presence of a normal retinal nerve fibre layer thickness on OCT suggests this is not the case.
Spiking neuron activity in the proximal retina is associated to some extent with OPs. Early OPs were delayed and the later OP3 was small in our patients. This greater impact on later OPs is in keeping with impaired currents in the proximal retina. Tetrodotoxin, which blocks voltage-gated sodium channels and action potentials produced by ganglion cells and certain types of amacrine cells, can reduce the amplitude of the later OPs as well as reducing the amplitude of the PhNR in some animal experiments (Viswanathan et al. 1999; Dong et al. 2004; Sakai et al. 2009). Our observation suggests a role for glial K+ buffering in OP generation, though the mechanisms are not clear. This is relevant to the interpretation of enhanced OPs and PhNR responses in animal models of retinal degeneration (Machida et al. 2008; Sakai et al. 2009). It is also possible that astrocytes in the optic nerve head in primates buffer K+ released by ganglion cells, but to date there is no evidence of KCNJ10 expression in these astrocytes.
We noted delays in the time to peak of ERG components as flash luminance strength changed in both the light-adapted and dark-adapted retina. Although the time to peaks of the photopic ERG b-waves were delayed they showed the photopic hill phenomenon. This requires a reduced on-component amplitude and a delayed off-component to high flash luminance. The presence of a photopic hill indicates that KCNJ10 mutations do not differentially effect on- and off-pathway function in the inner retina (Ueno et al. 2004).
The scotopic b-wave reflects rod-driven on-bipolar cell depolarisation, which requires a reduction of glutamate release from the photoreceptor. There was a delay of up to 20 ms before the onset of the b-wave to dim flashes in the dark-adapted retina in two of our patients. This suggests that the sensitivity at the synapse between rod and on-bipolars is affected by the KCNJ10 mutation. This could be caused by cumulative changes in the resting membrane potentials of photoreceptors, bipolar and Muller cells which, in addition to changing the time of glutamate release, may also affect the rate of glutamate uptake. Glutamate is the prominent excitatory neurotransmitter in the retina. It is released continuously from the photoreceptors in the dark, and its release is modulated by light. It requires removal and re-synthesis from the synapse, and Muller cells play an important role in this cycle, though more in the proximal than distal retina (Sarthy et al. 2005; Bringmann et al. 2009).
Glutamate uptake by a Muller cell depends upon its strongly negative membrane potential. If the Muller cell membrane is depolarised, as has been reported in KCNJ10−/− mice, glutamate uptake would be impaired (Djukic et al. 2007). Mice mutants with impaired glutamate transport, due to mutations in a glutamate aspartate transporter expressed on Muller cells, have shown delays in the ERG time to peaks, with reduced amplitude b-waves and missing later OPs (Harada et al. 1998). Our patients exhibited delays in time to peaks to low time-integrated flash luminances.
In patients 1, 2 and 4 the amplitude of the scotopic b-wave, reflecting rod to on-bipolar transmission, rose rapidly from the 5th to 95th centile with increasing flash strength. This probably reflects the exponential delays in b-wave generation that a disturbance of the ionic microenvironment due to reduction or loss of K+ spatial buffering by Muller cells may cause at low flash strengths.
In summary, the light-adapted retina of all patients studied with proven KCNJ10 mutations show a striking reduction of the PhNR, which reflects impaired K+ currents in the proximal retina. Two patients also showed a marked alteration in the sensitivity of the dark-adapted eye, consistent with impairment of both distal and proximal retinal K+ currents.
Acknowledgments
Financial support was from the Deutsche Forschungsgemeinschaft (SFB699) to R.W. No authors have any financial/conflicting interests to disclose.
Glossary
Abbreviations
- ERG
electroretinogram
- KCJN10 (Kir4.1)
ATP-sensitive inward rectifier potassium channel, subfamily J, member 10
- OCT
optical coherence tomogram
- OPs
oscillatory potentials
- PhNR
photopic negative response
- RPE
retinal pigment epithelium
Author contributions
All authors contributed to the study conception, data interpretation, critical revision and approval of the final version. The study was carried out in the Clinical and Academic Department of Ophthalmology at Great Ormond Street Hospital for Children, London UK.
References
- Bockenhauer D, Feather S, Stanescu HC, Bandulik S, Zdebik AA, Reichold M, et al. Epilepsy, ataxia, sensorineural deafness, tubulopathy, and KCNJ10 mutations. N Engl J Med. 2009;360:1960–1970. doi: 10.1056/NEJMoa0810276. [DOI] [PMC free article] [PubMed] [Google Scholar]
- Bringmann A, Pannicke T, Biedermann B, Francke M, Iandiev I, Grosche J, et al. Role of retinal glial cells in neurotransmitter uptake and metabolism. Neurochem Int. 2009;54:143–160. doi: 10.1016/j.neuint.2008.10.014. [DOI] [PubMed] [Google Scholar]
- Connors NC, Kofuji P. Potassium channel Kir4.1 macromolecular complex in retinal glial cells. Glia. 2006;53:124–131. doi: 10.1002/glia.20271. [DOI] [PubMed] [Google Scholar]
- Djukic B, Casper KB, Philpot BD, Chin LS, McCarthy KD. Conditional knock-out of Kir4.1 leads to glial membrane depolarization, inhibition of potassium and glutamate uptake, and enhanced short-term synaptic potentiation. J Neurosci. 2007;27:11354–11365. doi: 10.1523/JNEUROSCI.0723-07.2007. [DOI] [PMC free article] [PubMed] [Google Scholar]
- Dong CJ, Agey P, Hare WA. Origins of the electroretinogram oscillatory potentials in the rabbit retina. Vis Neurosci. 2004;21:533–543. doi: 10.1017/S0952523804214043. [DOI] [PubMed] [Google Scholar]
- Evans LS, Peachey NS, Marchese AL. Comparison of three methods of estimating the parameters of the Naka-Rushton equation. Doc Ophthalmol. 1993;84:19–30. doi: 10.1007/BF01203279. [DOI] [PubMed] [Google Scholar]
- Frishman LJ, Steinberg RH. Intraretinal analysis of the threshold dark-adapted ERG of cat retina. J Neurophysiol. 1989;61:1221–1232. doi: 10.1152/jn.1989.61.6.1221. [DOI] [PubMed] [Google Scholar]
- Frishman LJ, Yamamoto F, Bogucka J, Steinberg RH. Light-evoked changes in [K+]o in proximal portion of light-adapted cat retina. J Neurophysiol. 1992;67:1201–1212. doi: 10.1152/jn.1992.67.5.1201. [DOI] [PubMed] [Google Scholar]
- Granit R. Sensory Mechanisms of the Retina. London: Oxford University Press; 1947. [Google Scholar]
- Harada T, Harada C, Watanabe M, Inoue Y, Sakagawa T, Nakayama N, et al. Functions of the two glutamate transporters GLAST and GLT-1 in the retina. Proc Natl Acad Sci U S A. 1998;95:4663–4666. doi: 10.1073/pnas.95.8.4663. [DOI] [PMC free article] [PubMed] [Google Scholar]
- Ishii M, Horio Y, Tada Y, Hibino H, Inanobe A, Ito M, et al. Expression and clustered distribution of an inwardly rectifying potassium channel, KAB-2/Kir4.1, on mammalian retinal Muller cell membrane: their regulation by insulin and laminin signals. J Neurosci. 1997;17:7725–7735. doi: 10.1523/JNEUROSCI.17-20-07725.1997. [DOI] [PMC free article] [PubMed] [Google Scholar]
- Kofuji P, Biedermann B, Siddharthan V, Raap M, Iandiev I, Milenkovic I, et al. Kir potassium channel subunit expression in retinal glial cells: implications for spatial potassium buffering. Glia. 2002;39:292–303. doi: 10.1002/glia.10112. [DOI] [PubMed] [Google Scholar]
- Kofuji P, Ceelen P, Zahs KR, Surbeck LW, Lester HA, Newman EA. Genetic inactivation of an inwardly rectifying potassium channel (Kir4.1 subunit) in mice: phenotypic impact in retina. J Neurosci. 2000;20:5733–5740. doi: 10.1523/JNEUROSCI.20-15-05733.2000. [DOI] [PMC free article] [PubMed] [Google Scholar]
- Kucheryavykh YV, Shuba YM, Antonov SM, Inyushin MY, Cubano L, Pearson WL, et al. Complex rectification of Muller cell Kir currents. Glia. 2008;56:775–790. doi: 10.1002/glia.20652. [DOI] [PMC free article] [PubMed] [Google Scholar]
- Machida S, Raz-Prag D, Fariss RN, Sieving PA, Bush RA. Photopic ERG negative response from amacrine cell signaling in RCS rat retinal degeneration. Invest Ophthalmol Vis Sci. 2008;49:442–452. doi: 10.1167/iovs.07-0291. [DOI] [PubMed] [Google Scholar]
- Machida S, Tamada K, Oikawa T, Gotoh Y, Nishimura T, Kaneko M, Kurosaka D. Comparison of photopic negative response of full-field and focal electroretinograms in detecting glaucomatous eyes. J Ophthalmol. 2011;2011:564131. doi: 10.1155/2011/564131. [DOI] [PMC free article] [PubMed] [Google Scholar]
- Newman E, Reichenbach A. The Muller cell: a functional element of the retina. Trends Neurosci. 1996;19:307–312. doi: 10.1016/0166-2236(96)10040-0. [DOI] [PubMed] [Google Scholar]
- Newman EA. Regional specialization of retinal glial cell membrane. Nature. 1984;309:155–157. doi: 10.1038/309155a0. [DOI] [PMC free article] [PubMed] [Google Scholar]
- Newman EA. Membrane physiology of retinal glial (Muller) cells. J Neurosci. 1985;5:2225–2239. doi: 10.1523/JNEUROSCI.05-08-02225.1985. [DOI] [PMC free article] [PubMed] [Google Scholar]
- Newman EA, Frambach DA, Odette LL. Control of extracellular potassium levels by retinal glial cell K+ siphoning. Science. 1984;225:1174–1175. doi: 10.1126/science.6474173. [DOI] [PMC free article] [PubMed] [Google Scholar]
- Raz-Prag D, Grimes WN, Fariss RN, Vijayasarathy C, Campos MM, Bush RA, et al. Probing potassium channel function in vivo by intracellular delivery of antibodies in a rat model of retinal neurodegeneration. Proc Natl Acad Sci U S A. 2010;107:12710–12715. doi: 10.1073/pnas.0913472107. [DOI] [PMC free article] [PubMed] [Google Scholar]
- Reichenbach A, Henke A, Eberhardt W, Reichelt W, Dettmer D. K+ ion regulation in retina. Can J Physiol Pharmacol. 1992;70(Suppl):S239–S247. doi: 10.1139/y92-267. [DOI] [PubMed] [Google Scholar]
- Reichold M, Zdebik AA, Lieberer E, Rapedius M, Schmidt K, Bandulik S, et al. KCNJ10 gene mutations causing EAST syndrome (epilepsy, ataxia, sensorineural deafness, and tubulopathy) disrupt channel function. Proc Natl Acad Sci U S A. 2010;107:14490–14495. doi: 10.1073/pnas.1003072107. [DOI] [PMC free article] [PubMed] [Google Scholar]
- Sakai T, Kondo M, Ueno S, Koyasu T, Komeima K, Terasaki H. Supernormal ERG oscillatory potentials in transgenic rabbit with rhodopsin P347L mutation and retinal degeneration. Invest Ophthalmol Vis Sci. 2009;50:4402–4409. doi: 10.1167/iovs.09-3458. [DOI] [PubMed] [Google Scholar]
- Sarthy VP, Pignataro L, Pannicke T, Weick M, Reichenbach A, Harada T, et al. Glutamate transport by retinal Muller cells in glutamate/aspartate transporter-knockout mice. Glia. 2005;49:184–196. doi: 10.1002/glia.20097. [DOI] [PubMed] [Google Scholar]
- Scholl UI, Choi M, Liu T, Ramaekers VT, Hausler MG, Grimmer J, et al. Seizures, sensorineural deafness, ataxia, mental retardation, and electrolyte imbalance (SeSAME syndrome) caused by mutations in KCNJ10. Proc Natl Acad Sci U S A. 2009;106:5842–5847. doi: 10.1073/pnas.0901749106. [DOI] [PMC free article] [PubMed] [Google Scholar]
- Steinberg RH, Oakley B, Niemeyer G. Light-evoked changes in [K+]o in retina of intact cat eye. J Neurophysiol. 1980;44:897–921. doi: 10.1152/jn.1980.44.5.897. [DOI] [PubMed] [Google Scholar]
- Steinberg RH, Schmidt R, Brown KT. Intracellular responses to light from cat pigment epithelium: origin of the electroretinogram c-wave. Nature. 1970;227:728–730. doi: 10.1038/227728a0. [DOI] [PubMed] [Google Scholar]
- Ueno S, Kondo M, Niwa Y, Terasaki H, Miyake Y. Luminance dependence of neural components that underlies the primate photopic electroretinogram. Invest Ophthalmol Vis Sci. 2004;45:1033–1040. doi: 10.1167/iovs.03-0657. [DOI] [PubMed] [Google Scholar]
- Viswanathan S, Frishman LJ, Robson JG. The uniform field and pattern ERG in macaques with experimental glaucoma: removal of spiking activity. Invest Ophthalmol Vis Sci. 2000;41:2797–2810. [PubMed] [Google Scholar]
- Viswanathan S, Frishman LJ, Robson JG, Harwerth RS, Smith EL., III The photopic negative response of the macaque electroretinogram: reduction by experimental glaucoma. Invest Ophthalmol Vis Sci. 1999;40:1124–1136. [PubMed] [Google Scholar]
- Wu J, Marmorstein AD, Kofuji P, Peachey NS. Contribution of Kir4.1 to the mouse electroretinogram. Mol Vis. 2004;10:650–654. [PMC free article] [PubMed] [Google Scholar]


