

Non-technical summary
ATP has been proposed to contribute to the local regulation of skeletal muscle blood flow by inducing local vasodilatation. ATP is continuously released, degraded and taken up by cells and the physiological levels are therefore difficult to determine. In the present investigation, we used a novel technique involving microdialysis probes to determine plasma ATP levels in blood vessels supplying and draining resting and contracting human skeletal muscle and to investigate the stimuli for ATP release. The results show a local release of ATP into arterial and venous blood. In addition, we found that thigh compression is a stimulus for ATP release. Furthermore, we find that the half-life of ATP in arterial blood is <1 s.
Abstract
Abstract
Intraluminal ATP could play an important role in the local regulation of skeletal muscle blood flow, but the stimuli that cause ATP release and the levels of plasma ATP in vessels supplying and draining human skeletal muscle remain unclear. To gain insight into the mechanisms by which ATP is released into plasma, we measured plasma [ATP] with the intravascular microdialysis technique at rest and during dynamic exercise (normoxia and hypoxia), passive exercise, thigh compressions and arterial ATP, tyramine and ACh infusion in a total of 16 healthy young men. Femoral arterial and venous [ATP] values were 109 ± 34 and 147 ± 45 nmol l−1 at rest and increased to 363 ± 83 and 560 ± 111 nmol l−1, respectively, during exercise (P < 0.05), whereas these values did not increase when exercise was performed with the other leg. Hypoxia increased venous plasma [ATP] at rest compared to normoxia (P < 0.05), but not during exercise. Arterial ATP infusion (≤1.8 μmol min−1) increased arterial plasma [ATP] from 74 ± 17 to 486 ± 82 nmol l−1 (P < 0.05), whereas it remained unchanged in the femoral vein at ∼150 nmol l−1. Both arterial and venous plasma [ATP] decreased during acetylcholine infusion (P < 0.05). Rhythmic thigh compressions increased arterial and venous plasma [ATP] compared to baseline conditions, whereas these values did not change during passive exercise or tyramine infusion. These results demonstrate that ATP is released locally into arterial and venous plasma during exercise and during hypoxia at rest. Compression of the vascular system could contribute to the increase during exercise whereas there appears to be little ATP release in response to increased blood flow, vascular stretch or sympathetic ATP release. Furthermore, the half-life of arterially infused ATP is <1 s.
Introduction
Intraluminal ATP has been proposed to contribute to the local regulation of skeletal muscle blood flow by inducing local and conducted vasodilatation (Ellsworth et al. 1995). ATP sensitive purinergic P2 receptors are present in the endothelium of human skeletal muscle cells (Mortensen et al. 2009a) and arterial infusion of ATP in the human leg can induce vasodilatation close to that observed during maximal exercise (González-Alonso et al. 2002; Rosenmeier et al. 2004).
Determination of plasma [ATP] is crucial to understand the role of ATP in the regulation of skeletal muscle blood flow and to elucidate what physiological stimuli can induce ATP release. Previous studies in humans have attempted to determine plasma [ATP] in blood samples, but because of the rapid enzymatic degradation of nucleotides by soluble nucleotidases (Yegutkin et al. 2007), and endothelial (Marcus et al. 2003) and lymphoid (Heptinstall et al. 2005) membrane-bound nucleoside triphosphate diphosphohydrolase as well as uptake by red blood (Wang et al. 2005) and endothelial cells, the half-life of ATP is estimated to be only a few seconds. Therefore, despite use of stop solutions and rapid centrifugation, ATP determinations from blood samples are difficult to interpret, and the actual [ATP] in the vascular beds supplying and draining resting and contracting muscles in humans remains controversial as indicated by the large variation in reported values (Gorman et al. 2007). The ATP response during exercise remains controversial as plasma [ATP] has been reported to remain unchanged (Rosenmeier et al. 2004; González-Alonso et al. 2006; Dufour et al. 2010) or to increase (González-Alonso et al. 2002) during exercise. In the present study we used a novel technique based on intravascular microdialysis probes to avoid the problem of blood sampling and centrifugation and thereby determine a more accurate [ATP] in human plasma.
The physiological stimuli for ATP release in vivo in the vasculature of human muscle remains unclear. In vitro evidence indicates that ATP is released from erythrocytes in association with the offloading of O2 from the haemoglobin molecule (Bergfeld & Forrester, 1992; Ellsworth et al. 1995) and upon deformation (Sprague et al. 1996). In vitro data also suggest that endothelial cells can release ATP in response to shear stress and hypoxia (Burnstock, 1999). Lastly, ATP can be co-released from sympathetic nerve terminals (Kennedy et al. 1986), which has been suggested to contribute to plasma ATP levels (Kluess et al. 2010). However, the role of shear stress and sympathetic ATP release for plasma [ATP] has not been examined in vivo and the methodological concerns regarding blood sampling make findings during hypoxia and exercise difficult to interpret.
Therefore, the purpose of this study was to determine: (1) [ATP] in vessels supplying and draining resting and contracting muscles in human plasma, (2) if ATP is released into plasma in response to hypoxia, and/or shear stress induced by increased blood flow, muscle stretch or muscle compressions, (3) if ATP is released into plasma from sympathetic nerve terminals and (4) the half-life of plasma ATP in blood vessels. To accomplish these aims, we measured arterial and venous plasma [ATP] with the microdialysis technique at rest, and during active and passive exercise, hypoxia, rhythmic external muscle compressions and arterial infusion of ATP, ACh or tyramine. We hypothesized that exercise and vascular stretch and compression would increase both arterial and venous [ATP] hypoxia would increase venous [ATP] at rest and during exercise, and that local increases in noradrenaline (NA) release would not result in measurable changes in [ATP].
Methods
A total of 16 moderately trained male subjects with a mean (±SD) age of 25 ± 4 years, body weight of 83 ± 8 kg, height of 184 ±6 cm and  of 4.4 ± 0.6 l min−1 participated in two studies. The subjects were informed of the risks and discomforts associated with the experiments before giving their informed, written consent to participate. The study was approved by the Ethics committee of the Copenhagen and Frederiksberg communities (KF 01-013/96 and KF 11289201) and conducted in accordance with the guidelines of the Declaration of Helsinki.
Experimental protocol
Prior to the experimental day, the subjects completed one training session to become accustomed to the one-leg knee-extensor model and they completed an incremental test to exhaustion to determine maximal workload and  during cycling and one-leg knee extensions. On the day of the experiment, the subjects arrived at the laboratory 1 h prior to the experiment after a light breakfast. Four catheters were placed in the experimental leg under local anaesthesia (Fig. 1). A catheter was placed in the femoral artery, 2 cm below the inguinal ligament and advanced 10 cm in the proximal direction. This catheter was used for blood sampling, blood pressure measurement and infusion of ATP, ACh or tyramine. A second catheter was placed in the femoral vein and advanced 5 cm proximal to the inguinal ligament. This catheter was used for blood sampling and blood pressure measurement. A third and fourth catheter were placed in the femoral artery and vein, respectively, 4–5 cm below the inguinal ligament and advanced 10 cm in the distal direction. A microdialysis probe (CMA 70 bolt, CMA Microdialysis, Stockholm, Sweden) with a 10 mm membrane (20 kDa cut-off) was inserted into these two catheters. All catheters were sutured to the skin and correct placement of microdialysis probes was verified by ultrasound.
Figure 1. Position and function of the catheters.

See text for details.
In study 1, the subjects (n = 10) completed the following trials after 60 min of rest: (1) one-leg knee-extensor exercise during normoxia ( =∼21%), (2) one-leg knee-extensor exercise during hypoxia (
 = 10–12.5%), (3) one-leg knee-extensor exercise with the non-experimental leg during normoxia, (4) arterial ATP infusion and (5) arterial ACh infusion. Dynamic exercise consisted of three 7 min bouts at 15, 30 and 45% of maximal workload (84 ± 4 W; 60 rpm). ATP and ACh were each infused during three stepwise 7 min infusions (ATP: 0.4 ± 0.0, 0.8 ± 0.0, 1.7 ± 0.1 μmol min−1 i.e. 0.03, 0.06, 0.12 μmol min−1 (kg leg mass)−1; Sigma A7699; and ACh: 160 ± 19, 340 ± 28 and 760 ± 19 μg min−1 i.e. 13, 28 and 62 μg min−1 (kg leg mass)−1; Miochol-E; Novartis).
In study 2 (n = 6) the subjects completed 7 min of: (1) passive exercise (60 rpm), (2) rhythmic thigh compressions (60 Hz), and (3) arterial tyramine infusion (1 μmol min−1 (kg leg mass)−1; Sigma). During passive exercise the leg was moved passively in the one-leg knee-extensor model at 60 rpm for 7 min. During thigh compressions, a blood pressure cuff was wrapped around the thigh and rapidly inflated and deflated with a cuff inflation unit (Hokanson E20, Bellevue, WA, USA). To simulate knee-extensor exercise, the cuff was inflated to ∼250 mmHg at a rate of 60 compressions per minute (González-Alonso et al. 2008). In three subjects, arterial and venous blood pressure was also measured from the antereograde catheter after removal of the microdialysis probe during exercise and thigh compressions. During the infusion trials and the rhythmic thigh compressions, subjects were placed in the supine position. In both studies, the trials was separated by 30 min of rest and orders of the trials were randomised.
Femoral arterial blood flow was measured with ultrasound Doppler (Logic E9, GE Healthcare) (Rådegran, 1997). Blood samples (1–5 ml) were drawn before each trial, during the 7 min of exercise/infusion/compression (3.5 min) and during the recovery period (3.5 min).
Heart rate was obtained from an electrocardiogram, while arterial and venous pressures were monitored with transducers positioned at the level of the heart and thigh, respectively (Pressure Monitoring Kit, Baxter). Leg vascular conductance was calculated as the quotient between leg blood flow (LBF) and the pressure difference between the femoral artery and the femoral vein. The calculated increase in plasma ATP during arterial ATP was calculated as: ATPinfused/(LBF × (1 − haematocrit)). ATP flux was calculated by multiplying [ATP] by plasma flow. Leg mass was determined by whole-body dual-energy X-ray absorptiometry scanning (Prodigy, GE Medical Systems, WI, USA). Blood gases, haemoglobin, hematocrit, glucose and lactate concentrations were measured using an ABL725 analyser (Radiometer, Copenhagen, Denmark).
Microdialysis procedure
The micodialysis probes were perfused at a rate of 5 μl min−1 with isotonic saline (0.9% NaCl) and microdialysate was collected for 7 min before each trial, during each trial (0.5–7 min) and during the 7 min recovery period. To determine the relative exchange of ATP over the dialysis membrane, a small amount (2.7 nm) of [2-3H]ATP (<0.1 μCi ml−1) was added to the perfusate for the calculation of probe recovery. Dalteparin (25 IE ml−1; Fragmin, Pfizer) was added to the perfusate to avoid blood clotting in the membrane.
The molecular probe recovery (PR) was calculated as [PR = (dpminfusate− dpmdialysate)/dpminfusate], where dpm denotes disintegrations per minute (Scheller & Kolb, 1991; Jansson et al. 1994). The 3H activity (in dpm) was measured on a liquid scintillation counter (Tri-Carb 2000; Copenhagen, Denmark) after addition of the infusate/dialysate (5 μl each) to 3.0 ml of Ultima Gold scintillation liquid (Perkin Elmer). After collection of samples, the microdialysate was weighed, and the actual flow rate was calculated to estimate any loss of fluid or abnormal decrease in perfusion rate. The relative loss (recovery) of ATP in the arterial probe was: 24 ± 1% (rest), 24 ± 2% (12 W), 27 ± 2% (24 W), 24 ± 2% (33 W), 23 ± 2% (recovery), 20 ± 3% (ATP 1), 23 ± 4% (ATP 2), 20 ± 2% (ATP3), 22 ± 4% (passive exercise), 24 ± 3% (compressions), and 22 ± 2% (tyramine). The venous probe recovery was: 29 ± 5% (rest), 30 ± 5% (12 W), 29 ± 5% (24 W), 27 ± 5% (33 W), 32 ± 5% (recovery), 17 ± 2% (ATP 1), 19 ± 4% (ATP 2), 16 ± 1% (ATP3), 24 ± 3% (passive exercise), 37 ± 3% (compressions), and 24 ± 1% (tyramine). The membrane cut-off (20 kDa) does not allow ectoenzymes and other proteins with molecular masses >20 kDa to pass the membrane and the dialysate is therefore free from ATP degrading enzymes and other plasma proteins that might carry ATP, such as albumin. The stability of the samples was confirmed in pilot studies showing no ATP degradation in the samples after 5 h (4°C).
Plasma ATP concentrations in the microdialysis perfusate and dialysate were measured immediately in duplicates with the luciferin–luciferase technique (BioTherma AB, Dalarö, Sweden) with an internal ATP standard procedure. The coefficient of variation between duplicate measurements was 8.7 ± 1.5%.
The plasma [ATP] values were calculated on the basis of the perfusate (inflow) and dialysate (outflow) concentrations, as well as recovery of each microdialysis probe, according to the following equation: ATP = (ATPOut− ATPIn)/relative loss, with the assumption that recovery was equal to the relative loss. To validate the intravascular microdialysis technique for ATP determination, microdialysis probes (n = 4) were put in containers with three known ATP concentrations (10, 100 and 1000 nmol l−1) under constant stirring. The calculated ATP concentrations from the perfusate were 9 ± 1, 102 ± 12 and 860 ± 22 nmol l−1.
Statistical analysis
A one- and two-way repeated measures ANOVA was performed to test significance within and between trials. Following a significant F test, pair-wise differences were identified using Tukey's honestly significant difference (HSD) post hoc procedure. The significance level was set at P < 0.05 and data are means ± SEM unless otherwise indicated.
Results
Leg haemodynamics and plasma [ATP] during one-leg knee extensor exercise during normoxia and hypoxia
Leg blood flow, mean arterial pressure (MAP) and vascular conductance increased progressively during one-leg knee-extensor exercise and returned to resting values during the recovery period (P < 0.05; Fig. 2). Hypoxia lowered arterial and venous O2 content (Table 1) and increased leg blood flow and vascular conductance before, during and after exercise compared to normoxia (P < 0.05), whereas MAP was similar. When exercise was performed with the non-experimental leg during normoxia (n = 6), leg blood flow and vascular conductance increased slightly (P < 0.05).
Figure 2. Leg haemodynamics before, during and after knee-extensor exercise.
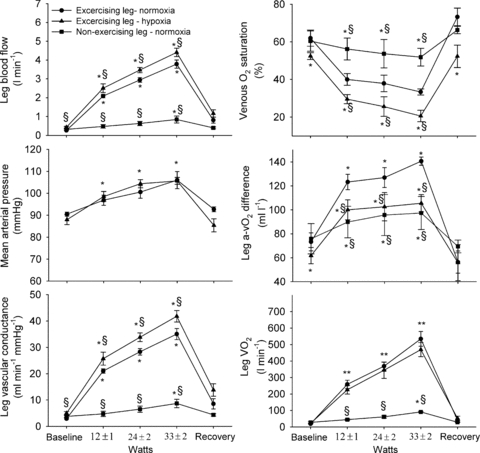
Leg blood flow, mean arterial pressure, leg vascular conductance, venous O2 saturation, leg arterio- venous O2 difference and leg  at rest, and during exercise and the recovery period in normoxic (
 : 21%) and hypoxic (
 : 10–12%) conditions. Data are means ± SEM for 6–10 subjects. *Different from baseline conditions, P < 0.05; §different from exercising leg during normoxia, P < 0.05.
Table 1.
Blood variables at rest and during incremental cycling to exhaustion
| Exercising leg – normoxia | Exercising leg – Hypoxia | Non-exercising leg – normoxia | |||||||||||||
|---|---|---|---|---|---|---|---|---|---|---|---|---|---|---|---|
| Rest | 12 ± 3 W | 24 ± 2 W | 33 ± 2 W | Recovery | Rest | 12 ± 3 W | 24 ± 2 W | 33 ± 2 W | Recovery | Rest | 12 ± 3 W | 24 ± 2 W | 33 ± 2 W | Recovery | |
 (mmHg) (mmHg) | |||||||||||||||
| a | 92 ± 3 | 100 ± 2 | 100 ± 1 | 101 ± 1 | 96 ± 2 | 44 ± 3† | 41 ± 2† | 40 ± 3† | 40 ± 3† | 45 ± 3† | 92 ± 3 | 101 ± 3 | 99 ± 3 | 99 ± 3 | 102 ± 4 |
| v | 34 ± 2 | 26 ± 1* | 26 ± 2* | 25 ± 1* | 44 ± 4* | 29 ± 1† | 20 ± 1*† | 20 ± 1*† | 19 ± 1*† | 37 ± 4*† | 35 ± 2 | 34 ± 3 | 33 ± 3 | 31 ± 1 | 36 ± 2 |
| Haemoglobin (g dl−1) | |||||||||||||||
| a | 14.8 ± 0.4 | 15.1 ± 0.4 | 15.2 ± 0.4 | 15.4 ± 0.4* | 15.3 ± 0.04 | 14.8 ± 0.4 | 15.1 ± 0.4 | 15.3 ± 0.5 | 15.4 ± 0.5 | 15.3 ± 0.4 | 14.7 ± 0.5 | 15.1 ± 0.6 | 15.2 ± 0.6 | 15.3 ± 0.7 | 15.3 ± 0.6 |
| v | 14.8 ± 0.4 | 15.1 ± 0.4 | 15.2 ± 0.4 | 15.4 ± 0.4* | 15.0 ± 0.04 | 14.5 ± 0.5 | 15.0 ± 0.5 | 15.3 ± 0.5 | 15.2 ± 0.5 | 15.0 ± 0.4 | 14.7 ± 0.4 | 15.0 ± 0.6 | 15.2 ± 0.5 | 15.6 ± 0.6 | 15.2 ± 0.6 |
| O2 saturation (%) | |||||||||||||||
| a | 97.1 ± 0.4 | 97.9 ± 0.1 | 97.9 ± 0.1 | 97.8 ± 0.1 | 97.7 ± 0.2 | 80.3 ± 4.1† | 76.9 ± 4.7*† | 74.1 ± 6.0*† | 72.4 ± 6.1*† | 77.5 ± 5.2† | 97.1 ± 0.3 | 97.8 ± 0.3 | 97.9 ± 0.2 | 97.7 ± 0.2 | 98.1 ± 0.2 |
| v | 61.9 ± 4.3 | 40.0 ± 3.1* | 37.9 ± 4.4* | 33.4 ± 1.6* | 73.3 ± 4.7* | 52.4 ± 1.8† | 29.5 ± 2.4*† | 25.6 ± 5.2*† | 20.6 ± 3.0*† | 52.3 ± 5.9† | 60.4 ± 5.4 | 56.2 ± 5.8 | 53.7 ± 7.5 | 51.9 ± 4.7* | 66.3 ± 2.0 |
| O2 content (ml l−1) | |||||||||||||||
| a | 201 ± 5 | 207 ± 5* | 208 ± 5* | 211 ± 5* | 209 ± 5* | 165 ± 10† | 162 ± 10† | 157 ± 10† | 151 ± 12*† | 165 ± 10† | 199 ± 6 | 205 ± 7 | 208 ± 7 | 208 ± 9* | 209 ± 7* |
| v | 128 ± 8 | 84 ± 7* | 81 ± 9* | 59 ± 11* | 153 ± 9* | 106 ± 7† | 62 ± 5*† | 54 ± 10*† | 46 ± 7*† | 109 ± 11*† | 123 ± 7 | 116 ± 8† | 112 ± 10*† | 111 ± 6*† | 139 ± 4*† |
| Lactate (mmol l−1) | |||||||||||||||
| a | 0.7 ± 0.0 | 0.8 ± 0.1 | 1.0 ± 0.1 | 1.2 ± 0.1* | 1.2 ± 0.1 | 0.8 ± 0.1 | 1.1 ± 0.1 | 1.6 ± 0.2* | 2.0 ± 0.2*† | 2.4 ± 0.2* | 0.7 ± 0.0 | 0.9 ± 0.1 | 1.0 ± 0.1 | 0.9 ± 0.1† | 1.2 ± 0.1 |
| v | 0.8 ± 0.0 | 1.0 ± 0.2 | 1.3 ± 0.1 | 1.6 ± 0.2* | 1.4 ± 0.1* | 0.9 ± 0.1 | 1.3 ± 0.2 | 2.2 ± 0.4*† | 2.8 ± 0.3*† | 3.2 ± 0.4* | 0.8 ± 0.0 | 1.0 ± 0.2 | 0.9 ± 0.1 | 1.1 ± 0.1† | 1.0 ± 0.1 |
| Glucose (mmol l−1) | |||||||||||||||
| a | 5.4 ± 0.1 | 5.6 ± 0.1 | 5.2 ± 0.1 | 5.1 ± 0.0 | 5.2 ± 0.1 | 5.9 ± 0.3 | 5.6 ± 0.2 | 5.4 ± 0.2 | 5.3 ± 0.2 | 5.3 ± 0.1 | 5.3 ± 0.1 | 5.6 ± 0.1 | 5.2 ± 0.1 | 5.1 ± 0.1 | 5.1 ± 0.1 |
| v | 4.9 ± 0.1 | 5.1 ± 0.1 | 4.8 ± 0.1 | 4.7 ± 0.0 | 4.3 ± 0.0 | 5.5 ± 0.3 | 5.3 ± 0.2 | 5.2 ± 0.2 | 5.1 ± 0.2 | 4.8 ± 0.2 | 5.0 ± 0.1 | 5.1 ± 0.1 | 5.0 ± 0.1 | 5.0 ± 0.1 | 4.9 ± 0.0 |
Values are means ± SEM for 9 subjects.
Different from rest
different from exercising leg during normoxia, P < 0.05.
Femoral arterial plasma [ATP] was 109 ± 34 nmol l−1 at rest and increased to 363 ± 83 nmol l−1 during exercise (P < 0.05) (Fig. 3). In the femoral vein, resting plasma [ATP] was 147 ± 45 nmol l−1 and it increased progressively to 560 ± 111 nmol l−1. Hypoxia increased femoral venous plasma [ATP] at rest (267 ± 55 nmol l−1; P < 0.05), but did not alter either femoral arterial (335 ± 44 nmol l−1) or femoral venous (545 ± 47 nmol l−1) [ATP] during exercise or in the recovery period. In the non-exercising leg, arterial and venous plasma [ATP] remained at baseline values during exercise. The venous–arterial plasma [ATP] difference tended to be increased at 24 ± 2 W during normoxia (P = 0.053) and was increased at 33 ± 2 W during both normoxia and hypoxia (P < 0.05). Exercise increased the arterial ATP flux from 15 ± 5 to 831 ± 228 nmol min−1 (33 W; P < 0.05) and venous ATP flux from 22 ± 6 to 1180 ± 336 nmol min−1 (33 W; P < 0.05) during normoxia. During hypoxia, arterial ATP flux was increased from 27 ± 7 to 790 ± 106 nmol min−1 (33 W; P < 0.05) and venous ATP flux from 69 ± 21 to 1305 ± 116 nmol min−1 (33 W; P < 0.05).
Figure 3. Plasma ATP levels before, during and after knee-extensor exercise.

Femoral arterial [ATP], venous plasma [ATP] and arterio-venous plsma [ATP] difference at rest, and during exercise and the recovery period in normoxic and hypoxic conditions. Data are means ± SEM for 6–10 subjects. *Different from baseline conditions, P < 0.05; §different from exercising leg during normoxia, P < 0.05.
Leg haemodynamics and plasma [ATP] during femoral arterial ATP and ACh infusion
Stepwise femoral arterial ATP and ACh infusion increased leg blood flow and vascular conductance (Fig. 4; P < 0.05), whereas MAP was reduced compared to baseline conditions (P < 0.05).
Figure 4. Leg haemodynamics before, during and after arterial ACh or ATP infusion.

Leg blood flow, mean arterial pressure and leg vascular conductance before, during and after arterial ATP (0.4 ± 0.0, 0.8 ± 0.0, 1.7 ± 0.1 μmol min−1) or acetylcholine (160 ± 19, 340 ± 28 and 760 ± 19 μg min−1) infusion. Data are means ± SEM for 8–10 subjects. *Different from baseline conditions, P < 0.05; §different from ATP infusion, P < 0.05.
During the ATP infusion trial, arterial plasma [ATP] increased from 74 ± 17 nmol l−1 at baseline to 486 ± 82 nmol l−1, whereas it remained unchanged in the femoral vein (Fig. 5). Compared to the calculated increase in femoral arterial plasma ATP, 36 ± 7 (0.4 μmol min−1), 43 ± 5 (0.8 μmol min−1) and 48 ± 4% (1.7 μmol min−1) of the infused ATP could be detected ∼20 cm downstream (Fig. 6). The mean time for the blood to travel 20 cm during ATP infusion was 0.3–0.7 s, which corresponds to an estimated half-life of the infused ATP of 0.3–0.5 s. During ACh infusion, both arterial and venous [ATP] were reduced compared to baseline levels (P < 0.05). ACh infusion increased arterial ATP flux from 28 ± 12 at baseline to 104 ± 20 nmol min−1 (760 μg min−1; P < 0.05) and venous ATP flux from 31 ± 13 to 112 ± 29 nmol min−1 (P < 0.05).
Figure 5. Plasma ATP levels before, during and after arterial ACh or ATP infusion.
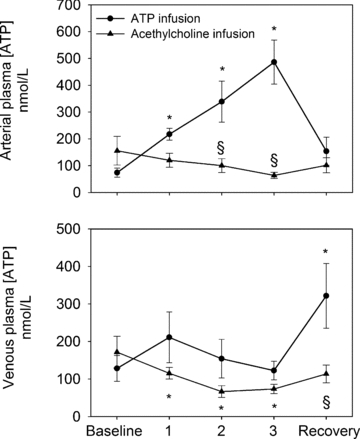
Femoral arterial and venous plasma [ATP] before, during and after arterial ATP (0.4 ± 0.0, 0.8 ± 0.0, 1.7 ± 0.1 μmol min−1) or acetylcholine (160 ± 19, 340 ± 28 and 760 ± 19 μg min−1) infusion. Data are means ± SEM for 8–10 subjects. *Different from baseline conditions, P < 0.05; §different from ATP infusion, P < 0.05.
Figure 6. Measured arterial plasma ATP levels during upstream arterial ATP infusion.
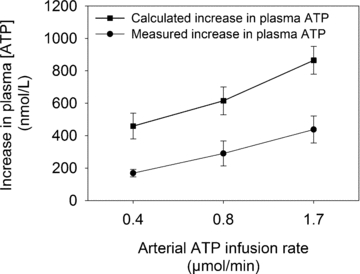
Measured increase in arterial plasma [ATP] plotted against the calculated increase in arterial [ATP] during arterial infusion of ATP ∼20 cm upstream from the measuring point. Data are means ± SEM for 8–10 subjects.
Leg haemodynamics and plasma [ATP] during passive exercise, thigh compressions and tyramine infusion
Passive exercise and muscle compressions increased leg blood flow from 0.29 ± 0.04 and 0.27 ± 0.05 l min−1, respectively, to 0.54 ± 0.60 and 0.72 ± 0.10 l min−1, respectively (P < 0.05), whereas infusion of tyramine lowered leg blood flow to 0.15 ± 0.02 l min−1 (Fig. 7). During the recovery period, leg blood flow returned to baseline levels in all conditions. Mean arterial pressure was unaltered during passive exercise (96 ± 2 and 98 ± 1 mmHg during baseline conditions and passive exercise, respectively), thigh compressions (88 ± 1 and 90 ± 1 mmHg, respectively) or tyramine infusion (90 ± 1 and 95 ± 1 mmHg, respectively). When blood pressure was measured under the cuff during thigh compressions (n = 3), MAP (98 ± 1 mmHg) was similar to rest (98 ± 3 mmHg), but distortion of the arterial pressure curve was clearly evident and mean femoral venous pressure increased from 6 ± 1 to 14 ± 1 mmHg.
Figure 7. Leg blood flow and plasma ATP levels during passive exercise, rhythmic thigh compressions and arterial tyramine infusion.

The change in leg blood flow, arterial and venous [ATP] during passive exercise, rhythmic thigh compressions and arterial tyramine infusion compared to baseline conditions. Data are means ± SEM for 6 subjects. *Different from baseline conditions, P < 0.05.
Femoral arterial and venous [ATP] were 62 ± 14 and 88 ± 12 nmol l−1, respectively, before passive exercise and the plasma [ATP] did not change with passive exercise or in the recovery period. Femoral arterial and venous [ATP] were 57 ± 9 and 45 ± 8 nmol l−1, respectively, before tyramine infusion and they did not change during tyramine infusion or in the recovery period. Rhythmic thigh compressions increased femoral arterial and venous [ATP] from 57 ± 9 and 91 ± 34 nmol l−1, respectively, to 75 ± 13 and 618 ± 193 nmol l−1, respectively (P < 0.05), and arterial and venous [ATP] returned to baseline levels during the recovery period. Thigh compressions increased arterial ATP flux from 4 ± 1 at baseline to 33 ± 3 nmol min−1 (P < 0.05) and venous ATP flux from 11 ± 4 to 295 ± 121 nmol min−1 (P < 0.05). Arterial and venous ATP flux remained unchanged during passive exercise and tyramine infusion compared to baseline values.
Discussion
To investigate the stimulus for ATP release into arterial and venous plasma in skeletal muscle, we used novel intravascular microdialysis probes during conditions that could stimulate ATP release. The results provide new insight into the release and degradation of ATP in plasma. Firstly, femoral arterial and venous plasma [ATP] increased progressively with exercise intensity in the exercising leg, whereas it did not increase in the non-exercising leg. Secondly, rhythmic muscle compressions but not passive exercise, tyramine or ACh infusion increased arterial or venous plasma ATP levels. Thirdly, hypoxia increased venous ATP at rest, but not during exercise. Fourthly, only 35–50% of the infused ATP could be recovered ∼20 cm from the infusion point. Collectively, these results demonstrate that ATP is released locally into both arterial and venous blood during exercise and that compression of the vasculature as well as hypoxia stimulates ATP release into plasma. Furthermore, the results demonstrate that arterial plasma ATP is rapidly degraded or taken up by cells.
A major novel finding was that whereas plasma [ATP] remained unchanged in the non-exercising limb, it increased 3-fold within the femoral artery of the exercising limb, demonstrating a local release of ATP in the conduit artery of the exercising limb. The close coupling between plasma [ATP] and vascular conductance across exercise conditions (Fig. 8) supports a role of plasma ATP in skeletal muscle blood flow regulation. Investigation into the mechanisms leading to local release of ATP, showed that compression of the thigh is a stimulus for ATP release into both the femoral artery and the femoral vein and induces vasodilatation (Clifford et al. 2006; González-Alonso et al. 2008). In contrast, enhanced endothelial shear stress induced by passively moving the leg or increasing blood flow did not result in an increased arterial or venous [ATP]. These observations suggest that it is the compression per se and not the increase in blood flow induced by compression that was the main stimulus for ATP release. The lack of increase in plasma ATP with ACh infusion or passive movement is in contrast with previous in vitro observations showing that endothelial cells release ATP in response to enhanced shear stress (Milner et al. 1990; Milner et al. 1996). However, differences in the leg blood flow response between conditions could mask endothelial ATP release. When considering this difference in blood flow response, we observed a 4-fold increase in ATP flux during ACh infusion and 10- to 30-fold increase during thigh compressions. Hypoxia increased venous plasma [ATP] at rest, suggesting that ATP is released from erythrocytes upon deoxygenation (Ellsworth et al. 1995). However, venous [ATP] remained similar to normoxia during exercise (González-Alonso et al. 2002, 2006). A possibility is that the level of additional deoxygenation in the capillaries was not sufficient to be detected in the femoral vein.
Figure 8. Arterial and venous [ATP] as a function of leg vascular conductance before, during and after knee-extensor exercise.

Arterial and venous [ATP] in the active and inactive limb before, during and after one-leg knee-extensor exercise plotted against leg vascular conductance. Data are means ± SEM for 8–10 subjects.
Co-release of ATP with noradrenaline (NA) from sympathetic nerve terminals does not appear to be a source of arterial or venous ATP either because tyramine infusion did not increase plasma [ATP] or ATP flux. Alternatively, ATP may not be co-released with NA when it is stimulated by tyramine (Driessen et al. 1996). However, our data are also in accordance with one of our previous observations showing a mismatch between interstitial NA and ATP levels in the exercising versus resting leg (Mortensen et al. 2009b). Collectively, these observations suggest that both arterial and venous [ATP] increase progressively with exercise intensity in the exercising limb and that muscle compression is a stimulus for arterial and venous ATP release. In resting conditions, ATP released from erythrocytes upon deoxygenation could contribute to blood flow regulation.
To avoid the confounding factors associated with blood sampling, we used a novel intravascular microdialysis technique to determine plasma ATP levels. Plasma [ATP] has been reported to either remain unchanged during exercise (Rosenmeier et al. 2004; González-Alonso et al. 2006; Dufour et al. 2010) or increase at intensities above 60% of maximal workload (González-Alonso et al. 2002). In the present study, a continuous increase in both arterial and venous [ATP] from rest to 45% of maximal workload was observed. Thus, the microdialysis technique appears to be a more sensitive method for detecting changes compared to blood sampling. Moreover, compared to previous data on plasma [ATP] measured in blood samples in resting and exercising humans (González-Alonso et al. 2002; Rosenmeier et al. 2004; González-Alonso et al. 2006), the measured [ATP] values were also 2- to 3-fold lower in the present study. A direct comparison between the blood sampling technique used in the previous studies and the intravascular microdialysis technique employed in the present study could not be made in the present study due to a limitation in the number of catheters that could be inserted. However, there are three likely explanations for the differences in the reported [ATP]. Firstly, the microdialysis technique allows in vivo separation of ATP from ATP degrading enzymes, proteins and red blood cells. In contrast, ATP is likely to be released after blood sampling, especially during centrifugation where there is deformation of red blood cells (Sprague et al. 1996). Secondly, the placement of the arterial and venous microdialysis probes in the distal direction allowed sampling closer to the contracting muscle compared to previous studies, which is pivotal due to the short half-life of plasma ATP. In fact, when the arterial microdialysis probe was placed in the proximal direction (n = 4; Mortensen SP, Hellsten Y, unpublished observations) instead of the distal direction, we did not observe an increase in arterial plasma [ATP] during exercise. Thirdly, previous studies analysed ATP levels in plasma samples that had been frozen and stored, which may have affected the levels. We have recently observed that [ATP] in plasma samples increase after freezing (S. P. Mortensen and Y. Hellsten, unpublished observations), possibly due to ATP release from albumin (Douillet et al. 2005). A limitation of the microdialysis technique compared to blood sampling is that sampling is slow such that transient changes cannot be detected.
To gain insight into the half-life of plasma ATP in blood vessels, we infused ATP in three doses and measured plasma ATP. The results show that ATP is rapidly degraded or taken up by cells as only 35–48% of the infused ATP could be detected in the artery ∼20 cm downstream from the infusion point and none of the infused ATP could be detected in the femoral vein. In vitro observations in whole blood and plasma suggest a half-life of ATP >2 min (Wang et al. 2005), indicating that the short half-life in vivo is caused by rapid uptake in endothelial cells or degradation by membrane-bound enzymes (Marcus et al. 2003). The present observations also suggest that ATP is released into the venous circulation, although the half-life of ATP in venous blood could be different from arterial blood. In vitro studies suggest that application of ATP to venules can induce vasodilatation in upstream arterioles (Collins et al. 1998; Hammer et al. 2001). In this setting, venous ATP may act as a signalling molecule to the arterial system (Hester & Hammer, 2002).
In conclusion, the present results provide evidence for that ATP is released locally into arterial and venous plasma of contracting muscle. Compression of the vascular bed and to a lesser extent increased flow-mediated shear stress could contribute to this increase. At rest, hypoxia stimulates ATP release. In contrast, the effect of passive limb movement or release of ATP from sympathetic nerve terminals alone do not appear to stimulate ATP release into plasma. Furthermore, these results suggest that the intravascular microdialysis technique is capable of detecting small changes in plasma ATP. The short half-life of arterially infused ATP suggests that ATP is rapidly degraded or taken up by cells thereby keeping the vasodilatory effect of released ATP within the muscle.
Acknowledgments
This study was supported by a grant from the Lundbeck foundation and the Danish Research Council. S.P.M. was supported by a grant from the Danish Heart Foundation and the Danish Research Council.
Author contributions
S.P.M.: conception and design of the experiments, collection, analysis and interpretation of data, and drafting the article. P.T.: collection, analysis and interpretation of data, and revising the article critically for important intellectual content. M.N.: collection, analysis and interpretation of data, and revising the article critically for important intellectual content. B.S.: conception and design of the experiments, interpretation of data, and revising the article critically for important intellectual content. Y.H.: conception and design of the experiments, collection, analysis and interpretation of data, and revising the article critically for important intellectual content.
References
- Bergfeld GR, Forrester T. Release of ATP from human erythrocytes in response to a brief period of hypoxia and hypercapnia. Cardiovasc Res. 1992;26:40–47. doi: 10.1093/cvr/26.1.40. [DOI] [PubMed] [Google Scholar]
- Burnstock G. Release of vasoactive substances from endothelial cells by shear stress and purinergic mechanosensory transduction. J Anat. 1999;194:335–342. doi: 10.1046/j.1469-7580.1999.19430335.x. [DOI] [PMC free article] [PubMed] [Google Scholar]
- Clifford PS, Kluess HA, Hamann JJ, Buckwalter JB, Jasperse JL. Mechanical compression elicits vasodilatation in rat skeletal muscle feed arteries. J Physiol. 2006;572:561–567. doi: 10.1113/jphysiol.2005.099507. [DOI] [PMC free article] [PubMed] [Google Scholar]
- Collins DM, McCullough WT, Ellsworth ML. Conducted vascular responses: communication across the capillary bed. Microvasc Res. 1998;56:43–53. doi: 10.1006/mvre.1998.2076. [DOI] [PubMed] [Google Scholar]
- Douillet CD, Suy S, Zarzaur BL, Robinson WP, Milano PM, Boucher RC, Rich PB. Measurement of free and bound fractions of extracellular ATP in biological solutions using bioluminescence. Luminescence. 2005;20:435–441. doi: 10.1002/bio.869. [DOI] [PubMed] [Google Scholar]
- Driessen B, Goncalves J, Szabo B. Failure of tyramine to release neuronal ATP as a cotransmitter of noradrenaline in the guinea-pig vas deferens. Naunyn Schmiedebergs Arch Pharmacol. 1996;353:175–183. doi: 10.1007/BF00168755. [DOI] [PubMed] [Google Scholar]
- Dufour SP, Patel RP, Brandon A, Teng X, Pearson J, Barker H, Ali L, Yuen AH, Smolenski RT, Gonzalez-Alonso J. Erythrocyte dependent regulation of human skeletal muscle blood flow: role of varied oxyhemoglobin and exercise on nitrite, S-nitrosohemoglobin and ATP. Am J Physiol Heart Circ Physiol. 2010;299:H1936–1946. doi: 10.1152/ajpheart.00389.2010. [DOI] [PMC free article] [PubMed] [Google Scholar]
- Ellsworth ML, Forrester T, Ellis CG, Dietrich HH. The erythrocyte as a regulator of vascular tone. Am J Physiol Heart Circ Physiol. 1995;269:H2155–H2161. doi: 10.1152/ajpheart.1995.269.6.H2155. [DOI] [PubMed] [Google Scholar]
- González-Alonso J, Mortensen SP, Dawson EA, Secher NH, Damsgaard R. Erythrocytes and the regulation of human skeletal muscle blood flow and oxygen delivery: role of erythrocyte count and oxygenation state of haemoglobin. J Physiol. 2006;572:295–305. doi: 10.1113/jphysiol.2005.101121. [DOI] [PMC free article] [PubMed] [Google Scholar]
- González-Alonso J, Mortensen SP, Jeppesen TD, Ali L, Barker H, Damsgaard R, Secher NH, Dawson EA, Dufour SP. Haemodynamic responses to exercise, ATP infusion and thigh compression in humans: insight into the role of muscle mechanisms on cardiovascular function. J Physiol. 2008;586:2405–2417. doi: 10.1113/jphysiol.2008.152058. [DOI] [PMC free article] [PubMed] [Google Scholar]
- González-Alonso J, Olsen DB, Saltin B. Erythrocyte and the regulation of human skeletal muscle blood flow and oxygen delivery: role of circulating ATP. Circ Res. 2002;91:1046–1055. doi: 10.1161/01.res.0000044939.73286.e2. [DOI] [PubMed] [Google Scholar]
- Gorman MW, Feigl EO, Buffington CW. Human plasma ATP concentration. Clin Chem. 2007;53:318–325. doi: 10.1373/clinchem.2006.076364. [DOI] [PubMed] [Google Scholar]
- Hammer LW, Ligon AL, Hester RL. ATP-mediated release of arachidonic acid metabolites from venular endothelium causes arteriolar dilation. Am J Physiol Heart Circ Physiol. 2001;280:H2616–H2622. doi: 10.1152/ajpheart.2001.280.6.H2616. [DOI] [PubMed] [Google Scholar]
- Heptinstall S, Johnson A, Glenn J, White A. Adenine nucleotide metabolism in human blood – important roles for leukocytes and erythrocytes. J Thromb Haemost. 2005;3:2331–2339. doi: 10.1111/j.1538-7836.2005.01489.x. [DOI] [PubMed] [Google Scholar]
- Hester RL, Hammer LW. Venular-arteriolar communication in the regulation of blood flow. Am J Physiol Regul Integr Comp Physiol. 2002;282:R1280–R1285. doi: 10.1152/ajpregu.00744.2001. [DOI] [PubMed] [Google Scholar]
- Jansson PA, Veneman T, Nurjhan N, Gerich J. An improved method to calculate adipose tissue interstitial substrate recovery for microdialysis studies. Life Sci. 1994;54:1621–1624. doi: 10.1016/0024-3205(94)90034-5. [DOI] [PubMed] [Google Scholar]
- Kennedy C, Saville VL, Burnstock G. The contributions of noradrenaline and ATP to the responses of the rabbit central ear artery to sympathetic nerve stimulation depend on the parameters of stimulation. Eur J Pharmacol. 1986;122:291–300. doi: 10.1016/0014-2999(86)90409-7. [DOI] [PubMed] [Google Scholar]
- Kluess HA, Stone AJ, Evanson KW. ATP overflow in skeletal muscle 1A arterioles. J Physiol. 2010;588:3089–3100. doi: 10.1113/jphysiol.2010.193094. [DOI] [PMC free article] [PubMed] [Google Scholar]
- Marcus AJ, Broekman MJ, Drosopoulos JHF, Islam N, Pinsky DJ, Sesti C, Levi R. Heterologous cell–cell interactions: thromboregulation, cerebroprotection and cardioprotection by CD39 (NTPDase-1) J Thromb Haemost. 2003;1:2497–2509. doi: 10.1111/j.1538-7836.2003.00479.x. [DOI] [PubMed] [Google Scholar]
- Milner P, Bodin P, Burnstock G. Long-term guanethidine sympathectomy suppresses flow-induced release of ATP and endothelin from endothelial cells isolated from adult rat aorta. J Vasc Res. 1996;33:139–145. doi: 10.1159/000159142. [DOI] [PubMed] [Google Scholar]
- Milner P, Kirkpatrick KA, Ralevic V, Toothill V, Pearson J, Burnstock G. Endothelial cells cultured from human umbilical vein release ATP, substance P and acetylcholine in response to increased flow. Proc Biol Sci. 1990;241:245–248. doi: 10.1098/rspb.1990.0092. [DOI] [PubMed] [Google Scholar]
- Mortensen SP, Gonzalez-Alonso J, Bune LT, Saltin B, Pilegaard H, Hellsten Y. ATP-induced vasodilation and purinergic receptors in the human leg: roles of nitric oxide, prostaglandins, and adenosine. Am J Physiol Regul Integr Comp Physiol. 2009a;296:R1140–R1148. doi: 10.1152/ajpregu.90822.2008. [DOI] [PubMed] [Google Scholar]
- Mortensen SP, Gonzalez-Alonso J, Nielsen JJ, Saltin B, Hellsten Y. Muscle interstitial ATP and norepinephrine concentrations in the human leg during exercise and ATP infusion. J Appl Physiol. 2009b;107:1757–1762. doi: 10.1152/japplphysiol.00638.2009. [DOI] [PubMed] [Google Scholar]
- Rådegran G. Ultrasound Doppler estimates of femoral artery blood flow during dynamic knee extensor exercise in humans. J Appl Physiol. 1997;83:1383–1388. doi: 10.1152/jappl.1997.83.4.1383. [DOI] [PubMed] [Google Scholar]
- Rosenmeier JB, Hansen J, González-Alonso J. Circulating ATP-induced vasodilatation overrides sympathetic vasoconstrictor activity in human skeletal muscle. J Physiol. 2004;558:351–365. doi: 10.1113/jphysiol.2004.063107. [DOI] [PMC free article] [PubMed] [Google Scholar]
- Scheller D, Kolb J. The internal reference technique in microdialysis: a practical approach to monitoring dialysis efficiency and to calculating tissue concentration from dialysate samples. J Neurosci Methods. 1991;40:31–38. doi: 10.1016/0165-0270(91)90114-f. [DOI] [PubMed] [Google Scholar]
- Sprague RS, Ellsworth ML, Stephenson AH, Lonigro AJ. ATP: the red blood cell link to NO and local control of the pulmonary circulation. Am J Physiol Heart Circ Physiol. 1996;271:H2717–H2722. doi: 10.1152/ajpheart.1996.271.6.H2717. [DOI] [PubMed] [Google Scholar]
- Wang L, Olivecrona G, Gotberg M, Olsson ML, Winzell MS, Erlinge D. ADP acting on P2Y13 receptors is a negative feedback pathway for ATP release from human red blood cells. Circ Res. 2005;96:189–196. doi: 10.1161/01.RES.0000153670.07559.E4. [DOI] [PubMed] [Google Scholar]
- Yegutkin GG, Samburski SS, Mortensen SP, Jalkanen S, Gonzalez-Alonso J. Intravascular ADP and soluble nucleotidases contribute to acute prothrombotic state during vigorous exercise in humans. J Physiol. 2007;579:553–564. doi: 10.1113/jphysiol.2006.119453. [DOI] [PMC free article] [PubMed] [Google Scholar]