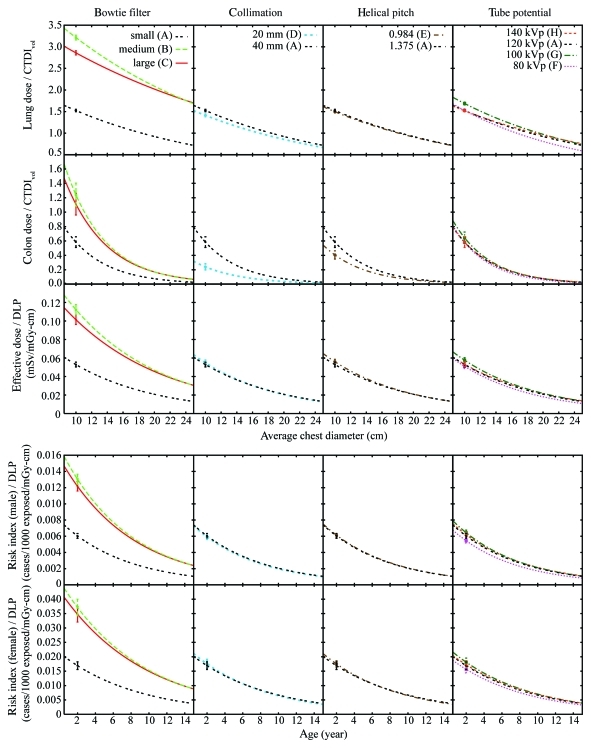
At pediatric chest CT, radiation dose and cancer risk, when normalized by tube current–time product, volume-weighted CT dose index, or dose–length product (DLP), decreased exponentially with increasing patient chest diameter; when normalized by DLP, effective dose and cancer risk were independent of beam collimation, helical pitch, and tube potential.
Abstract
Purpose:
To estimate patient-specific radiation dose and cancer risk for pediatric chest computed tomography (CT) and to evaluate factors affecting dose and risk, including patient size, patient age, and scanning parameters.
Materials and Methods:
The institutional review board approved this study and waived informed consent. This study was HIPAA compliant. The study included 30 patients (0–16 years old), for whom full-body computer models were recently created from clinical CT data. A validated Monte Carlo program was used to estimate organ dose from eight chest protocols, representing clinically relevant combinations of bow tie filter, collimation, pitch, and tube potential. Organ dose was used to calculate effective dose and risk index (an index of total cancer incidence risk). The dose and risk estimates before and after normalization by volume-weighted CT dose index (CTDIvol) or dose–length product (DLP) were correlated with patient size and age. The effect of each scanning parameter was studied.
Results:
Organ dose normalized by tube current–time product or CTDIvol decreased exponentially with increasing average chest diameter. Effective dose normalized by tube current–time product or DLP decreased exponentially with increasing chest diameter. Chest diameter was a stronger predictor of dose than weight and total scan length. Risk index normalized by tube current–time product or DLP decreased exponentially with both chest diameter and age. When normalized by DLP, effective dose and risk index were independent of collimation, pitch, and tube potential (<10% variation).
Conclusion:
The correlations of dose and risk with patient size and age can be used to estimate patient-specific dose and risk. They can further guide the design and optimization of pediatric chest CT protocols.
© RSNA, 2011
Supplemental material: http://radiology.rsna.org/lookup/suppl/doi:10.1148/radiol.11101900/-/DC1
Introduction
With the expanding use of computed tomography (CT) in children (1,2) and the increasing attention to the potential risk from CT radiation to this population (3,4), there have been growing interests to better manage pediatric patient dose at CT examinations (5). The most important of these interests are the tenants of radiation protection: (a) eliminate unnecessary or redundant CT examinations and (b) optimize CT scanning parameters to minimize patient dose. The first goal can be facilitated by using a dose-reporting system that provides estimates of radiation dose and potential cancer risk specific to each patient and each CT examination. Knowledge of dose and risk to each patient can inform the health care providers of prior radiation exposure history and alert them to carefully consider the necessity and frequency of CT examinations. Moreover, this information will offer the opportunity for an informed discussion about individual dose, cumulative dose, and risk, as public interest in and awareness of radiation from medical imaging increases. The second goal can benefit from an understanding of the quantitative relationship between patient dose and risk and various factors affecting dose and risk, notably patient size, patient age, and CT scanning parameters.
Because of the limited designs of pediatric anthropomorphic phantoms, either physical (6) or computational (7,8) in nature, efforts to report CT dose and to estimate radiation risk have mainly relied on CT dose index (CTDI) and dose–length product (DLP) determined in standard-sized cylindric phantoms and their conversion coefficients to effective dose derived for patients of standard ages (9–12). As such, dose and risk information specific to individual patients is not available. Similarly, studies that examined the dependence of dose on patient size and scanning parameters have mainly been carried out in cylindric or oval-shaped phantoms (13–16). Therefore, our knowledge of how actual patient dose depends on body size and scanning parameters is still less than desirable.
The purpose of our study was to estimate patient-specific radiation dose and cancer risk for pediatric chest CT and to evaluate factors affecting dose and risk, including patient size, patient age, and scanning parameters.
Materials and Methods
Our institutional review board approved this study and determined that the study was in compliance with the Health Insurance Portability and Accountability Act. Informed consent was not required.
This study was partially funded by GE Healthcare and the National Institutes of Health. The authors who are not employees of GE Healthcare had complete control over the data and information submitted in this article.
Patients
The study included 30 pediatric patients (mean age, 5 years ± 4 [standard deviation]; age range, 0–16 years; mean weight, 18 kg ± 10; weight range, 2–41 kg). There were 16 male patients (mean age, 2 years ± 4; age range, 0–12 years; mean weight, 20 kg ± 10; weight range, 3–33 kg) and 14 female patients (mean age, 5 years ± 4; age range, 0–16 years; mean weight, 18 kg ± 11; weight range, 2–41 kg). The patients underwent clinical chest or chest-abdominal-pelvic CT examinations at our institution. All examinations were performed with a clinical CT scanner (LightSpeed VCT or LightSpeed 16; GE Healthcare, Waukesha, Wis). The indications for body CT consisted of trauma or postoperative evaluation (15%), infectious or inflammatory concerns (30%), diagnosis or follow-up for malignancy (30%), and other conditions including suspicion for vascular abnormality, congenital lesions, systemic disease, immune deficiency, metabolic or syndromic disorders, pre- and posttransplant evaluation, and nonspecific symptoms (25%). Irrespective of the known or potential underlying disorder, all examinations were reviewed by a pediatric radiologist (D.P.F., with 20 years of experience) to ensure that the images were normal or contained findings (eg, central venous catheter placement, small pleural fluid collection, or kidney stone) that would not affect organ size, position, morphology, and other factors.
Patient-specific Computer Models
A nonuniform rational B-spline–based full-body computer model was created for each patient on the basis of the patient’s clinical CT data (17). Large organs and structures inside the image volume (backbone, rib cage, lungs, heart, liver, gallbladder, stomach, spleen, and kidneys) were individually segmented and modeled; other organs were created by transforming an existing adult male or female full-body computer model (developed from visible human data) (18) to match the framework defined by the segmented organs by referencing the organ volume and anthropometric data in publication 89 of the International Commission on Radiological Protection (ICRP) (19).
The full-body model of each patient consisted of a total of 43 and 44 organs for male and female patients, respectively, and included most of the radiosensitive organs defined by ICRP publication 103 (20). Because clinical CT data of the chest were available for all 30 patients in this study, the chest section of each computer model closely matched the patient anatomy, which allowed reliable estimation of dose and risk for examinations of the chest. The nonuniform rational B-spline model of each patient was voxelized at 0.5- or 1-mm isotropic resolution for input into Monte Carlo simulations (21,22).
CT Scanner and Protocols
A 64-section CT system (LightSpeed VCT, GE Healthcare) was studied. Radiation dose and cancer risk associated with eight scanning protocols enabled by the system (Table 1) were estimated to assess the effects of patient size, patient age, and scanning parameters. The first four protocols were selected from the set of size-based pediatric chest protocols in use at our institution. Other protocols were included to allow the effect of one scanning parameter to be evaluated independent of others. Specifically, protocols A, B, and C were used to examine the effect of bow tie filter choice, protocols A and D to examine beam collimation, protocols A and E to examine helical pitch, and protocols A, F, G, and H to examine tube potential. While other beam collimation and helical pitch settings were also available with the CT system, the values in Table 1 reflect the most frequently used settings for routine examinations of pediatric chest.
Table 1.
CT Protocols

Protocols A, B, and C were used to examine the effect of bow tie filter choice, protocols A and D to examine beam collimation, protocols A and E to examine helical pitch, and protocols A, F, G, and H to examine tube potential.
CTDIvol = volume-weighted CT dose index. The scan field of view used in each CT protocol determines the corresponding CTDI phantom size: 32-cm-diameter phantom for protocols B and C and 16-cm-diameter phantom for other protocols.
See Equation (1).
Radiation Dose and Cancer Risk Estimations
For each patient, organ dose from each scanning protocol was estimated by using a previously developed Monte Carlo program (21,22). The program explicitly modeled the geometry of the CT system, the three-dimensional geometry of the bow tie filters, and the trajectories of x-ray tube motion during axial and helical scans. The accuracy of the simulated dose was previously validated in a cylindric phantom and two anthropomorphic phantoms for both axial and helical scanning modes. Simulations were found to agree with measurements within 1%–11% on average and 5%–17% maximum (21).
For each patient, the total scan length was determined as the total image coverage plus the overranging distance (additional scan length necessary for data interpolation in helical reconstruction) (23). The total image coverage was representative of a clinical chest scan, extending from 1 cm above the lung apex to 1 cm below the lung base. The overranging distance was dependent on beam collimation and helical pitch and was estimated from the scanner console parameters as
where TS is table speed in centimeters per second, STtotal is total scan time in seconds, and Ci is image coverage in centimeters. The start location of the chest scan was, therefore, 1 cm plus half of the overranging distance above the lung apex, and the end location was the same distance below the lung base.
The organ dose values estimated for each patient were used to calculate effective dose by using the tissue-weighting factors, or wT, defined in ICRP publication 103 (20). Dose to radiosensitive organs that were not explicitly modeled was approximated by using dose to neighboring organs (22). In principle, effective dose calculation should use sex-averaged organ dose values. Because the computer model of each patient had the reproductive organs (testes, prostate, ovaries, uterus, cervix) of only one sex, dose to the testes or the ovaries was used to approximate sex-averaged dose to the gonads, and dose to the “reminder tissues” of one sex was used to approximate sex-averaged dose to the reminder tissues. These approximations are reasonable, considering that the reproductive organs are outside of the chest scan coverage. Breast dose was included in the calculation of effective dose for all patients. The effective dose value calculated in this way represented the effective dose to a patient population (including both sexes) that has similar anatomy and body habitus as the patient whose organ dose values were used in the effective dose calculation. This approach most reasonably implemented the ICRP definition of effective dose.
While widely used as a surrogate for population radiation risk, effective dose does not reflect individual patient risk; the tissue-weighting factors are mean values representing averages across both sex and age (20). Therefore, to more accurately estimate individual patient risks, we further implemented a metric of risk, termed risk index, defined as
where HT is the equivalent dose for organ or tissue T and rT is the sex-, age-, and tissue-specific risk coefficient (cases per 100 000 exposed to 0.1 Gy) for lifetime attributable risk of cancer incidence. The metric of risk index presented here was adopted from the recently proposed concept of effective risk (24). We propose to use the term risk index, as opposed to effective risk, to reflect the inherent uncertainties associated with any risk estimation, particularly risks for individual patients, who might have different radiosensitivity due to genetic predispositions or hormonal profiles.
Values of risk coefficient, or rT, are tabulated in the Biological Effects of Ionizing Radiation VII report (25) for leukemia and for cancers of eight to nine high-risk organs of each sex at discrete ages of 0, 5, 10, 15, 20, 30, 40, 50, 60, 70, and 80 years (25). Values of risk coefficient at intermediate ages were determined by using linear interpolation. Cancers of other radiosensitive organs share a collective risk coefficient (rother) (25). This risk coefficient was applied to a weighted average dose of other radiosensitive organs, defined as
 |
Those organs included the heart, kidney, gallbladder, spleen, pancreas, adrenal glands, thymus, small intestine, salivary glands, extrathoracic region, lymph node, muscle, oral mucosa, bone surface, brain, skin, testes (male only), and esophagus, among which the reminder organs, as defined by ICRP publication 103 (20), were each assigned a tissue-weighting factor of 0.01.
Normalization by CTDIvol or DLP
It has been shown that when organ dose is normalized by CTDIvol, the results vary little (<8.5%) across CT scanners (26). Similarly, when effective dose is normalized by DLP, the dependence on scanner model is small (<10%) (9,27). Furthermore, when normalized by DLP, the effective dose from fixed-tube-current and modulated-tube-current chest examinations was found to agree to within 10% (28). These facts allowed us to generalize our study results to other CT scanner models and to both fixed- and modulated-tube-current conditions. In doing so, the organ dose from each CT protocol was normalized by CTDIvol, and the effective dose and risk index were normalized by DLP. The CTDIvol was calculated from the technical reference manual of the LightSpeed VCT scanner by using the tables of CTDI100 and technique adjustment factors. The scan field of view used in each CT protocol (Table 1) determined the corresponding CTDI phantom size: All protocols corresponded to the 16-cm-diameter phantom with the exception of protocols B and C, which corresponded to the 32-cm-diameter phantoms. When calculating DLP, the total scan length included the overranging distance (Eq [1]). The CTDIvol and DLP values calculated in this way agreed with those from patients’ dosimetry reports to within about 5%.
Data Analysis
To examine the effect of patient size alone on dose, the organ and effective dose from each scanning protocol was normalized by tube current–time product per gantry rotation and was correlated with the body size of the patient model by using the sample Pearson correlation coefficient (29). Seven indexes of body size were initially considered (Table 2). Because all indexes correlated well with average chest diameter except weight and total scan length (a surrogate for chest height), average chest diameter, total scan length, and weight were chosen as the final body size indexes to correlate with organ and effective dose. For the body size index that most strongly correlated with dose estimates, nonlinear regression analysis was performed to obtain organ and effective dose (normalized by tube current–time product) as functions of that body size index. Similar regression analysis was performed for DLP-normalized effective dose.
Table 2.
Body Size Indexes and Their Correlations with Average Chest Diameter
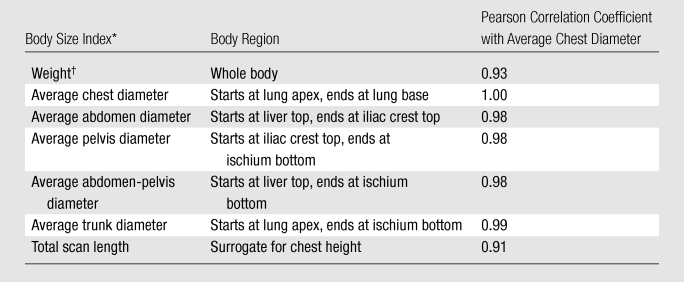
The average diameter of a body region (chest, abdomen, pelvis, abdomen-pelvis, and trunk) was calculated as d = 2√(A/π) = 2√(V/(π · H), where A is average cross-sectional area of the region, V is region volume, and H is region height.
Total body weight of the voxelized computer model.
Unlike organ and effective dose, which are functions of only patient size, risk index is a function of both patient size and age (Eq [2]). Because patient size and age are loosely correlated (30), it is desirable to obtain risk index as a function of both body size and age. Given the small number of patients in this study, instead of limiting each patient to his or her actual age, we assigned 23 ages between 0 and 18 years to each patient to generate risk index data. Nonlinear regression analysis was then performed for each CT protocol and each sex to obtain risk index (normalized by tube current–time product) as a function of both age and the body size index that most strongly correlated with dose estimates. Similar regression analysis was performed for DLP-normalized risk index.
Results
Correlation of Patient Size with Organ and Effective Dose
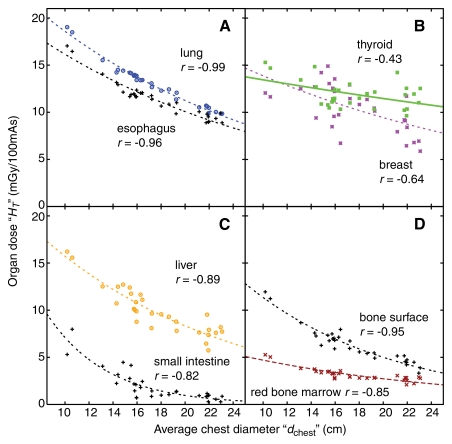
For all eight chest scanning protocols, dose to individual organs (in milligrays per 100 mAs) decreased exponentially with increasing average chest diameter (dchest) (Fig 1, Tables E1–E8 [online]) as
Figure 1:
Graphs show dose to individual organs, resultant from protocol A, as a function of average chest diameter (dchest) for, A, large organs and centrally located tubular organs inside the chest scan coverage, B, small organs inside the chest scan coverage, C, organs on the periphery or outside the chest scan coverage, and, D, distributed organs. Plot points = dose to the organs (HT) of individual patients. Lines = exponential fits HT(dchest) = exp(αTdchest +βT) to the data. r = Pearson sample correlation coefficient between the natural logarithm of organ dose and average chest diameter.
The correlation between organ dose and average chest diameter was strong for large organs and centrally located tubular organs inside the scan coverage (Fig 1, A) but was generally weaker for small organs inside the scan coverage (Fig 1, B), for organs on the periphery or outside of the scan coverage (Fig 1, C), and for distributed organs (Fig 1, D). The same held true after organ dose was normalized by CTDIvol, because CTDIvol was a constant for a given CT protocol for all patients.
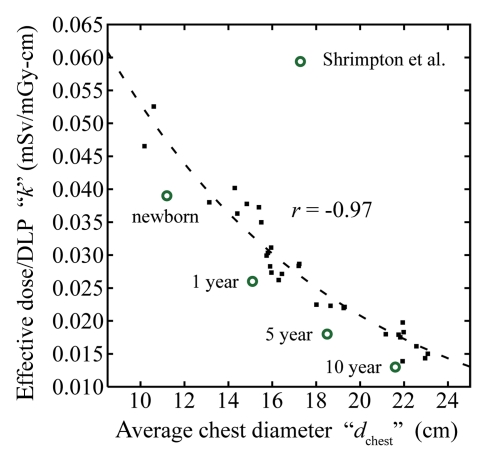
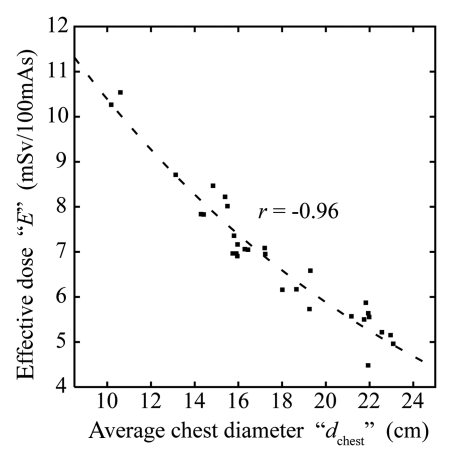
For all eight chest scanning protocols, effective dose (E) before and after normalization by DLP (in millisieverts per 100 mAs and millisieverts per milligray-centimeters, respectively) correlated strongly and decreased exponentially with average chest diameter (Fig 2, Table 3) as
and
Figure 2b:
(a) Graph shows effective dose (E), resultant from protocol A, as a function of average chest diameter (dchest). Plot points = effective dose values calculated from the organ dose of individual patients. r = Pearson sample correlation coefficient between the natural logarithm of E and dchest. Line = exponential fit E(dchest) = exp(αEdchest +βE) to the data. (b) Graph shows effective dose normalized by DLP (k), resultant from protocol A, as a function of average chest diameter. ■ = k values calculated from the organ dose and the total scan length of individual patients. r = Pearson sample correlation coefficient between the natural logarithm of k and dchest. Line = exponential fit k(dchest) = exp(αkdchest +βk) to the data. ○ = frequently used k conversion coefficients reported by Shrimpton et al for chest examinations of pediatric patients at 0 (newborn), 1, 5, and 10 years (9); these k conversion coefficients were estimated for single-section CT scanners by using a Monte Carlo method and mathematical models of reference pediatric patients developed by Cristy and Eckerman (7). The average chest diameters of these phantoms were estimated from their geometric definitions.
where k denotes effective dose normalized by DLP. The k values were higher by 22%–38% than the most frequently used conversion coefficients from DLP to effective dose reported by Shrimpton et al (9,31) for pediatric chest CT examinations (Fig 2).
Figure 2a:
(a) Graph shows effective dose (E), resultant from protocol A, as a function of average chest diameter (dchest). Plot points = effective dose values calculated from the organ dose of individual patients. r = Pearson sample correlation coefficient between the natural logarithm of E and dchest. Line = exponential fit E(dchest) = exp(αEdchest +βE) to the data. (b) Graph shows effective dose normalized by DLP (k), resultant from protocol A, as a function of average chest diameter. ■ = k values calculated from the organ dose and the total scan length of individual patients. r = Pearson sample correlation coefficient between the natural logarithm of k and dchest. Line = exponential fit k(dchest) = exp(αkdchest +βk) to the data. ○ = frequently used k conversion coefficients reported by Shrimpton et al for chest examinations of pediatric patients at 0 (newborn), 1, 5, and 10 years (9); these k conversion coefficients were estimated for single-section CT scanners by using a Monte Carlo method and mathematical models of reference pediatric patients developed by Cristy and Eckerman (7). The average chest diameters of these phantoms were estimated from their geometric definitions.
Table 3.
Exponential Relationship between Effective Dose and Average Chest Diameter before and after Normalization by DLP
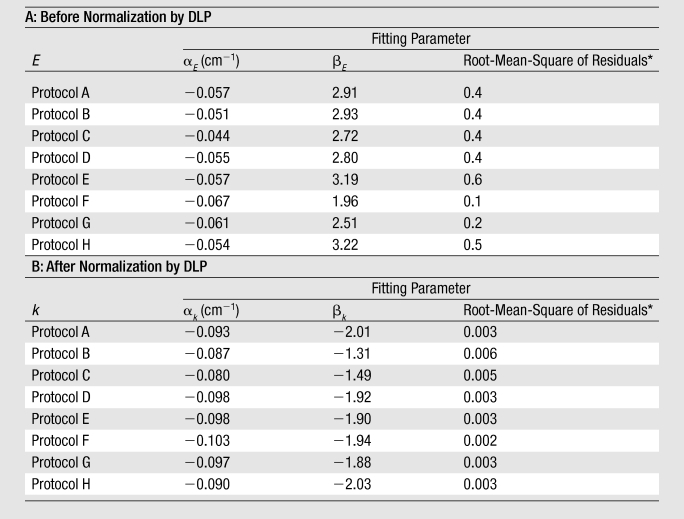
Note.—Equations for effective dose before and after normalization by DLP are E(dchest) = exp(aEdchest + bE) and k(dchest) = exp(akdchest + bk), respectively. Units for E and k are millisieverts per 100 mAs and millisieverts per milligray-centimeters, respectively.
Root-mean-square of residuals represents the average discrepancy between the effective dose predicted by using the fitting function and the effective dose calculated from the organ dose values of individual patients. It has the same unit as E or k.
The correlations of organ and effective dose with total scan length (a surrogate for chest height) and weight were generally weaker than the correlations with average chest diameter (Fig E1 [online]). For organ dose, the correlation coefficients with average chest diameter, total scan length, and weight were −0.81, −0.72, and −0.78, respectively, when averaged across organs and protocols. For effective dose, the respective correlation coefficients averaged across protocols were −0.95, −0.86, and −0.89 before normalization by DLP and −0.97, −0.95, and −0.94 after normalization by DLP. As such, curve fitting was not performed for total scan length and weight.
Correlation of Patient Size and Age with Risk Index
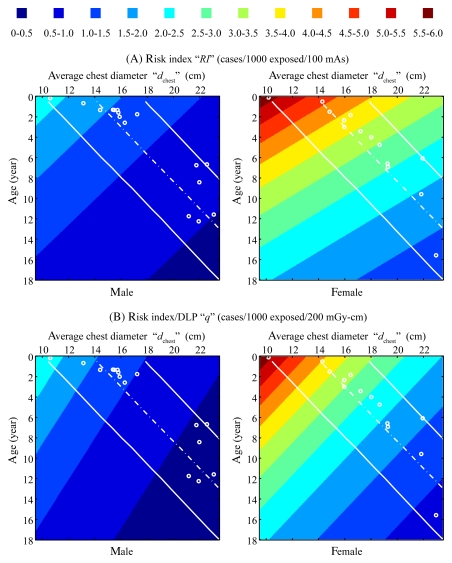
For all eight chest scanning protocols, the risk index (RI) for a given sex before and after normalization by DLP (in cases per 1000 exposed patients per 100 mAs and cases per 1000 exposed patients per milligray-centimeters, respectively) decreased exponentially with both patient age and average chest diameter, following the functional form of
and
 |
where q denotes risk index normalized by DLP. The root-mean-square residuals associated with fitting the risk index data of any CT protocol to Equations (6a) and (6b) were less than 0.3 cases per 1000 exposed patients per 100 mAs and less than 0.003 cases per 1000 exposed patients per milligray-centimeters for risk index and q, respectively (Table 4). An example plot of risk index is illustrated in Figure 3.
Table 4.
Risk Index as a Function of Average Chest Diameter and Age before and after Normalization by DLP
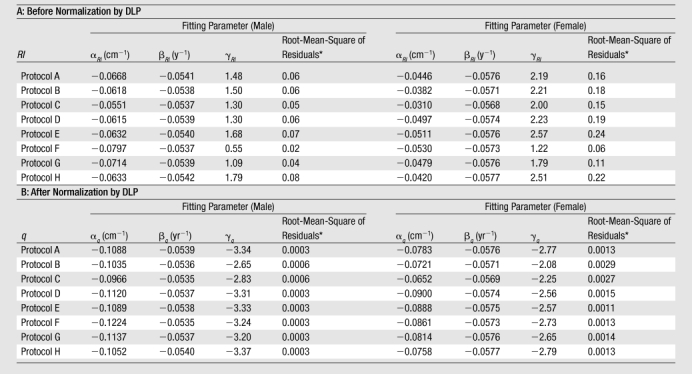
Note.—Equations for risk index before and after normalization are RI(dchest, age) = exp(aRIdchest + bRI age + gRI) and q(dchest, age) = exp(aqdchest + bq age + gq), respectively. Units for RI and q are cases per 1000 exposed patients per 100 mAs and cases per 1000 exposed patients per milligray-centimeters, respectively.
Root-mean-square of the residuals represents the average discrepancy between the risk index values predicted by using the fitting function and the risk index values calculated for individual patients. It has the same unit as RI or q.
Figure 3:
Top: Risk index (RI), associated with protocol A, as a function of patient age and average chest diameter (dchest). Plotted risk index values were generated by using RI(dchest,age) = exp(αRIdchest +βRIage+γRI) with fitting parameters aRI, βRI, γRIfor protocol A (Table 4). Bottom: Risk index normalized by DLP (q), associated with protocol A, as a function of patient age and average chest diameter. Plotted q values were generated using q(dchest,age) = exp(αqdchest +βqage+γq) with fitting parameters aq, βq, γq for protocol A (Table 4). The unit of cases per 1000 cases per 200 mGy · cm was chosen such that the values in the top and bottom plots have a similar range. Dotted lines = mean chest diameter (and its 95% prediction interval [solid lines]) at each age calculated by using published thorax size data for pediatric CT patients (30). ○ = ages and average chest diameters of the 30 patients in this study.
Effects of Scanning Parameters
The exponential relationships described by Equations (4)–(6) allowed the effects of bow tie filter, collimation, helical pitch, and tube potential to be studied for any dose or risk estimate. Lung dose, large intestine dose, effective dose, and risk index before normalization (Fig E2 [online]) and after normalization (Fig 4) are illustrated as examples. To allow the effects of scanning parameters to be demonstrated, risk index is plotted as a function of patient age only; the risk index at each age was calculated by using the mean chest diameter at that age estimated as
where APthick (age) and Tthick (age) are the mean anteroposterior and transverse thorax thicknesses, respectively, published for pediatric CT patients by Kleinman et al (30).
Figure 4:
Graphs show effects of scanning parameters (bow tie filter, collimation, helical pitch, and peak tube potential) on radiation dose and cancer risk normalized by CTDIvol or DLP by using lung dose, large intestine dose, and effective dose (top) and risk index (bottom) as examples. Error bar on each curve = root-mean-square of the residuals associated with the exponential fit. A–H = protocols A–H.
Before normalization by CTDIvol or DLP (Fig E2 [online]), the effects of bow tie filter and collimation were generally small compared with the effects of helical pitch and tube potential, with an exception being dose to the large intestine, an organ on the periphery or outside the chest scan coverage, for which the effect of collimation was greater than that of the helical pitch, likely because of the longer overranging distances associated with wider beam collimation and higher helical pitch (Table 1) (23). In Table 5, the effect of a given scanning parameter was quantified by using the coefficient of variation ([standard deviation × 100%]/mean) in dose and risk across protocols that differ only in terms of that scanning parameter.
Table 5.
Effects of Scanning Parameters on Dose and Risk, Quantified by Using Coefficient of Variation across Protocols
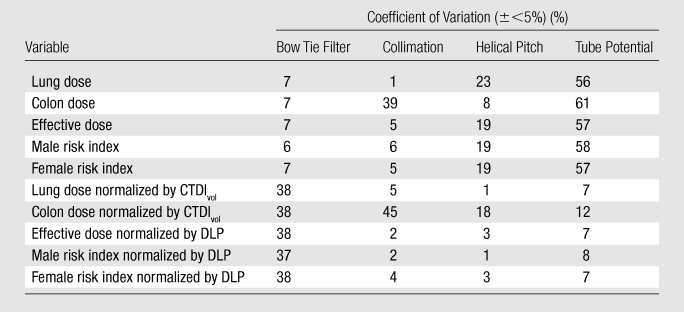
Note.—Coefficient of variation = (standard deviation × 100%)/mean. The coefficients of variation represent averages across patients. They had standard deviations across patients of less than 5%, except for the effect of collimation on colon dose, where the average coefficient of variation had a standard deviation of 15% both before and after the colon dose was normalized by CTDIvol. As an example, to quantify the effect of bow tie filter on the lung dose of a given patient, coefficient of variation was calculated by using the lung dose values of that patient from protocols A, B, and C, which differed only in terms of bow tie filter choice.
Figure 4 illustrates the effects of scanning parameters on dose and risk after normalization by CTDIvol or DLP. Except for colon dose, the effects of helical pitch and tube potential reduced to within 10%. The effect of bow tie filter, however, became more pronounced (approximately 40%) because of the substantially lower CTDIvol values associated with protocols B and C compared with protocol A (Table 1).
Discussion
In this study, we reported patient-specific radiation dose and cancer risk from pediatric chest CT examinations. Patient-specific estimations were made possible by combining a validated Monte Carlo program with a library of patient-specific computer models developed from clinical CT images.
Our study showed that, with pediatric chest CT, organ dose (normalized by tube current–time product) decreased exponentially with increasing average chest diameter. This is consistent with the exponential relationship between mean section dose and water phantom radius reported by Huda et al (16) and the exponential relationship between CTDI and acrylic phantom diameter reported by Nickoloff et al (14). Our work represents a demonstration of such exponential dependences by using a population of patient models with clinical nonphantom anatomy.
Our study further showed that, with pediatric chest CT, effective dose before and after normalization by DLP correlated strongly and decreased exponentially with average chest diameter. Most important, the DLP-normalized effective dose results can be further applied to other CT systems and to tube-current-modulation techniques with reasonable accuracy (9,26,28). In addition, our independent evaluation of the effect of overranging distance for one patient in this study showed that DLP-normalized effective dose varied little (<4%) across a range of overranging distances (0–6.4 cm). Thus, the normalized results also apply to CT systems equipped with adaptive collimators that minimize overranging exposure (32).
DLP-normalized effective dose results (or k conversion coefficients, as commonly referred to in the literature) have been reported in the literature for limited pediatric ages (newborn and 1, 5, and 10 years) (9,31). Considering that dose is a direct function of patient size and patient size can vary at a given age, it is more desirable to report the conversion coefficient as a function of patient size (ie, average chest diameter in this study). When the average chest diameter is matched, the k conversion coefficients reported in our study were higher by 22%–38% than the most frequently used values reported by Shrimpton et al (9,31) for pediatric chest CT examinations. A similar discrepancy (37%) was reported by Christner et al (33) for adult chest examinations. The discrepancies can be attributed to several factors. One is the change in tissue-weighting factors from ICRP publication 60 to ICRP publication 103; the magnitude of this discrepancy was 14% for adult chest examination (33) and approximately 16% for the pediatric patients in our study (based on an independent recalculation of effective dose by using the tissue-weighting factor values of ICRP publication 60). Another source of discrepancy was the different definitions of patient anatomy. The k conversion coefficients of Shrimpton et al were derived from mathematical or stylized models of reference pediatric patients with organs defined by simple geometric shapes, whereas the k conversion coefficients in this study were derived from patient-specific models based on tomographic images. Lee et al (34) have shown that stylized and tomographic models could have effective dose differences of up to 17.4% for pediatric chest examinations. Last, the k conversion coefficients of Shrimpton et al represent averages across three single-section CT scanner models from different vendors, whereas the k conversion coefficients in this study were obtained from one multisection CT scanner model.
At our institution, pediatric patients are assigned to different protocol groups on the basis of weight, body length, or age. However, the results of this study show that chest diameter or circumference is a stronger predictor of dose and risk than weight and body length and should perhaps replace the other body size indexes for the purpose of protocol design and assignment. This is in line with the recommendation of Haaga et al (35) and Haaga (36), who advocated the use of patient diameter to determine parameters such as tube current.
To our knowledge, this work represents a systematic study of the relationship between CT cancer risk and the body size and age of patients. The exponential dependence of risk index on average chest diameter and patient age can be used to estimate cancer risk for any pediatric patient in the investigated size range who undergoes chest examination. Compared with patient-generic dose and risk estimation, patient-specific dose and risk estimation is more accurate and conducive to individualized dose tracking and monitoring (37,38). Information about a given patient’s accumulative dose and risk can alert the health care providers to carefully consider the necessity of CT examination and the frequency of sequential CT examinations. Knowledge of the risk may also be helpful for institutional review of scientific studies by using CT examinations.
Beyond the effects of patient size and age, it is important to understand the effects of scanning parameters on dose and risk. We showed that, when lung dose is normalized by CTDIvol, the effects of beam collimation, helical pitch, and tube potential are small (<7%). This likely holds true for other centrally located organs in the scan coverage. Other authors have shown, for whole-body scan, that CTDIvol-normalized organ dose varies little (<8.5%) across CT scanner models (26). Therefore, for centrally located organs in the scan coverage, CTDIvol-normalized organ dose is independent of scanning parameters and scanner models (assuming the same CTDI phantom is used).
We further showed that, when effective dose and risk index are normalized by DLP, the effects of beam collimation, helical pitch, and tube potential are also small (<10%). As mentioned earlier, DLP-normalized effective dose (or k conversion coefficient) is universal among different CT systems (9,27). For examinations of an entire body region (eg, chest), the effect of tube current modulation was also small (<10%) (28). Therefore, the DLP-normalized effective dose for protocol A can be considered universal for all pediatric chest CT examinations (that correspond to the small CTDI phantom), independent of CT system and scanning parameter, as well as whether tube current modulation is used. While the effect of tube current modulation on risk index has not been specifically investigated, because risk index is also a weighted summation of many organ dose values based on radiosensitivity, it is reasonable to assume that the DLP-normalized risk index (or q conversion coefficient) for protocol A also applies to other pediatric chest CT examinations (that correspond to the small CTDI phantom).
To demonstrate how the data reported in our study can be used to estimate patient-specific dose and risk, consider a hypothetical female patient, aged 2 years 4 months, who has an average chest diameter of 16.0 cm, determined from the circumference measurement made at the middle of the chest either directly from the patient before the chest CT examination or indirectly from the patient’s chest CT images after the examination. The CTDIvol and DLP associated with the patient’s chest examination are 3.41 mGy and 62.12 mGy ⋅ cm, respectively, which are based on a 16-cm-diameter CTDI phantom. The CTDIvol and DLP are known either from the dose information displayed on the scanner console before the examination or from the dosimetry report saved together with the patient’s chest CT images after the examination. Because the CTDIvol-normalized lung dose and the DLP-normalized effective dose and risk index are independent of scanning parameters (keeping CTDI phantom size the same), we can use the fitting parameters for protocol A (Table E1> [online]; Tables 3, 4) to estimate dose and risk. Specifically, the lung dose is estimated by using the fitting parameters in Table E1 (online) as
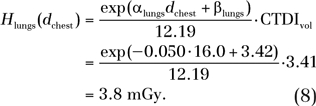 |
By using the fitting parameters in Table 3, the effective dose is estimated as
 |
Because the concept of effective dose does not apply to individual patients, this effective dose value should be interpreted more appropriately as the effective dose to a patient population (including both sexes) that has similar anatomy and body habitus as our hypothetical patient.
By using the fitting parameters in Table 4, the risk index is estimated as
 |
Note that if the CTDIvol and DLP associated with a patient’s chest examination are determined on the basis of a 32-cm-diameter CTDI phantom, then the fitting parameters for protocol B or C (Tables E2, E3 [online]; Tables 3, 4) should be used instead.
One limitation of our study was that only 30 pediatric patients were included. Furthermore, the patients were not evenly distributed across ages and weight or size percentiles. Extrapolation is needed to assess dose and risk to patients with an average chest diameter lower than 10 cm or higher than 23 cm. We plan a future study that will sample the entire range of pediatric ages and multiple weight or size percentiles at each age. Another limitation of our study was that we did not explicitly study the effect of tube current modulation on dose and risk for pediatric patients but assumed that the finding for adults (ie, the finding that tube current modulation has a small effect on DLP-normalized effective dose for a chest examination) (28) applied equally well to pediatric patients. Third, the CTDIvol- and DLP-normalized results reported in this study were limited to CT scanner models with less than 64 rows of detectors (or less than 40-mm beam collimation). A study by Boone (39) has shown that, beyond a beam collimation of approximately 40 mm, CTDI100 is no longer effective as a dose index; errors will likely occur when applying the CTDIvol- and DLP-normalized results derived in our study to wider beam collimations. Future studies are needed to include CT scanner models with wide area detectors and to explore an alternative and more effective dose index, in place of CTDI100. Last, the accuracy of our risk estimations was limited by the accuracy of the current cancer risk models (25), which are largely based on the life span studies of atomic bomb survivors and limited number of studies on occupational exposures. Uncertainties are further introduced when applying the risk coefficients to individual patients, who may have varying radiosensitivity due to generic predispositions and hormonal profiles. As such, the risk index reported in our study does not represent the true risk of an individual from his or her CT examination but rather our current best knowledge of the potential risk to a patient from his or her CT examination, knowing the patient’s age and sex. Nevertheless, the risk index can serve the purpose of radiation protection by providing reference risk levels for common CT examinations and by guiding the design of CT protocols to practice the as low as reasonably achievable principle.
In summary, in pediatric chest CT, radiation dose and cancer risk, when normalized by tube current–time product, CTDIvol, or DLP, decreased exponentially with increasing patient chest diameter. Cancer risk further decreased exponentially with increasing patient age. When normalized by DLP, effective dose and cancer risk were independent of beam collimation, helical pitch, and tube potential. The reported correlation relationships can be used to estimate patient-specific dose and risk in clinical practice for any pediatric patient in the investigated size range who undergoes chest examination. Such information, if documented in a patient’s medical record as part of radiation dose archive and tracking, may aid in decisions for image utilization and provide guidance to the design and optimization of pediatric CT protocols.
Advances in Knowledge.
At pediatric chest CT, average chest diameter is a stronger predictor of organ dose and effective dose than weight and total scan length.
For organ dose, the correlation coefficients with average chest diameter, total scan length, and weight were −0.81, −0.72, and −0.78, respectively, when averaged across organs and protocols; for effective dose, the respective correlation coefficients averaged across protocols were −0.95, −0.86, and −0.89.
Organ dose, when normalized by tube current–time product or volume-weighted CT dose index, decreases exponentially with increasing chest diameter; effective dose, when normalized by tube current–time product or dose–length product (DLP), decreases exponentially with increasing chest diameter.
Risk index (an index of total risk for cancer incidence), when normalized by tube current–time product or DLP, decreases exponentially with both chest diameter and patient age.
When normalized by DLP, effective dose and risk index are independent of scanning parameters, including beam collimation, helical pitch, and tube potential; the variations across each scanning parameter are less than 10%.
Implications for Patient Care.
The correlations of dose and risk with patient size and age can be used to estimate patient-specific dose and risk for pediatric chest CT patients.
The quantitative relationships of dose and risk with patient size, patient age, and scanning parameters provide guidance to the design and optimization of pediatric chest CT protocols.
Patient-specific dose and risk estimation enables individualized application of dose tracking for medical radiation exposures.
Disclosures of Potential Conflicts of Interest: X.L. Financial activities related to the present article: receives grant and travel support from GE Healthcare. Financial activities not related to the present article: none to disclose. Other relationships: none to disclose. E.S. Financial activities related to the present article: receives grant and travel support from GE Healthcare. Financial activities not related to the present article: is a board member of IBA, consults for and receives grants from GE and Siemens. Other relationships: none to disclose. W.P.S. No potential conflicts of interest to disclose. G.M.S. Financial activities related to the present article: none to disclose. Financial activities not related to the present article: employed at Duke University, Department of Radiology. Other relationships: none to disclose. J.G.C. Financial activities related to the present article: receives salary from GE Healthcare. Financial activities not related to the present article: was employed full time by GE Healthcare, retired in April 2009. Part-time employee of GE Healthcare since June 2010. Other relationships: none to disclose. D.P.F. Financial activities related to the present article: receives grant from GE Healthcare and is coinvestigator. Financial activities not related to the present article: receives grant from Siemens and is coinvestigator. Other relationships: none to disclose.
Received September 21, 2010; revision requested November 22; revision received December 29; accepted January 18, 2011; final version accepted February 3.
Funding: This work was supported by a National Institutes of Health grant (RO1 EB001838).
Supported in part by a grant from GE Healthcare.
Abbreviations:
- CTDI
- CT dose index
- CTDIvol
- volume-weighted CTDI
- DLP
- dose–length product
- ICRP
- International Commission on Radiological Protection
References
- 1.Linton OW, Mettler FA., Jr National conference on dose reduction in CT, with an emphasis on pediatric patients. AJR Am J Roentgenol 2003;181(2):321–329 [DOI] [PubMed] [Google Scholar]
- 2.Arch ME, Frush DP. Pediatric body MDCT: a 5-year follow-up survey of scanning parameters used by pediatric radiologists. AJR Am J Roentgenol 2008;191(2):611–617 [DOI] [PubMed] [Google Scholar]
- 3.Brenner D, Elliston C, Hall E, Berdon W. Estimated risks of radiation-induced fatal cancer from pediatric CT. AJR Am J Roentgenol 2001;176(2):289–296 [DOI] [PubMed] [Google Scholar]
- 4.Brenner DJ, Hall EJ. Computed tomography: an increasing source of radiation exposure. N Engl J Med 2007;357(22):2277–2284 [DOI] [PubMed] [Google Scholar]
- 5.Goske MJ, Applegate KE, Boylan J, et al. The Image Gently campaign: working together to change practice. AJR Am J Roentgenol 2008;190(2):273–274 [DOI] [PubMed] [Google Scholar]
- 6.Cody DD, Moxley DM, Krugh KT, O’Daniel JC, Wagner LK, Eftekhari F. Strategies for formulating appropriate MDCT techniques when imaging the chest, abdomen, and pelvis in pediatric patients. AJR Am J Roentgenol 2004;182(4):849–859 [DOI] [PubMed] [Google Scholar]
- 7.Cristy M, Eckerman KF. Specific absorbed fractions of energy at various ages from internal photon sources. ORNL/TM-8381/Vol I-VII. Oak Ridge, Tenn: Oak Ridge National Laboratory, 1987 [Google Scholar]
- 8.Lee C, Lodwick D, Hurtado J, Pafundi D, Williams JL, Bolch WE. The UF family of reference hybrid phantoms for computational radiation dosimetry. Phys Med Biol 2010;55(2):339–363 [DOI] [PMC free article] [PubMed] [Google Scholar]
- 9.Shrimpton PC. Assessment of patient dose in CT. NRPB-PE/1/2004 NRPB. Chilton, England: National Radiological Protection Board, 2004 [Google Scholar]
- 10.Shrimpton PC, Hillier MC, Lewis MA, Dunn M. National survey of doses from CT in the UK: 2003. Br J Radiol 2006;79(948):968–980 [Published correction appears in Br J Radiol 2007;80(956):685.] [DOI] [PubMed] [Google Scholar]
- 11.Huda W, Ogden KM. Computing effective doses to pediatric patients undergoing body CT examinations. Pediatr Radiol 2008;38(4):415–423 [DOI] [PubMed] [Google Scholar]
- 12.Thomas KE, Wang B. Age-specific effective doses for pediatric MSCT examinations at a large children’s hospital using DLP conversion coefficients: a simple estimation method. Pediatr Radiol 2008;38(6):645–656 [DOI] [PubMed] [Google Scholar]
- 13.Boone JM, Geraghty EM, Seibert JA, Wootton-Gorges SL. Dose reduction in pediatric CT: a rational approach. Radiology 2003;228(2):352–360 [DOI] [PubMed] [Google Scholar]
- 14.Nickoloff EL, Dutta AK, Lu ZF. Influence of phantom diameter, kVp and scan mode upon computed tomography dose index. Med Phys 2003;30(3):395–402 [DOI] [PubMed] [Google Scholar]
- 15.Siegel MJ, Schmidt B, Bradley D, Suess C, Hildebolt C. Radiation dose and image quality in pediatric CT: effect of technical factors and phantom size and shape. Radiology 2004;233(2):515–522 [DOI] [PubMed] [Google Scholar]
- 16.Huda W, Atherton JV, Ware DE, Cumming WA. An approach for the estimation of effective radiation dose at CT in pediatric patients. Radiology 1997;203(2):417–422 [DOI] [PubMed] [Google Scholar]
- 17.Sturgeon GM, Li X, Mendonca S, Frush DP, Samei E, Segars WP. Series of anatomically detailed NURBS-based phantoms for pediatric CT research. Med Phys (in press). [Google Scholar]
- 18.Segars WP, Tsui BMW, Frey EC, Fishman EK. Extension of the 4D NCAT phantom to dynamic x-ray CT simulation. IEEE Nucl Sci Symp Conf Rec (2003) 2003;5:3195–3199 [Google Scholar]
- 19.International Commission on Radiological Protection Basic anatomical and physiological data for use in radiological protection: reference values. ICRP Publication 89. New York, NY: International Commission on Radiological Protection, 2002 [Google Scholar]
- 20.International Commission on Radiological Protection The 2007 recommendations of the International Commission on Radiological Protection. ICRP Publication 103. Essen, Germany: International Commission on Radiological Protection, 2007 [Google Scholar]
- 21.Li X, Samei E, Segars WP, et al. Patient-specific radiation dose and cancer risk estimation in CT. I. Development and validation of a Monte Carlo program. Med Phys 2011;38(1):397–407 [DOI] [PMC free article] [PubMed] [Google Scholar]
- 22.Li X, Samei E, Segars WP, et al. Patient-specific radiation dose and cancer risk estimation in CT. II. Application to patients. Med Phys 2011;38(1):408–419 [DOI] [PMC free article] [PubMed] [Google Scholar]
- 23.van der Molen AJ, Geleijns J. Overranging in multisection CT: quantification and relative contribution to dose—comparison of four 16-section CT scanners. Radiology 2007;242(1):208–216 [DOI] [PubMed] [Google Scholar]
- 24.Brenner DJ. Effective dose: a flawed concept that could and should be replaced. Br J Radiol 2008;81(967):521–523 [DOI] [PubMed] [Google Scholar]
- 25.Nuclear Regulatory Commission Health risks from exposure to low levels of ionizing radiation: BEIR VII. Washington, DC: National Academies Press, 2006 [PubMed] [Google Scholar]
- 26.Turner AC, Zankl M, DeMarco JJ, et al. The feasibility of a scanner-independent technique to estimate organ dose from MDCT scans: using CTDIvol to account for differences between scanners. Med Phys 2010;37(4):1816–1825 [DOI] [PMC free article] [PubMed] [Google Scholar]
- 27.Huda W, Ogden KM, Khorasani MR. Converting dose-length product to effective dose at CT. Radiology 2008;248(3):995–1003 [DOI] [PMC free article] [PubMed] [Google Scholar]
- 28.van Straten M, Deak P, Shrimpton PC, Kalender WA. The effect of angular and longitudinal tube current modulations on the estimation of organ and effective doses in x-ray computed tomography. Med Phys 2009;36(11):4881–4889 [DOI] [PubMed] [Google Scholar]
- 29.Rosner B. Fundamentals of biostatistics. 6th ed. Belmont, Calif: Thomson-Brooks/Cole, 2006 [Google Scholar]
- 30.Kleinman PL, Strauss KJ, Zurakowski D, Buckley KS, Taylor GA. Patient size measured on CT images as a function of age at a tertiary care children’s hospital. AJR Am J Roentgenol 2010;194(6):1611–1619 [DOI] [PubMed] [Google Scholar]
- 31.American Association of Physicists in Medicine The measurement, reporting, and management of radiation dose in CT. AAPM Report No 96. College Park, Md: American Association of Physicists in Medicine, 2008 [Google Scholar]
- 32.Deak PD, Langner O, Lell M, Kalender WA. Effects of adaptive section collimation on patient radiation dose in multisection spiral CT. Radiology 2009;252(1):140–147 [DOI] [PubMed] [Google Scholar]
- 33.Christner JA, Kofler JM, McCollough CH. Estimating effective dose for CT using dose-length product compared with using organ doses: consequences of adopting International Commission on Radiological Protection publication 103 or dual-energy scanning. AJR Am J Roentgenol 2010;194(4):881–889 [DOI] [PubMed] [Google Scholar]
- 34.Lee C, Lee C, Staton RJ, et al. Organ and effective doses in pediatric patients undergoing helical multislice computed tomography examination. Med Phys 2007;34(5):1858–1873 [DOI] [PubMed] [Google Scholar]
- 35.Haaga JR, Miraldi F, MacIntyre W, LiPuma JP, Bryan PJ, Wiesen E. The effect of mAs variation upon computed tomography image quality as evaluated by in vivo and in vitro studies. Radiology 1981;138(2):449–454 [DOI] [PubMed] [Google Scholar]
- 36.Haaga JR. Radiation dose management: weighing risk versus benefit. AJR Am J Roentgenol 2001;177(2):289–291 [DOI] [PubMed] [Google Scholar]
- 37.Amis ES, Jr, Butler PF, Applegate KE, et al. American College of Radiology white paper on radiation dose in medicine. J Am Coll Radiol 2007;4(5):272–284 [DOI] [PubMed] [Google Scholar]
- 38.IAEA radiation protection of patients IAEA smart card/smartrad track project. International Atomic Energy Agency. http://rpop.iaea.org/RPOP/RPoP/Content/News/smart-card-project.htm. Accessed September 2010
- 39.Boone JM. The trouble with CTDI100. Med Phys 2007;34(4):1364–1371 [DOI] [PubMed] [Google Scholar]


