If confirmed with future prospective studies, MR elastography could be used to distinguish between those individuals with simple steatosis and steatohepatitis who may be candidates for early intervention and more aggressive therapy.
Abstract
Purpose:
To investigate the diagnostic accuracy (area under the receiver operating characteristic curve [AUROC]) of magnetic resonance (MR) elastography for the early detection of nonalcoholic steatohepatitis (NASH) among patients with nonalcoholic fatty liver disease (NAFLD).
Materials and Methods:
An institutional review board–approved and HIPAA-compliant retrospective study was conducted in 58 NAFLD patients. Informed consent was waived by the review board. Hepatic stiffness, relative fat fraction, inflammation grade, and fibrosis stage were assessed from MR elastography, in-phase and out-of-phase gradient-echo imaging, and liver biopsy histopathologic review, respectively. Pairwise t testing, receiver operating characteristic analysis, and partial correlation analysis were performed.
Results:
The mean hepatic stiffness for patients with simple steatosis (2.51 kPa) was less (P = .028) than that for patients with inflammation but no fibrosis (3.24 kPa). The mean hepatic stiffness for patients with inflammation but no fibrosis was less (P = .030) than that for patients with hepatic fibrosis (4.16 kPa). Liver stiffness had high accuracy (AUROC = 0.93) for discriminating patients with NASH from those with simple steatosis, with a sensitivity of 94% and a specificity 73% by using a threshold of 2.74 kPa.
Conclusion:
In patients with NAFLD, hepatic stiffness measurements with MR elastography can help identify individuals with steatohepatitis, even before the onset of fibrosis; NAFLD patients with inflammation but no fibrosis have greater liver stiffness than those with simple steatosis and lower mean stiffness than those with fibrosis.
© RSNA, 2011
Introduction
Nonalcoholic fatty liver disease (NAFLD) is an increasingly prevalent clinical syndrome associated with obesity and type 2 diabetes mellitus (1–4). NAFLD is estimated to affect one-third of the general adult population in the United States (5). Individuals with hepatic steatosis alone are thought to have a benign long-term prognosis. However, up to 25% of these patients may develop nonalcoholic steatohepatitis (NASH), which may progress to cirrhosis in susceptible individuals (1,3,6). Based on the prevalence of NAFLD, it is anticipated that NASH-induced cirrhosis will become the most common indication for liver transplantation in the future (3). Differentiating NASH from simple steatosis is important for the clinical management of NAFLD patients. Evidence to date confirms that early stage NASH has a probability of 18%–39% to progress to more advanced stages of hepatic fibrosis within 3.5–8.2 years (7–11). Therefore, given the current high prevalence of NAFLD in the general population, it has even been suggested that early liver biopsy may be indicated in all NAFLD patients, because it is expected that earlier intervention and more aggressive treatment would reduce overall mortality (11).
Currently, a diagnosis of NASH requires liver histology results. Thus, liver biopsy is considered the reference standard to detect and stage liver cell injury from NASH (12–15). However, liver biopsy has several disadvantages, including sampling error, inter- and intrarater variability, poor patient acceptance, and potential complications including excessive bleeding and death (11,12,16–18). Traditional imaging modalities (eg, ultrasonography [US], computed tomography [CT], and magnetic resonance [MR] imaging) can help to detect the presence of hepatic steatosis; however, none of them can help to distinguish necroinflammation and mild fibrosis from simple steatosis. New noninvasive methods including serologic biomarkers, US-based transient elastography, and MR elastography have been developed for assessing hepatic fibrosis. Serologic tests have high accuracy (area under the receiver operating characteristic curve [AUROC] = 0.77–0.91) for differentiating advanced fibrosis from mild or no fibrosis (12,19–23) but are poor for diagnosing mild fibrosis and necroinflammation, which is the histologic biomarker required for transition from simple steatosis to NASH. Recently, plasma pentraxin 3 (PTX3) and cytokeratin 18 (CK18) fragments have shown improved accuracy for detecting NASH (AUROC = 0.75–0.83), yet further validation is still required (24–27). US-based transient elastography has a high accuracy (AUROC = 0.79–0.98) for detecting fibrosis by measuring the Young modulus (stiffness) of liver tissue (28–30). However, there has been difficulty in measuring liver stiffness with US-based transient elastography in obese subjects.
MR elastography is an MR imaging–based method for quantitatively imaging tissue stiffness and requires the addition of special hardware and software to standard MR imaging systems. Quantitative stiffness images (elastograms) of the liver can be rapidly obtained during breath-hold acquisitions and therefore can be readily included in conventional liver MR imaging protocols. Multiple studies have also shown that MR elastography–based hepatic stiffness measurements provide an accurate biomarker (AUROC = 0.96–0.99) for detecting the presence of fibrosis (31–36).
Given that the spectrum of fatty liver disease ranges from simple steatosis, through stages of liver cell injury (steatohepatitis), to fibrosis, and eventually to cirrhosis, it is appropriate to ask whether hepatic stiffness as a biomarker can be used to identify the presence of liver cell injury prior to the onset of fibrosis. A study of US-based quantitative elastography reported that the technique is not sensitive in identifying steatohepatitis without fibrosis in patients with fatty liver disease (30). However, a recent in vivo animal study reported that MR elastography–based liver stiffness measurements were able to discriminate the presence of steatohepatitis from simple steatosis prior to the onset of fibrosis in a rat model of fatty liver disease (37).
We performed a retrospective study to investigate the variation of liver stiffness in NAFLD patients with a spectrum of disease varying from simple steatosis to NASH. The hypothesis was that the hepatic stiffness in patients with NASH but no fibrosis is higher than that in patients with simple steatosis. The purpose was to investigate the diagnostic accuracy of MR elastography for the early detection of NASH among patients with NAFLD.
Materials and Methods
This retrospective study was approved by the institutional review board at Mayo Clinic, and informed consent was waived for all study subjects after the nature of the study had been fully explained. The study was Health Insurance Portability and Accountability Act compliant.
Patients who had undergone MR elastography for the assessment of clinically suspected NAFLD between January 2007 and March 2010 were identified for this study. Inclusion criteria were as follows: age 18 years and older; a diagnosis of NAFLD made by (a) exclusion of known causes for chronic liver disease and/or (b) cross-sectional imaging identifying hepatic steatosis within 1 year of MR elastography examination; and liver histology findings consistent with NAFLD within 90 days of MR elastography examination. Fifty-nine patients were identified based on the inclusion criteria. Exclusion criteria were as follows: (a) current or previous history of decompensated cirrhosis (0 of 59 patients), (b) history of hepatocellular carcinoma, cholangiocarcinoma, or secondary hepatic metastases (one patient), and (c) history of prior liver resection or transplantation (0 of 59 patients). Fifty-eight patients were included in this study based on these selection criteria. The indications for MR elastography in these patients were evaluation of abnormal liver enzymes (eight of 58 patients), follow-up of known NAFLD (45 of 58), follow-up of known cirrhosis (four of 58), and known total parenteral nutrition use (one of 58). Liver MR elastography images, in-phase and out-of-phase liver images, and liver biopsy specimens were retrieved from the clinic archives for measurement and interpretation.
Liver Stiffness Measurement
All of the included patients underwent hepatic MR elastography examinations performed with 1.5-T imagers (GE Healthcare, Milwaukee, Wis) located at several different clinical sites on our campus with a two-dimensional MR elastography protocol similar to one previously described in the literature (35) and briefly summarized here. Each patient was imaged in the supine position. A drumlike acoustic passive driver was positioned against the body wall (over the liver and centered at the level of the xiphoid process) and secured with an elastic belt. The passive driver was connected to an active acoustic driver system located outside of the scanner room via a polyvinylchloride tube. The active driver produces acoustic vibrations at 60 Hz, which are transmitted to the passive driver, which then transmits the vibrations into the body producing shear wave motion within the liver. A gradient-echo MR elastography sequence was used to acquire images showing shear wave propagation within the liver by encoding tissue motion into the phase of the measured MR signal. The shear wave images were processed to produce images of hepatic stiffness (elastograms) by using a previously described direct inversion algorithm (38). The MR elastography sequence parameters were as follows: phase offsets, four; motion sensitivity, 10.2 μm/radian; axial imaging plane; superior-inferior motion-sensitizing direction; field of view, 34–44 cm; acquisition matrix, 256 × 96; fractional phase field of view, 0.75–1; flip angle, 30°; one signal acquired; bandwidth, 31.25 kHz; echo time msec/repetition time msec, 24.5/50; section thickness, 10 mm; number of sections, two to four; imaging time, two to four breath holds (about 17 seconds each). A custom drawing program was used to draw regions of interest by one author (J.C.) who had 4 years of MR elastography experience and was blinded to the liver histology results. On each section of the MR magnitude image from the MR elastography acquisition, the regions of interest were drawn to include only the parenchyma of the liver, avoiding the edges of the liver and large blood vessels. The regions of interest also excluded regions where the phase signal-to-noise ratio (the ratio of wave amplitude to the noise in the wave images) was less than 5. The mean liver stiffness was reported from the region obtained by pooling the regions of interest drawn on all of the sections. The mean size of the pooled regions of interest was 2324 pixels (range, 219–5375 pixels) for the 58 patients in this study.
Hepatic Relative Fat Fraction Measurement
Hepatic relative fat fraction (RFF) was measured by using a two-point Dixon method (39,40). A fast gradient echo sequence was performed to acquire in-phase and out-of-phase images with the following parameters: repetition time msec/echo times msec, 110/2.1, 4.3; flip angle, 70°; matrix, 256 × 192; axial imaging plane; section thickness, 6 mm; field of view, 34–44 cm; fractional phase field of view, 0.75–1; one signal acquired; bandwidth, 62.5 kHz; imaging time, two breath holds (about 16 seconds each). Close to the regions of interest drawn for the hepatic stiffness measurements, new regions of interest were drawn on the in-phase and out-of-phase images for RFF measurements. The RFF was calculated as follows (39,40):
where SIP is the signal intensity measured on the in-phase images and SOP is the signal intensity measured on the out-of-phase images. Hepatic stiffness and RFF were analyzed by one author (J.C.) who was blinded to the liver histology results.
Histopathologic Interpretation
Liver biopsy specimens retrieved from our clinic archives were interpreted according to the Brunt classification (14,41). Inflammation grade and fibrosis stage were recorded by one author (S.O.S.) who had 6 years of experience and was blinded to the imaging results.
Statistical Analysis
Mean liver stiffness and RFF were recorded as continuous values, and inflammation grade and fibrosis stage, as ordinal values. A natural log transform was performed on the mean stiffness and RFF data to produce approximately normal distributions for analysis. The liver stiffness and RFF data were compared between three patient groups: group S (simple steatosis), group I (inflammation with no fibrosis), and group F (fibrosis). Multiple comparisons were performed by using the least significant difference procedure and paired t tests. The mean and standard deviation of the transformed data were inverse transformed to yield the geometric mean and coefficient of variation (CV), respectively, of the original data. Receiver operating characteristic analysis was performed to determine the diagnostic value of liver stiffness for differentiating NASH from simple steatosis. The partial correlation coefficient using type III partial sums of squares was calculated to determine the relationship between liver stiffness, RFF, inflammation grade, and fibrosis stage. A P value less than .05 was considered to indicate a statistically significant difference. Statistical software (JMP 8.0; SAS, Cary, NC) was used to perform the statistical analysis.
Results
Liver Stiffness in Patients with NAFLD
In total, 58 patients with NAFLD who underwent hepatic MR elastography within 90 days of liver biopsy were identified. The mean age was 51.5 years (range, 25–78 years), mean body mass index was 38.3 (range, 21.2–50.6), and 83% (48 of 58) of the patients were female. For the male patients, the mean age was 52 years (range, 27–69 years) and the mean body mass index was 37.5 (range, 22.4–50.6). For the female patients, the mean age was 51.4 years (range, 25–78 years) and the mean body mass index was 38.5 (range, 21.2–50.4). The patient distribution based on liver histology results were as follows: stage 4 fibrosis in 10.35% (n = 6), stage 3 fibrosis in 8.62% (n = 5), stage 2 fibrosis in 5.17% (n = 3), stage 1 fibrosis in 25.86% (n = 15), inflammation without fibrosis (group I) in 12.07% (n = 7), simple steatosis (group S) in 37.93% (n = 22), and stage 1–4 fibrosis (group F) in 50% (n = 29). Figure 1 shows representative examples of MR elastography results for the three NAFLD patient groups (groups S, I, and F).
Figure 1a:
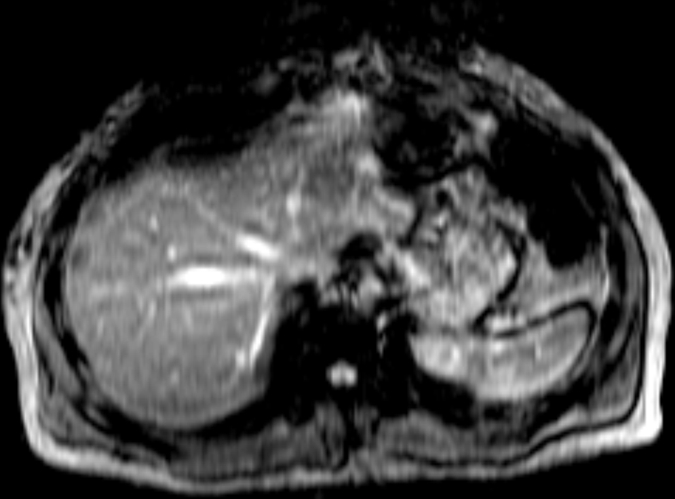
MR elastography magnitude images (top row) and MR elastograms (bottom row) in NAFLD patients with (a, d) simple steatosis, (b, e) inflammation but no fibrosis, and (c, f) fibrosis. The mean liver stiffness was 2.02, 3.59, and 7.52 kPa, respectively.
Figure 1b:
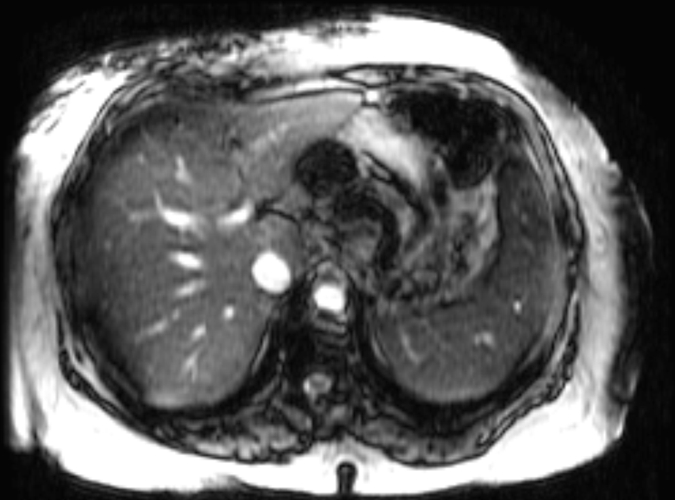
MR elastography magnitude images (top row) and MR elastograms (bottom row) in NAFLD patients with (a, d) simple steatosis, (b, e) inflammation but no fibrosis, and (c, f) fibrosis. The mean liver stiffness was 2.02, 3.59, and 7.52 kPa, respectively.
Figure 1c:
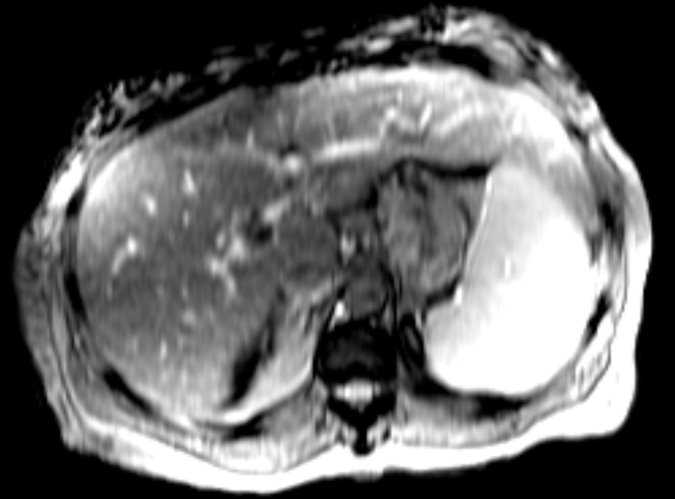
MR elastography magnitude images (top row) and MR elastograms (bottom row) in NAFLD patients with (a, d) simple steatosis, (b, e) inflammation but no fibrosis, and (c, f) fibrosis. The mean liver stiffness was 2.02, 3.59, and 7.52 kPa, respectively.
Figure 1d:
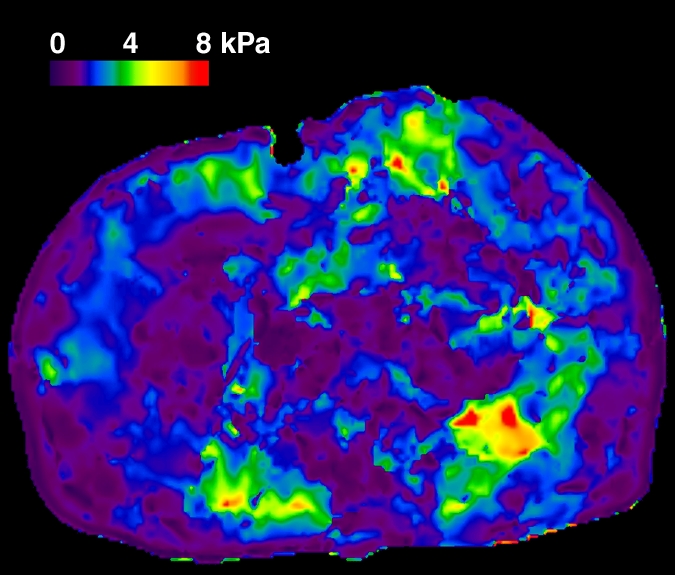
MR elastography magnitude images (top row) and MR elastograms (bottom row) in NAFLD patients with (a, d) simple steatosis, (b, e) inflammation but no fibrosis, and (c, f) fibrosis. The mean liver stiffness was 2.02, 3.59, and 7.52 kPa, respectively.
Figure 1e:
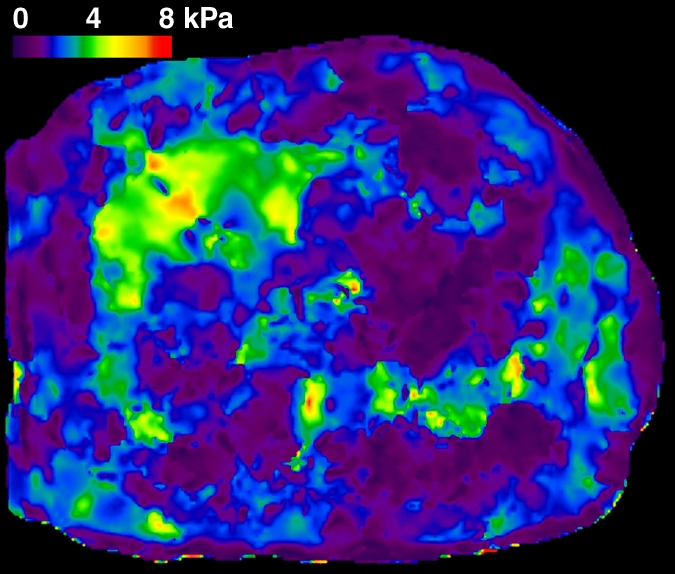
MR elastography magnitude images (top row) and MR elastograms (bottom row) in NAFLD patients with (a, d) simple steatosis, (b, e) inflammation but no fibrosis, and (c, f) fibrosis. The mean liver stiffness was 2.02, 3.59, and 7.52 kPa, respectively.
Figure 1f:
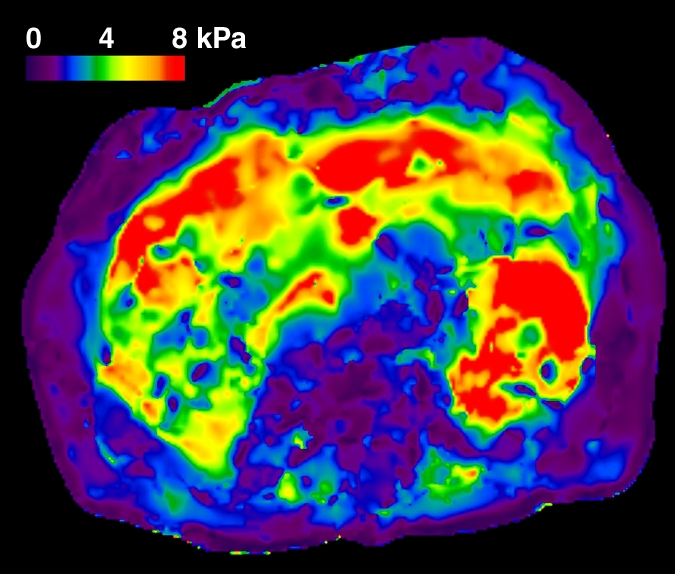
MR elastography magnitude images (top row) and MR elastograms (bottom row) in NAFLD patients with (a, d) simple steatosis, (b, e) inflammation but no fibrosis, and (c, f) fibrosis. The mean liver stiffness was 2.02, 3.59, and 7.52 kPa, respectively.
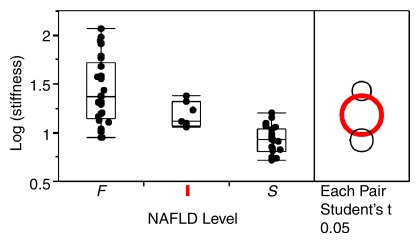
The geometric mean liver stiffness and CV for groups S, I, and F were 2.51 kPa (CV = 14.3%), 3.24 kPa (CV = 13.0%), and 4.16 kPa (CV = 40.9%), respectively. The mean liver stiffness in group I was significantly greater than that in group S (P = .028), and the mean liver stiffness in group F was significantly greater than that in group I (P = .030) (Fig 2).
Figure 2:
Mean hepatic stiffness for the three NAFLD patient groups on a logarithmic scale. Stiffness was significantly greater in group I than in group S (P = .028), and was significantly greater in group F than in group I (P = .030). F = fibrosis, I = inflammation without fibrosis, S = simple steatosis.
Diagnostic Performance of MR Elastography for Detection of NASH
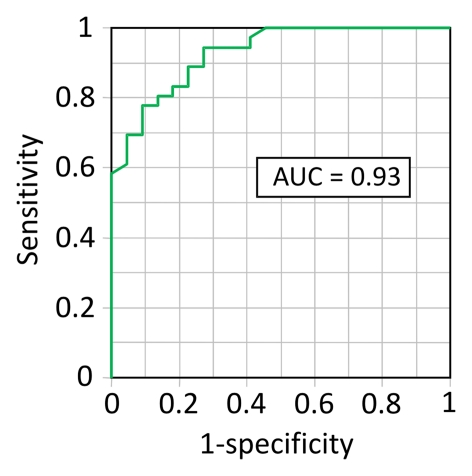
Receiver operating characteristic analysis demonstrated that liver stiffness is a highly accurate metric (AUROC = 0.93) for differentiating NASH from simple steatosis (Fig 3). The Table shows the sensitivity, specificity, positive predictive value, and negative predictive value at two different stiffness thresholds for differentiating NASH from simple steatosis.
Figure 3:
Receiver operating characteristic analysis shows performance of MR elastography–measured liver stiffness for differentiating NASH from simple steatosis. The graph indicates a high diagnostic accuracy with an AUROC of 0.93.
Differentiation of NASH from Simple Steatosis by Using Different Stiffness Thresholds

Note.—Data in parentheses are raw data used to calculate percentages. NPV = negative predictive value, PPV = positive predictive value.
Hepatic RFF of NAFLD Patients
Hepatic RFF was measured using the retrieved in-phase and out-of-phase images. For two patients, there were no data available to calculate the RFF. Among the other 56 patients, the mean age was 51.8 years (range, 25–78 years), the mean body mass index was 38.2 (range,21.2–50.6), and 82% (46 of 56) of patients were women. For the male patients, the mean age was 52 years (range, 27–69 years), and the mean body mass index was 37.5 (range, 22.4–50.6). For the female patients, the mean age was 51.8 years (range, 25–78 years) and the mean body mass index was 38.2 (range, 21.2–50.4). The patients were identified according to liver histology results as having simple steatosis in 37.5% (21 of 56) of cases, inflammation with no fibrosis in 12.5% (seven of 56) of cases, or varying degrees of fibrosis in 50% (28 of 56) of cases.
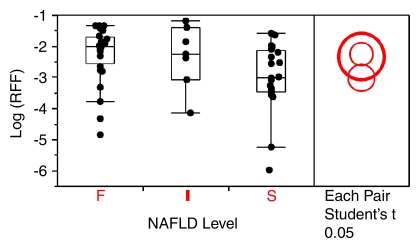
The geometric mean RFF and CV for patient groups S, I, and F were 0.050 (CV = 196%), 0.098 (178%), and 0.106 (142%), respectively. Pairwise t tests with the least significant difference rule accompanied by multiple comparisons showed that the RFF of group I was not significantly different from that of group S (P = .117), and that the RFF of group F was not significantly different from that of group I (P = .853) (Fig 4).
Figure 4:
Mean RFF for the three NAFLD patient groups on a logarithmic scale. No significant differences were found (P > .05). F = fibrosis, I = inflammation without fibrosis, S = simple steatosis.
Correlation between Liver Stiffness, RFF, Inflammation Grade, and Fibrosis Stage
By using liver stiffness as the response variable and RFF, grade, and stage as the effect variables, the partial correlation coefficient and P value with liver stiffness was 0.095 (P = .52) for RFF, 0.462 (P = .0097) for inflammation grade, and 0.651 (P < .0001) for fibrosis stage. By using RFF as the response and liver stiffness, grade, and stage as the effects, the partial correlation coefficient of RFF was 0.095 (P = .52) with liver stiffness, 0.334 (P = .132) with grade, and 0.114 (P = .960) with stage.
Discussion
In this retrospective study, we found that liver stiffness was significantly higher in patients with NASH without progression to fibrosis compared with patients with simple steatosis (P = .028). Liver stiffness in patients with fibrosis was significantly higher than that in patients with inflammation and no fibrosis (P = .030). Liver stiffness was significantly correlated with inflammation grade (P = .0097) and fibrosis stage (P < .0001) but not with RFF (P = .52).
Several animal studies have shown an increase in liver stiffness at the stage of liver cell injury preceding the development of hepatic fibrosis. In vitro cell culture studies have shown that increased stiffness of the elastic microenvironment is one of the necessary precursors for transdifferentiation of hepatic stellate cells and portal fibroblasts into contractile myofibroblasts, which are responsible for development of fibrosis (42–44). In rat models, liver stiffness measured by ex vivo rheometry and in vivo MR elastography has been shown to increase significantly before the onset of deposition of fibrosis in the extracellular matrix, as identified by sirius red staining, and liver stiffness continued to increase with the severity of fibrosis (37,45). It has been speculated that increased cross-linking of the extracellular matrix by lysyloxidase, inflammatory cell infiltration, and edema could all be contributing factors to the observed increased stiffness (37,45). In summary, there is strong emerging evidence that early liver injury leads to changes in the extracellular matrix that increase the stiffness of hepatic tissue, which through a process known as mechanotransduction promotes the activation of stellate cells and the development of fibrosis.
Receiver operating characteristic analysis showed that by using a threshold of 2.74 kPa, liver stiffness had a sensitivity of 94% and a specificity of 73% for discriminating NASH from simple steatosis, with a high diagnostic accuracy (AUROC = 0.93). An alternative threshold of 2.90 kPa would provide a sensitivity and specificity of 83% and 82%, respectively.
The discrimination between NASH and simple steatosis may be important for the clinical management of NAFLD. In clinical practice, the basic therapy for NASH may involve lifestyle changes including exercise and diet (caloric restriction). In one study, in 60% of NASH patients there was histologic improvement after 1 year of intensive dietary intervention and in 100% of patients, histologic response was maintained or improved (46). Patients with early-stage NASH who have inflammation but no fibrosis can undergo more intensive counseling and follow-up on the importance of adopting lifestyle changes given the presence of liver stiffness. On the other hand, patients with hepatic fibrosis from NASH may be eligible for more aggressive treatment, such as bariatric surgery (47–55).
To date, liver biopsy remains the only way to detect and confirm NASH, even though it is an invasive method and has limitations such as sampling errors, inter- and intrarater variability, poor acceptance, and potential complications, including death. In addition to these limitations, another important factor is the poor acceptance likely to occur if it were recommended that early liver biopsy be performed in all potential NASH patients, especially among those who do not have significant medical symptoms. The frequency of patient refusal to undergo biopsy may exceed 50% in some centers in this situation, and the frequency of physician reluctance may be as high as 30% (56). Therefore, to satisfy the need for early detection of NASH while maintaining high compliance among physicians and patients, it is very important to find noninvasive biomarkers for discriminating NASH from simple steatosis.
In this study, there were a number of false-positive and false-negative classifications among this cohort of patients depending on the chosen stiffness threshold used to differentiate simple steatosis and steatohepatitis. These can be partially explained based on sampling errors associated with liver biopsy, which can cause misclassification of fibrosis stage by one category in 20%–30% of patients (57). Another source of error is variations in the reading of the biopsy findings, which was shown in one study to have an intrarater agreement of 0.66 (18). Also, a reproducibility study has shown that the variability of MR elastography examinations performed on different days with different readers can be as low as 12% (58), and it is possible that this variability in liver stiffness measurements could contribute to false-positive and false-negative findings. Another limiting factor was that the time window between liver biopsy and MR elastography examination was up to 90 days for some patients. Patients with hepatic inflammation at the time of biopsy may have adopted healthier lifestyle changes by the time of MR elastography, which may have also improved liver stiffness. We also did not consider the dynamic effect of hepatic perfusion in our study, which could cause elevated liver stiffness unrelated to the liver disease itself. This effect has been observed in other US-based transient elastography and MR elastography studies (59–62).
In the future, MR elastography could facilitate our understanding of the mechanobiology underpinning the development of liver disease, which could lead to techniques for the early detection of liver cell injury using liver stiffness measurements and new therapies that target the altered matrix stiffness as a means to prevent and treat liver fibrosis.
In this retrospective study, the mean hepatic RFFs in the three patient groups were not significantly different from one another. RFF was not significantly correlated to liver stiffness (P = .52), inflammation grade (P = .13), or fibrosis stage (P = .96), and it did not significantly correlate with the severity of NAFLD. In fact, we observed several patients with advanced fibrosis who did not have steatosis. This is probably because steatosis is gradually replaced by the extracellular matrix deposition as fibrosis progresses. While there has been little evidence to suggest a correlation between RFF and stiffness, grade, or stage, it must be noted that the accuracy of the two-point Dixon method used to quantify RFF is limited by an intrinsic ambiguity in the nature of the signal intensity variations on the in-phase and out-of-phase images, susceptibility effects, and the high flip angle used in this study (39,40,63). More sophisticated methods could improve the accuracy of hepatic fat measurements, such as MR spectroscopy (40,64).
The current study was limited due to its retrospective nature, sample size, and the long allowed time window between liver biopsy and the MR elastography examination. While it is well known that the spectrum of NAFLD ranges from simple steatosis to steatohepatitis (1–4,6,7,14), this study did not include prospective or longitudinal data to track liver stiffness through the stages of disease progression from simple steatosis to NASH in individual patients, which would require many years of patient monitoring.
The results of this retrospective study support the hypothesis that NAFLD patients with inflammation but no fibrosis have significantly higher liver stiffness than do those with simple steatosis. Liver stiffness measured by means of MR elastography may prove to be an accurate biomarker (AUROC = 0.93) for detecting NASH, which suggests that MR elastography should be further investigated for its potential to stratify patients with NAFLD. If confirmed by future prospective studies, then MR elastography could be used to distinguish between those individuals with simple steatosis and steatohepatitis who may be candidates for early intervention and more aggressive therapy.
Advances in Knowledge.
Liver stiffness increases significantly in early nonalcoholic steatohepatitis (NASH) even if fibrosis has not yet developed.
Liver stiffness increases with the severity of NASH: The partial correlation coefficient of liver stiffness to inflammation grade was 0.462 (P = .0097), and was 0.651 (P < .0001) between stiffness and fibrosis stage.
Liver stiffness measured at MR elastography appears to be an accurate noninvasive biomarker for NASH: MR elastography had a sensitivity of 94% and a specificity of 73% by using a threshold of 2.74 kPa to discern NASH from simple steatosis; the area under the receiver operating characteristic curve was 0.93.
Implication for Patient Care.
The results suggest that MR elastography should be further investigated as a way to stratify patients with fatty liver disease by distinguishing between those with simple steatosis and those with steatohepatitis who may be candidates for early intervention and more aggressive therapy.
Disclosures of Potential Conflicts of Interest: J.C. Financial activities related to the present article: author has intellectual property rights related to MR elastography, including rights involved in a paid-up license between Mayo Clinic and General Electric. Financial activities not related to the present article: royalties from GE Healthcare. Other relationships: none to disclose. J.A.T. Financial activities related to the present article: none to disclose. Financial activities not related to the present article: royalties from GE Healthcare. Other relationships: none to disclose. M.Y. Financial activities related to the present article: author has intellectual property rights related to MR elastography, including rights involved in a paid-up license between Mayo Clinic and General Electric. Financial activities not related to the present article: royalties from GE Healthcare. Other relationships: none to disclose. K.J.G. Financial activities related to the present article: author has intellectual property rights related to MR elastography, including rights involved in a paid-up license between Mayo Clinic and General Electric. Financial activities not related to the present article: royalties from GE Healthcare. Other relationships: none to disclose. S.O.S. No potential conflicts of interest to disclose. R.L.E. Financial activities related to the present article: author has intellectual property rights related to MR elastography, including rights involved in a paid-up license between Mayo Clinic and General Electric. Financial activities not related to the present article: royalties from GE Healthcare. Other relationships: Mayo Clinic may establish a company to assist MR elastography manufacturers to develop it as a product.
Acknowledgments
We thank Stephen S. Cha (Division of Biomedical Statistics & Informatics, Mayo Clinic) for assistance with the statistical analysis.
Received September 27, 2010; revision requested November 18; revision received January 18, 2011; final version accepted January 31.
Funding: This research was supported by the National Institutes of Health (grant EB 001981).
Abbreviations:
- AUROC
- area under the receiver operating characteristic curve
- CV
- coefficient of variation
- NAFLD
- nonalcoholic fatty liver disease
- NASH
- nonalcoholic steatohepatitis
- RFF
- relative fat fraction
References
- 1.Ehman RL. Science to practice: can MR elastography be used to detect early steatohepatitis in fatty liver disease? Radiology 2009;253(1):1–3 [DOI] [PubMed] [Google Scholar]
- 2.Adams LA, Lindor KD. Nonalcoholic fatty liver disease. Ann Epidemiol 2007;17(11):863–869 [DOI] [PubMed] [Google Scholar]
- 3.Charlton M. Nonalcoholic fatty liver disease: a review of current understanding and future impact. Clin Gastroenterol Hepatol 2004;2(12):1048–1058 [DOI] [PubMed] [Google Scholar]
- 4.Ludwig J, Viggiano TR, McGill DB, Oh BJ. Nonalcoholic steatohepatitis: Mayo Clinic experiences with a hitherto unnamed disease. Mayo Clin Proc 1980;55(7):434–438 [PubMed] [Google Scholar]
- 5.Browning JD, Szczepaniak LS, Dobbins R, et al. Prevalence of hepatic steatosis in an urban population in the United States: impact of ethnicity. Hepatology 2004;40(6):1387–1395 [DOI] [PubMed] [Google Scholar]
- 6.Adams LA, Angulo P, Lindor KD. Nonalcoholic fatty liver disease. CMAJ 2005;172(7):899–905 [DOI] [PMC free article] [PubMed] [Google Scholar]
- 7.Harrison SA, Torgerson S, Hayashi PH. The natural history of nonalcoholic fatty liver disease: a clinical histopathological study. Am J Gastroenterol 2003;98(9):2042–2047 [DOI] [PubMed] [Google Scholar]
- 8.Powell EE, Cooksley WG, Hanson R, Searle J, Halliday JW, Powell LW. The natural history of nonalcoholic steatohepatitis: a follow-up study of forty-two patients for up to 21 years. Hepatology 1990;11(1):74–80 [DOI] [PubMed] [Google Scholar]
- 9.Fassio E, Alvarez E, Domínguez N, Landeira G, Longo C. Natural history of nonalcoholic steatohepatitis: a longitudinal study of repeat liver biopsies. Hepatology 2004;40(4):820–826 [DOI] [PubMed] [Google Scholar]
- 10.Evans CD, Oien KA, MacSween RN, Mills PR. Non-alcoholic steatohepatitis: a common cause of progressive chronic liver injury? J Clin Pathol 2002;55(9):689–692 [DOI] [PMC free article] [PubMed] [Google Scholar]
- 11.Gaidos JK, Hillner BE, Sanyal AJ. A decision analysis study of the value of a liver biopsy in nonalcoholic steatohepatitis. Liver Int 2008;28(5):650–658 [DOI] [PubMed] [Google Scholar]
- 12.Zhou K, Lu LG. Assessment of fibrosis in chronic liver diseases. J Dig Dis 2009;10(1):7–14 [DOI] [PubMed] [Google Scholar]
- 13.Bravo AA, Sheth SG, Chopra S. Liver biopsy. N Engl J Med 2001;344(7):495–500 [DOI] [PubMed] [Google Scholar]
- 14.Angulo P. Nonalcoholic fatty liver disease. N Engl J Med 2002;346(16):1221–1231 [DOI] [PubMed] [Google Scholar]
- 15.Adams LA, Lymp JF, St Sauver J, et al. The natural history of nonalcoholic fatty liver disease: a population-based cohort study. Gastroenterology 2005;129(1):113–121 [DOI] [PubMed] [Google Scholar]
- 16.Colloredo G, Guido M, Sonzogni A, Leandro G. Impact of liver biopsy size on histological evaluation of chronic viral hepatitis: the smaller the sample, the milder the disease. J Hepatol 2003;39(2):239–244 [DOI] [PubMed] [Google Scholar]
- 17.McGill DB, Rakela J, Zinsmeister AR, Ott BJ. A 21-year experience with major hemorrhage after percutaneous liver biopsy. Gastroenterology 1990;99(5):1396–1400 [DOI] [PubMed] [Google Scholar]
- 18.Kleiner DE, Brunt EM, Van Natta M, et al. Design and validation of a histological scoring system for nonalcoholic fatty liver disease. Hepatology 2005;41(6):1313–1321 [DOI] [PubMed] [Google Scholar]
- 19.Angulo P, Hui JM, Marchesini G, et al. The NAFLD fibrosis score: a noninvasive system that identifies liver fibrosis in patients with NAFLD. Hepatology 2007;45(4):846–854 [DOI] [PubMed] [Google Scholar]
- 20.Sud A, Hui JM, Farrell GC, et al. Improved prediction of fibrosis in chronic hepatitis C using measures of insulin resistance in a probability index. Hepatology 2004;39(5):1239–1247 [DOI] [PubMed] [Google Scholar]
- 21.Sakugawa H, Nakayoshi T, Kobashigawa K, et al. Clinical usefulness of biochemical markers of liver fibrosis in patients with nonalcoholic fatty liver disease. World J Gastroenterol 2005;11(2):255–259 [DOI] [PMC free article] [PubMed] [Google Scholar]
- 22.Mohamadnejad M, Montazeri G, Fazlollahi A, et al. Noninvasive markers of liver fibrosis and inflammation in chronic hepatitis B-virus related liver disease. Am J Gastroenterol 2006;101(11):2537–2545 [DOI] [PubMed] [Google Scholar]
- 23.Guha IN, Parkes J, Roderick P, et al. Noninvasive markers of fibrosis in nonalcoholic fatty liver disease: Validating the European Liver Fibrosis Panel and exploring simple markers. Hepatology 2008;47(2):455–460 [DOI] [PubMed] [Google Scholar]
- 24.Feldstein AE, Wieckowska A, Lopez AR, Liu YC, Zein NN, McCullough AJ. Cytokeratin-18 fragment levels as noninvasive biomarkers for nonalcoholic steatohepatitis: a multicenter validation study. Hepatology 2009;50(4):1072–1078 [DOI] [PMC free article] [PubMed] [Google Scholar]
- 25.Malik R, Chang M, Bhaskar K, et al. The clinical utility of biomarkers and the nonalcoholic steatohepatitis CRN liver biopsy scoring system in patients with nonalcoholic fatty liver disease. J Gastroenterol Hepatol 2009;24(4):564–568 [DOI] [PubMed] [Google Scholar]
- 26.Talwalkar JA. One step at a time: identification and validation of biomarkers for nonalcoholic steatohepatitis. Hepatology 2009;50(4):1000–1003 [DOI] [PubMed] [Google Scholar]
- 27.Yoneda M, Uchiyama T, Kato S, et al. Plasma Pentraxin3 is a novel marker for nonalcoholic steatohepatitis (NASH). BMC Gastroenterol 2008;8:53. [DOI] [PMC free article] [PubMed] [Google Scholar]
- 28.Ziol M, Handra-Luca A, Kettaneh A, et al. Noninvasive assessment of liver fibrosis by measurement of stiffness in patients with chronic hepatitis C. Hepatology 2005;41(1):48–54 [DOI] [PubMed] [Google Scholar]
- 29.Takemoto R, Nakamuta M, Aoyagi Y, et al. Validity of FibroScan values for predicting hepatic fibrosis stage in patients with chronic HCV infection. J Dig Dis 2009;10(2):145–148 [DOI] [PubMed] [Google Scholar]
- 30.Lupsor M, Badea R, Stefanescu H, et al. Performance of unidimensional transient elastography in staging non-alcoholic steatohepatitis. J Gastrointestin Liver Dis 2010;19(1):53–60 [PubMed] [Google Scholar]
- 31.Talwalkar JA. Elastography for detecting hepatic fibrosis: options and considerations. Gastroenterology 2008;135(1):299–302 [DOI] [PMC free article] [PubMed] [Google Scholar]
- 32.Talwalkar JA, Yin M, Fidler JL, Sanderson SO, Kamath PS, Ehman RL. Magnetic resonance imaging of hepatic fibrosis: emerging clinical applications. Hepatology 2008;47(1):332–342 [DOI] [PubMed] [Google Scholar]
- 33.Huwart L, Sempoux C, Vicaut E, et al. Magnetic resonance elastography for the noninvasive staging of liver fibrosis. Gastroenterology 2008;135(1):32–40 [DOI] [PubMed] [Google Scholar]
- 34.Asbach P, Klatt D, Hamhaber U, et al. Assessment of liver viscoelasticity using multifrequency MR elastography. Magn Reson Med 2008;60(2):373–379 [DOI] [PubMed] [Google Scholar]
- 35.Yin M, Talwalkar JA, Glaser KJ, et al. Assessment of hepatic fibrosis with magnetic resonance elastography. Clin Gastroenterol Hepatol 2007;5(10):1207–1213e2 [DOI] [PMC free article] [PubMed] [Google Scholar]
- 36.Muthupillai R, Lomas DJ, Rossman PJ, Greenleaf JF, Manduca A, Ehman RL. Magnetic resonance elastography by direct visualization of propagating acoustic strain waves. Science 1995;269(5232):1854–1857 [DOI] [PubMed] [Google Scholar]
- 37.Salameh N, Larrat B, Abarca-Quinones J, et al. Early detection of steatohepatitis in fatty rat liver by using MR elastography. Radiology 2009;253(1):90–97 [DOI] [PubMed] [Google Scholar]
- 38.Manduca A, Oliphant TE, Dresner MA, et al. Magnetic resonance elastography: non-invasive mapping of tissue elasticity. Med Image Anal 2001;5(4):237–254 [DOI] [PubMed] [Google Scholar]
- 39.Levenson H, Greensite F, Hoefs J, et al. Fatty infiltration of the liver: quantification with phase-contrast MR imaging at 1.5 T vs biopsy. AJR Am J Roentgenol 1991;156(2):307–312 [DOI] [PubMed] [Google Scholar]
- 40.Bernstein MA, King KF, Zhou XJ. Handbook of MRI pulse sequences. San Diego, Calif: Elsevier Academic Press, 2004 [Google Scholar]
- 41.Brunt EM, Janney CG, Di Bisceglie AM, Neuschwander-Tetri BA, Bacon BR. Nonalcoholic steatohepatitis: a proposal for grading and staging the histological lesions. Am J Gastroenterol 1999;94(9):2467–2474 [DOI] [PubMed] [Google Scholar]
- 42.Wells RG. The role of matrix stiffness in hepatic stellate cell activation and liver fibrosis. J Clin Gastroenterol 2005;39(4 Suppl 2):S158–S161 [DOI] [PubMed] [Google Scholar]
- 43.Wells RG. The role of matrix stiffness in regulating cell behavior. Hepatology 2008;47(4):1394–1400 [DOI] [PubMed] [Google Scholar]
- 44.Li Z, Dranoff JA, Chan EP, Uemura M, Sévigny J, Wells RG. Transforming growth factor-beta and substrate stiffness regulate portal fibroblast activation in culture. Hepatology 2007;46(4):1246–1256 [DOI] [PubMed] [Google Scholar]
- 45.Georges PC, Hui JJ, Gombos Z, et al. Increased stiffness of the rat liver precedes matrix deposition: implications for fibrosis. Am J Physiol Gastrointest Liver Physiol 2007;293(6):G1147–G1154 [DOI] [PubMed] [Google Scholar]
- 46.Huang MA, Greenson JK, Chao C, et al. One-year intense nutritional counseling results in histological improvement in patients with non-alcoholic steatohepatitis: a pilot study. Am J Gastroenterol 2005;100(5):1072–1081 [DOI] [PubMed] [Google Scholar]
- 47.Clark JM, Alkhuraishi AR, Solga SF, Alli P, Diehl AM, Magnuson TH. Roux-en-Y gastric bypass improves liver histology in patients with non-alcoholic fatty liver disease. Obes Res 2005;13(7):1180–1186 [DOI] [PubMed] [Google Scholar]
- 48.Kral JG, Thung SN, Biron S, et al. Effects of surgical treatment of the metabolic syndrome on liver fibrosis and cirrhosis. Surgery 2004;135(1):48–58 [DOI] [PubMed] [Google Scholar]
- 49.Mattar SG, Velcu LM, Rabinovitz M, et al. Surgically-induced weight loss significantly improves nonalcoholic fatty liver disease and the metabolic syndrome. Ann Surg 2005;242(4):610–617; discussion 618–620 [DOI] [PMC free article] [PubMed] [Google Scholar]
- 50.Luyckx FH, Desaive C, Thiry A, et al. Liver abnormalities in severely obese subjects: effect of drastic weight loss after gastroplasty. Int J Obes Relat Metab Disord 1998;22(3):222–226 [DOI] [PubMed] [Google Scholar]
- 51.Dixon JB, Bhathal PS, Hughes NR, O’Brien PE. Nonalcoholic fatty liver disease: Improvement in liver histological analysis with weight loss. Hepatology 2004;39(6):1647–1654 [DOI] [PubMed] [Google Scholar]
- 52.Promrat K, Lutchman G, Uwaifo GI, et al. A pilot study of pioglitazone treatment for nonalcoholic steatohepatitis. Hepatology 2004;39(1):188–196 [DOI] [PubMed] [Google Scholar]
- 53.Bugianesi E, Gentilcore E, Manini R, et al. A randomized controlled trial of metformin versus vitamin E or prescriptive diet in nonalcoholic fatty liver disease. Am J Gastroenterol 2005;100(5):1082–1090 [DOI] [PubMed] [Google Scholar]
- 54.Ranløv I, Hardt F. Regression of liver steatosis following gastroplasty or gastric bypass for morbid obesity. Digestion 1990;47(4):208–214 [DOI] [PubMed] [Google Scholar]
- 55.Silverman EM, Sapala JA, Appelman HD. Regression of hepatic steatosis in morbidly obese persons after gastric bypass. Am J Clin Pathol 1995;104(1):23–31 [DOI] [PubMed] [Google Scholar]
- 56.Sporea I, Popescu A, Sirli R. Why, who and how should perform liver biopsy in chronic liver diseases. World J Gastroenterol 2008;14(21):3396–3402 [DOI] [PMC free article] [PubMed] [Google Scholar]
- 57.Standish RA, Cholongitas E, Dhillon A, Burroughs AK, Dhillon AP. An appraisal of the histopathological assessment of liver fibrosis. Gut 2006;55(4):569–578 [DOI] [PMC free article] [PubMed] [Google Scholar]
- 58.Hines CDG, Bley TA, Lindstrom MJ, Reeder SB. Repeatability of magnetic resonance elastography for quantification of hepatic stiffness. J Magn Reson Imaging 2010;31(3):725–731 [DOI] [PMC free article] [PubMed] [Google Scholar]
- 59.Vizzutti F, Arena U, Romanelli RG, et al. Liver stiffness measurement predicts severe portal hypertension in patients with HCV-related cirrhosis. Hepatology 2007;45(5):1290–1297 [DOI] [PubMed] [Google Scholar]
- 60.Bureau C, Metivier S, Peron JM, et al. Transient elastography accurately predicts presence of significant portal hypertension in patients with chronic liver disease. Aliment Pharmacol Ther 2008;27(12):1261–1268 [DOI] [PubMed] [Google Scholar]
- 61.Carrión JA, Navasa M, Bosch J, Bruguera M, Gilabert R, Forns X. Transient elastography for diagnosis of advanced fibrosis and portal hypertension in patients with hepatitis C recurrence after liver transplantation. Liver Transpl 2006;12(12):1791–1798 [DOI] [PubMed] [Google Scholar]
- 62.Yin M, Glaser KJ, Kolipaka A, et al. Influence of perfusion on tissue stiffness assessed with MR elastography [abstr]. In: Proceedings of the Eighteenth Meeting of the International Society for Magnetic Resonance in Medicine. Berkeley, Calif: International Society for Magnetic Resonance in Medicine, 2010 [Google Scholar]
- 63.Hussain HK, Chenevert TL, Londy FJ, et al. Hepatic fat fraction: MR imaging for quantitative measurement and display—early experience. Radiology 2005;237(3):1048–1055 [DOI] [PubMed] [Google Scholar]
- 64.Cowin GJ, Jonsson JR, Bauer JD, et al. Magnetic resonance imaging and spectroscopy for monitoring liver steatosis. J Magn Reson Imaging 2008;28(4):937–945 [DOI] [PubMed] [Google Scholar]


