

Our study results demonstrate that automated temporal and parietal volumes measured at a single baseline MR examination can be used to accurately identify cognitively healthy individuals who are at risk for future memory decline.
Abstract
Purpose:
To determine whether automated temporoparietal brain volumes can be used to accurately predict future memory decline among a multicenter cohort of cognitively healthy elderly individuals.
Materials and Methods:
The study was approved by the institutional review board at each site and was HIPAA compliant, with written consent obtained from all participants. One hundred forty-nine cognitively healthy study participants were recruited through the Alzheimer’s Disease Neuroimaging Initiative and underwent a standardized baseline 1.5-T magnetic resonance (MR) imaging examination, as well as neuropsychological assessment at baseline and after 2 years of follow-up. A composite memory score for the 2-year change in the results of two delayed-recall tests was calculated, and memory decline was defined as a composite score that was at least 1 standard deviation below the group mean score. The predictive accuracy of the brain volumes was estimated by using areas under receiver operating characteristic curves and was further assessed by using leave-one-out cross validation.
Results:
Use of the most accurate region model, which included the hippocampus; parahippocampal gyrus; amygdala; superior, middle, and inferior temporal gyri; superior parietal lobe; and posterior cingulate gyrus, resulted in a fitted accuracy of 94% and a cross-validated accuracy of 81%.
Conclusion:
Study results indicate that automated temporal and parietal volumes can be used to identify with high accuracy cognitively healthy individuals who are at risk for future memory decline. Further validation of this predictive model in a new cohort is required.
© RSNA, 2011
Introduction
Twenty-four million people worldwide are currently afflicted with dementia, and this number is projected to double every 20 years (1). Alzheimer disease (AD) is the cause of the majority of these cases. A diagnosis of AD is attained through detailed neuropsychological assessment and radiologic exclusion of structural abnormalities. Thus far, no known treatment that substantially alters the course of AD has been identified, perhaps because irreversible neurodegeneration has already occurred before the diagnosis. As a result, there is growing interest in identifying individuals who are at risk for AD at an early stage, when memory preservation still may be possible.
Investigators in recent studies have reported that the brain volumes derived from magnetic resonance (MR) images, particularly those obtained in the temporal and parietal lobes, enable accurate differentiation between individuals with mild cognitive impairment (MCI) and probable AD and those who are cognitively healthy (2,3). In addition, brain volumes and cortical thicknesses have been shown to be predictive of which individuals with MCI will eventually develop AD (4,5). However, individuals with clinical evidence of memory impairment may already be at a relatively advanced stage of disease. The preventative therapies currently being evaluated in clinical trials may be more efficacious in a population without any evidence of memory impairment, in which substantial neuronal loss has not yet occurred (6). As a result, identifying cognitively healthy individuals who are at risk is an important next step.
An association between brain volumes and longitudinal cognitive decline in a cohort consisting solely of cognitively healthy individuals has been reported in three studies (7–9). All of these studies, however, involved analyses focused on the medial temporal lobe and the use of semiautomated or manual delineation of volumes, which may lack interrater reproducibility and practicality for use in clinical practice or a clinical trial. Furthermore, the diagnostic accuracy of the approach used to predict future cognitive decline, which was not cross validated, was reported in only one of these studies (8).
The purpose of our exploratory study was to determine whether automated temporoparietal brain volumes can facilitate accurate prediction of future memory decline among a multicenter cohort of cognitively healthy elderly individuals with no baseline clinical evidence of cognitive impairment. We hypothesized that medial temporal lobe volumes, which are known to be affected earliest in the disease course (10), would be the most predictive of memory decline in cognitively healthy individuals. We further predicted that parietal lobe volumes, which are also included in the memory network and are affected in individuals with AD, would also contribute to the model by complementing the predictions based on temporal lobe volumes alone.
Materials and Methods
Subjects
One hundred forty-nine participants were recruited from 56 centers in the United States and Canada (Table 1) between 2005 and 2008 through the Alzheimer’s Disease Neuroimaging Initiative (ADNI) (11). The ADNI was funded as a prospective longitudinal study to identify biomarkers of early AD for trials and was supported by the National Institute on Aging, the National Institute of Biomedical Imaging and Bioengineering, the Food and Drug Administration, pharmaceutical companies, and nonprofit organizations. Written consent was obtained from all subjects, and the study was approved by the institutional review board of each participating center. This study was also compliant with Health Insurance Portability and Accountability Act guidelines.
Table 1.
Baseline Characteristics
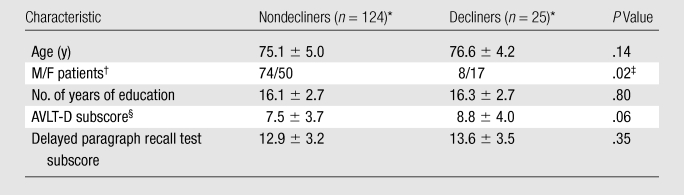
Unless otherwise noted, data are mean values ± standard deviations.
Data are numbers of patients.
Difference between nondecliners and decliners was significant.
AVLT-D = Rey Auditory Verbal Learning Test, delayed recall.
Participants were older than 55 years, lacked clinical or structural evidence of neurologic or psychiatric disease, had no memory complaints, had preserved activities of daily living, and scored within the normal range on the Mini-Mental Status Examination (12), clinical dementia rating scale (13), and revised Wechsler memory scale (14). Further details regarding the inclusion and exclusion criteria can be found at http://www.adni-info.org/.
MR Image Acquisition and Volume Estimation
The participants underwent the following standardized 1.5-T MR imaging protocol (http://www.loni.ucla.edu/ADNI/Research/Cores/index.shtml): two T1-weighted MR imaging examinations with use of a sagittal volumetric magnetization-prepared rapid gradient-echo (MP-RAGE) sequence, with 9/4 (repetition time msec/echo time msec), a flip angle of 8°, and an acquisition matrix size of 256 × 256 × 166 in the x, y, and z dimensions, with a nominal voxel size of 0.94 × 0.94 × 1.2 mm. Investigators at a designated center selected the MP-RAGE images of higher quality for regional volume estimation (15).
The raw Digital Imaging and Communications in Medicine MR imaging data were downloaded from the Laboratory of Neuro Imaging Database archives (http://www.loni.ucla.edu/ADNI/Data/index.shtml). The MR images were automatically corrected for spatial distortion due to gradient nonlinearity and B1 field inhomogeneity. Cortical reconstruction and volumetric segmentation were performed by using the Freesurfer image analysis suite, version 4.3 (Athinoula A. Martinos Center for Biomedical Imaging, Boston, Mass, http://surfer.nmr.mgh.harvard.edu/) (16,17). Briefly, this software performs motion correction, skull stripping, and signal intensity normalization. A probabilistic atlas derived from a training set of 40 adult non-ADNI participants is then used to assign a neuroanatomic label to each voxel by using a Bayesian classification rule (Fig 1). The resulting segmentation maps were visually rated for accuracy by two authors (D. Truran-Sacrey, S.R., 15 and 5 years of experience, respectively) on the basis of their neuroanatomic knowledge. To avoid manual editing of the data, which could have introduced bias into the analyses, subjects were excluded from the analysis if the segmentation failed in this quality control step.
Figure 1a:

Automated segmentation of 15 temporal and parietal volumes of interest on (a) axial, (b) coronal, and (c) sagittal MR images, performed by Freesurfer software.
Figure 1b:

Automated segmentation of 15 temporal and parietal volumes of interest on (a) axial, (b) coronal, and (c) sagittal MR images, performed by Freesurfer software.
Figure 1c:

Automated segmentation of 15 temporal and parietal volumes of interest on (a) axial, (b) coronal, and (c) sagittal MR images, performed by Freesurfer software.
Definition of Memory Decline
The earliest clinical manifestation of AD is a deficit in delayed verbal memory (18). Because impaired delayed verbal memory is also predictive of the time to progression from normal cognitive function to MCI (19), it was selected as the outcome of interest. We used two memory scores: the subscore of the Rey Auditory Verbal Learning Test-Delayed Recall (AVLT-D) (20) and the delayed paragraph recall subscore of the Logical Memory II subscale (ie, revised Wechsler memory scale) test (14). For the AVLT-D, subjects are given a list of 15 unrelated words and asked to repeat the list after 30 minutes. For the revised Wechsler memory scale test, subjects are told a story and asked to repeat the story after 30 minutes. A z score for each subject’s 2-year change in performance on each test was calculated by subtracting the subject’s change score from the cohort mean score and dividing this difference by the standard deviation. The two z scores for each test were averaged to derive a composite memory score for each subject. We were interested in clinically important memory decline, which was defined as at least 1 standard deviation below the mean memory score. This resulted in 25 decliners and 124 nondecliners being in our cohort (Table 1). The composite memory score was regressed against age and education, and no association was found. As such, these demographic variables were not included in the models. There was a higher proportion of women in the decliner group. However, including this demographic variable in the models did not improve the predictive accuracy.
Selection of Brain Regions
Based on a priori knowledge that AD affects primarily the temporal and parietal lobes, with sparing of the sensorimotor and frontal lobes until late in the disease (2–5,10,21,22), the following 15 regions were selected as candidates for possible inclusion in the model: entorhinal cortex, hippocampus, parahippocampal gyrus, amygdala, superior temporal gyrus, middle temporal gyrus, inferior temporal gyrus, fusiform gyrus, banks of the superior temporal sulcus, temporal pole, posterior cingulate gyrus, isthmus cingulate, superior parietal lobe, inferior parietal lobe, and precuneus (Fig 1). In these analyses, the bilateral regions were averaged to restrict the number of variables included in the model.
These regions were adjusted for intracranial volume by using the covariance method (23) with the equation Va = Vua − G · (Vsic − Vmic), where Va is the adjusted volume, Vua is the unadjusted volume, G is the gradient, Vsic is the subject intracranial volume, and Vmic is the mean intracranial volume for all control subjects. The variable gradient was derived by regressing the unadjusted volumes against the intracranial volumes across all subjects. Intracranial volumes were obtained from a previously validated approach by using the atlas scaling factor in the Freesurfer program (24).
Statistical Analyses
An iterative program in R, version 2.9.2 (http://www.r-project.org/), software for statistical computing, which was coded by a statistician (P.S.I.), was used to derive the models that would enable the most accurate prediction of memory decline. On the basis of a best-subsets procedure, models that included all combinations of between two and nine brain regions were considered and compared in terms of predictive accuracy (25). In addition, pairwise interactions were included in the models to determine whether having smaller volumes in two temporoparietal regions simultaneously would yield an even more accurate prediction of memory decline than would the additive effect of using the two regions alone. The model search was restricted to the number of brain regions and pairwise interactions that were supportable by the data, which was not to exceed a total of 20 terms, to maintain a full rank correlation matrix, given the number of subjects. The R program reported the 25 most accurate models for each number of brain regions included. The pairwise interactions with the highest frequency in these 25 models were included in subsequent models that included more brain regions. Accuracy was determined according to the area under the receiver operating characteristic curve to illustrate the continuum of possible sensitivities and specificities (26). Model accuracy was further assessed by means of leave-one-out cross validation (25). With use of this method, all subjects except one are used as the training set for the model and the prediction error is assessed for the excluded subject (ie, the test set). This accuracy determination is performed with each subject in the cohort to estimate the overall cross-validated accuracy of the model. Ninety-five percent confidence intervals for the cross-validated accuracy estimates were obtained with 1000 bootstrap samples (25). With this method, model accuracy was assessed in subject samples drawn from the original cohort of subjects. This procedure was performed 1000 times to provide a confidence interval for the accuracy of each model.
Results
The baseline characteristics are summarized in Table 1. The decliner and nondecliner groups did not differ significantly in terms of age or years of education. The decliner group scored marginally higher on the baseline AVLT-D and had proportionately more women, although including sex in the models did not improve the predictive accuracy. Baseline volumetric differences in the 15 candidate regions are shown in Table 2.
Table 2.
Baseline Volumes in 15 Candidate Temporoparietal Regions
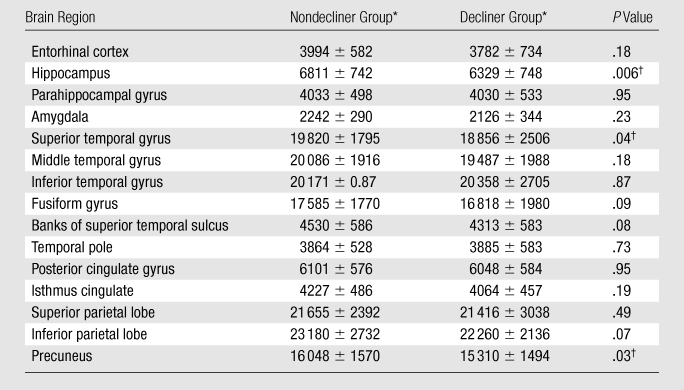
Data are mean baseline volumes (in cubic millimeters) ± standard deviations.
Difference between nondecliners and decliners was significant.
As the number of brain regions included in the model increased, the predictive accuracy of the classification model also increased (Table 3, Fig 2). Furthermore, the progression of regions that were selected for inclusion in the model was similar to the progression of the pathologic stage of AD (2,21). For example, the first two regions selected were the hippocampus and the parahippocampal gyrus. Models including three to six regions consisted predominantly of temporal lobe regions, and the seven-, eight-, and nine-region models included more than one parietal lobe region. The fusiform gyrus, banks of the superior temporal sulcus, temporal pole, and precuneus were not selected in any of the models.
Table 3.
Models Predicting Subsequent Memory Decline
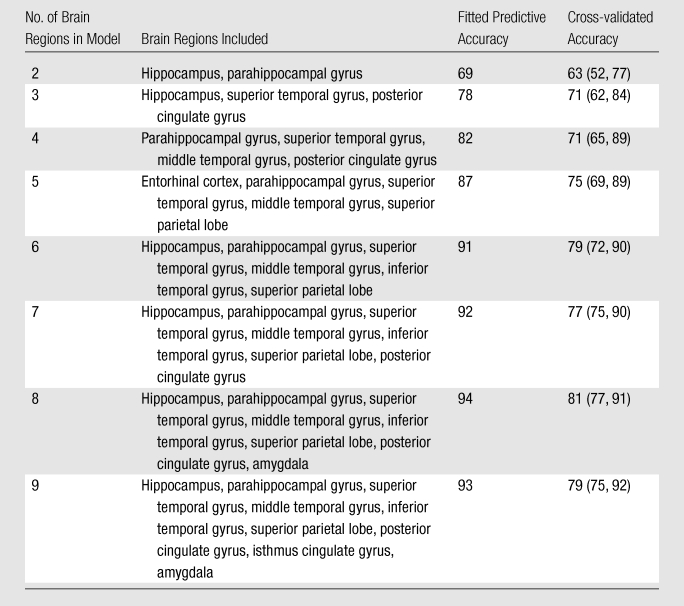
Note.—Fitted predictive and cross-validated accuracy values are percentages, with 95% confidence intervals in parentheses.
Figure 2:

Receiver operating characteristic curves for classification models show greater accuracy with inclusion of more brain regions.
The six-, seven-, eight-, and nine-region models demonstrated the highest fitted accuracy, 91%–94%, with cross-validated accuracies of 77%–81%. We determined that the most accurate model was the eight-region model, which included the hippocampus; parahippocampal gyrus; amygdala; superior, middle, and inferior temporal gyri; superior parietal lobe; and posterior cingulate gyrus. Pairwise interaction terms contributed significantly to the model: The eight-region model without interactions had a cross-validated accuracy of 58% (95% confidence interval: 49%, 81%) compared with a cross-validated accuracy of 81% with interactions (95% confidence interval: 77%, 91%).
Discussion
Our results demonstrate that automated MR-derived brain volumes facilitate accurate prediction of future memory decline in cognitively healthy elderly individuals. The regions that facilitated the best differentiation of cognitively healthy subjects included those known to be affected by AD reported in the literature.
Investigators in previous studies have used MR imaging–derived brain volumes to differentiate the clinical stages of AD. Models that differentiate between normal cognition and mild cognitive impairment (MCI) have reported accuracies of 85%–95%, whereas models that differentiate between normal cognition and AD have reported accuracies of 91%–100% (2–4). The more challenging task of differentiating among individuals at the same cognitive stage yields lower accuracies. Two previous studies involving the differentiation between individuals with MCI progressing to AD and those remaining cognitively stable yielded reported accuracies of 73%–75% (4,5). Thus, the cross-validated accuracy of 81% for differentiating between healthy individuals with and those without memory decline reported in our study appears to be consistent with data in the literature. Another potential strength of our model relative to those in previous studies involving cognitively healthy individuals (7–9) is the incorporation of regions beyond the temporal lobe. This may result in increased specificity because temporal lobe atrophy is also seen with schizophrenia, alcoholism, and other forms of dementia (27–29). Thus, our model may have more accuracy when it is used in a community with a broader range of structural abnormalities.
The inclusion of the hippocampus, parahippocampal gyrus, and amygdala in our most accurate model was anticipated. Pathology studies have shown that mesial-temporal lobe structures, which make up the limbic network, are affected the earliest in the disease course (10,30,31). To our knowledge, the contribution of other temporal and parietal lobe volumes to the differentiation of cognitively healthy individuals, although consistent with our understanding of AD, has not been previously emphasized in the literature. The posterior cingulate gyrus has been shown in functional MR imaging studies to be involved in memory retrieval (32). The decreased glucose metabolism in the posterior cingulate gyrus observed in positron emission tomography studies also suggests early involvement of the posterior cingulate gyrus in AD (33). Furthermore, in two recent articles, investigators report that posterior cingulate atrophy can be seen early in the course of AD and correlates with the degree of temporal lobe atrophy (34,35). In a third article, it is reported that even cognitively healthy individuals with high levels of cerebral amyloid demonstrate smaller posterior cingulate volumes (36). The superior parietal lobe is an early site for amyloid deposition and glucose hypometabolism (37,38). Finally, numerous connections between the temporal association cortex and the hippocampus may render volumetric differences predictive (39–41).
An unexpected finding was that pairwise interactions significantly improved predictive accuracy. Prior studies have been focused on the additive effects of brain regions (2–5,7–9). The pairwise interaction terms account for simultaneous volume variations across separate brain regions. The results imply that the effect of multiple regions of brain atrophy on memory is greater than the additive effect of each region alone. Therefore, given the connectivity of the brain, the finding that these interaction terms significantly improved the predictions makes intuitive sense. Further work to analyze these interactions is required.
The precuneus, fusiform gyrus, temporal pole, and banks of the superior temporal sulcus were not selected for any of the models in this study, despite some reports that describe their vulnerability to AD (30,40,41). This could reflect methodologic differences, such as our use of a region-of-interest approach rather than voxel-based morphometry, as well as the automated rather than manual delineation of structures. We find it interesting that although the precuneus had a significantly smaller volume among the decliners at baseline, it was not included among the most predictive models. This suggests that precuneus volumes may be less useful when more predictive temporal lobe regions are already included in the model.
Last, the finding that brain volume differences are predictive of future memory decline supports the concept of preclinical AD. As described in the Materials and Methods, with use of our definition of memory decline, 17% (25 of 149) of the participants were designated as decliners. This proportion is consistent with the 11%–49% of cognitively healthy individuals found postmortem to meet the neuropathologic criteria for AD in previous studies (42,43). We hypothesize that the decliners in our cohort may have had greater underlying AD-related abnormalities compared with the nondecliners, resulting in volumetric differences and subsequent memory decline. Furthermore, the decliners had marginally higher baseline memory scores, suggesting that volumetric differences may be more predictive of and precede clinical memory decline.
There were several limitations to our study. First, the ADNI was intended to mimic a clinical trial, so the follow-up period of 2 years is relatively short. Additional follow-up is required to determine whether the cognitive statuses of the decliners in our study actually progress to MCI. The participants also had fewer comorbidities than are expected for the general population (11). Second, at the participating sites, extensive efforts were made to standardize images across the different MR imaging units used (15); however, this would be difficult to accomplish in clinical practice. Last, this was an exploratory analysis in which we used a priori knowledge to restrict our analyses to 15 brain regions and combinations of these regions. We could not have searched exhaustively for combinations of all possible cortical and subcortical regions without overstretching the prediction model. Recently, investigators in some studies attempted to circumvent these restrictions by exploring the use of model-free classification algorithms, such as those involving support vector machines (44–46). More studies are warranted to determine the potential benefits of other statistical approaches for accurate classification.
In conclusion, our study results demonstrate that automated temporal and parietal volume measurements from a single baseline MR examination facilitate accurate identification of cognitively healthy individuals who are at risk for future memory decline. The ability to identify high-risk cognitively healthy individuals may be useful in targeting individuals for preventative therapy and for enriching trials to maximize power, and it represents another step toward integrating imaging into the diagnosis and management of AD. The validation of our predictive model in a new population is required in further research.
Advances in Knowledge.
Elderly individuals may exhibit brain volume differences that are suggestive of future memory decline, even before there is clinical evidence of memory impairment.
Regional brain volumes in the memory network enable with high accuracy the differentiation between cognitively healthy individuals with and those without risk of subsequent memory decline.
Implication for Patient Care.
MR imaging–derived brain volumes may enable the identification of cognitively healthy individuals who are at risk for future memory decline, for clinical trials and potential preventative therapies.
Disclosures of Potential Conflicts of Interest: G.C.C. No potential conflicts of interest to disclose. P.S.I. No potential conflicts of interest to disclose. D. Tosun. No potential conflicts of interest to disclose. N.S. No potential conflicts of interest to disclose. D. Truran-Sacrey. No potential conflicts of interest to disclose. S.R. No potential conflicts of interest to disclose. C.R.J. Financial activities related to the present article: none to disclose. Financial activities not related to the present article: is a consultant for Eisai, Eli Lilly, Janssen, and Elan Pharmaceuticals. Other relationships: none to disclose. M.W.W. Financial activities related to the present article: none to disclose. Financial activities not related to the present article: is a board member of Bayer Schering, Eli Lilly, Nestle, CoMentis, Neurochem, Eisai, Avid, Aegis, Genentech, Allergan, Lippincott, Bristol Meyers Squibb, Forest, Pfizer, McKinsey, Mitsubishi, and Novartis; received grants or grants are pending from Merck & Company and Avid; received royalties from Rotman Research Institute and BOLT International; holds stock in Synarc and Elan Pharmaceuticals.
Acknowledgments
We thank Pouria Mojabi, MS, for his extensive help in executing the computationally intensive automated model search. Data collection and sharing for this project were funded by ADNI (National Institutes of Health grant U01 AG024904). ADNI is funded by the National Institute on Aging, the National Institute of Biomedical Imaging and Bioengineering, and through generous contributions from the following: Abbott, AstraZeneca, Bayer Schering Pharma, Bristol-Myers Squibb, Eisai Global Clinical Development, Elan Corporation, Genentech, GE Healthcare, GlaxoSmithKline, Innogenetics, Johnson and Johnson, Eli Lilly and Company, Medpace, Merck and Company, Novartis, Pfizer, F. Hoffman-La Roche, Schering-Plough, Synarc, Wyeth, and nonprofit partners the Alzheimer’s Association and the Alzheimer’s Drug Discovery Foundation, with participation from the U.S. Food and Drug Administration. Private sector contributions to ADNI are facilitated by the Foundation for the National Institutes of Health (http://www.fnih.org/). The grantee organization is the Northern California Institute for Research and Education, and the study is coordinated by the Alzheimer’s Disease Cooperative Study at the University of California, San Diego. ADNI data are disseminated by the Laboratory for Neuro Imaging at the University of California, Los Angeles. This research was also supported by NIH grants P30 AG010129 and K01 AG030514 and the Dana Foundation.
Received September 2, 2010; revision requested October 29; revision received January 24, 2011; accepted February 2; final version accepted February 3.
The data used in the preparation of this article were obtained from the Alzheimer’s Disease Neuroimaging Initiative (ADNI) database (http://www.loni.ucla.edu/ADNI). As such, the investigators in ADNI contributed to the design and implementation of ADNI and/or provided data but did not participate in the analysis of data in or the writing of this report. A complete list of the ADNI investigators is available at http://adni.loni.ucla.edu/wp-content/uploads/how_to_apply/ADNI_Authorship_List.pdf.
Funding: This research was supported by the National Institutes of Health/National Institute of Biomedical Imaging and Bioengineering (grants T32 EB001631-05, P41 RR023953, U01 AG024904, P30 AG010129, K01 AG030514).
See also the article by McEvoy et al in this issue.
Abbreviations:
- AD
- Alzheimer disease
- ADNI
- Alzheimer’s Disease Neuroimaging Initiative
- AVLT-D
- Rey Auditory Verbal Learning Test-Delayed Recall
- MCI
- mild cognitive impairment
References
- 1.Ferri CP, Prince M, Brayne C, et al. Global prevalence of dementia: a Delphi consensus study. Lancet 2005;366(9503):2112–2117 [DOI] [PMC free article] [PubMed] [Google Scholar]
- 2.McEvoy LK, Fennema-Notestine C, Roddey JC, et al. Alzheimer disease: quantitative structural neuroimaging for detection and prediction of clinical and structural changes in mild cognitive impairment. Radiology 2009;251(1):195–205 [DOI] [PMC free article] [PubMed] [Google Scholar]
- 3.Desikan RS, Cabral HJ, Hess CP, et al. Automated MRI measures identify individuals with mild cognitive impairment and Alzheimer’s disease. Brain 2009;132(Pt 8):2048–2057 [DOI] [PMC free article] [PubMed] [Google Scholar]
- 4.Killiany RJ, Gomez-Isla T, Moss M, et al. Use of structural magnetic resonance imaging to predict who will get Alzheimer’s disease. Ann Neurol 2000;47(4):430–439 [PubMed] [Google Scholar]
- 5.Bakkour A, Morris JC, Dickerson BC. The cortical signature of prodromal AD: regional thinning predicts mild AD dementia. Neurology 2009;72(12):1048–1055 [DOI] [PMC free article] [PubMed] [Google Scholar]
- 6.Petersen RC. Mild cognitive impairment clinical trials. Nat Rev Drug Discov 2003;2(8):646–653 [DOI] [PubMed] [Google Scholar]
- 7.Jagust W, Gitcho A, Sun F, Kuczynski B, Mungas D, Haan M. Brain imaging evidence of preclinical Alzheimer’s disease in normal aging. Ann Neurol 2006;59(4):673–681 [DOI] [PubMed] [Google Scholar]
- 8.Rusinek H, De Santi S, Frid D, et al. Regional brain atrophy rate predicts future cognitive decline: 6-year longitudinal MR imaging study of normal aging. Radiology 2003;229(3):691–696 [DOI] [PubMed] [Google Scholar]
- 9.den Heijer T, Geerlings MI, Hoebeek FE, Hofman A, Koudstaal PJ, Breteler MM. Use of hippocampal and amygdalar volumes on magnetic resonance imaging to predict dementia in cognitively intact elderly people. Arch Gen Psychiatry 2006;63(1):57–62 [DOI] [PubMed] [Google Scholar]
- 10.Braak H, Braak E. Neuropathological stageing of Alzheimer-related changes. Acta Neuropathol (Berl) 1991;82(4):239–259 [DOI] [PubMed] [Google Scholar]
- 11.Petersen RC, Aisen PS, Beckett LA, et al. Alzheimer’s Disease Neuroimaging Initiative (ADNI): clinical characterization. Neurology 2010;74(3):201–209 [DOI] [PMC free article] [PubMed] [Google Scholar]
- 12.Folstein MF, Folstein SE, McHugh PR. “Mini-mental state”: a practical method for grading the cognitive state of patients for the clinician. J Psychiatr Res 1975;12(3):189–198 [DOI] [PubMed] [Google Scholar]
- 13.Morris JC. The clinical dementia rating (CDR): current version and scoring rules. Neurology 1993;43(11):2412–2414 [DOI] [PubMed] [Google Scholar]
- 14.Wechsler D. Wms-R Weschsler memory scale: revised manual New York, NY: The Psychological Corporation/Harcourt Brace Jovanovich, 1987 [Google Scholar]
- 15.Jack CR, Jr, Bernstein MA, Fox NC, et al. The Alzheimer’s Disease Neuroimaging Initiative (ADNI): MRI methods. J Magn Reson Imaging 2008;27(4):685–691 [DOI] [PMC free article] [PubMed] [Google Scholar]
- 16.Fischl B, Salat DH, Busa E, et al. Whole brain segmentation: automated labeling of neuroanatomical structures in the human brain. Neuron 2002;33(3):341–355 [DOI] [PubMed] [Google Scholar]
- 17.Fischl B, Salat DH, van der Kouwe AJ, et al. Sequence-independent segmentation of magnetic resonance images. Neuroimage 2004;23(Suppl 1):S69–S84 [DOI] [PubMed] [Google Scholar]
- 18.Lezak MD, Howieson D, Loring D. Neuropsychological assessment 4th ed. Oxford, England: Oxford University Press, 2004; 207–215 [Google Scholar]
- 19.Blacker D, Lee H, Muzikansky A, et al. Neuropsychological measures in normal individuals that predict subsequent cognitive decline. Arch Neurol 2007;64(6):862–871 [DOI] [PubMed] [Google Scholar]
- 20.Rey A. L’examen clinique en psychologie Paris, France: Presses Universitaires de France, 1964 [Google Scholar]
- 21.Brun A, Englund E. Regional pattern of degeneration in Alzheimer’s disease: neuronal loss and histopathological grading. Histopathology 1981;5(5):549–564 [DOI] [PubMed] [Google Scholar]
- 22.Baron JC, Chételat G, Desgranges B, et al. In vivo mapping of gray matter loss with voxel-based morphometry in mild Alzheimer’s disease. Neuroimage 2001;14(2):298–309 [DOI] [PubMed] [Google Scholar]
- 23.Jack CR, Jr, Twomey CK, Zinsmeister AR, Sharbrough FW, Petersen RC, Cascino GD. Anterior temporal lobes and hippocampal formations: normative volumetric measurements from MR images in young adults. Radiology 1989;172(2):549–554 [DOI] [PubMed] [Google Scholar]
- 24.Buckner RL, Head D, Parker J, et al. A unified approach for morphometric and functional data analysis in young, old, and demented adults using automated atlas-based head size normalization: reliability and validation against manual measurement of total intracranial volume. Neuroimage 2004;23(2):724–738 [DOI] [PubMed] [Google Scholar]
- 25.Vittinghoff E, Shiboski S, Glidden D, McCulloch CE. Regression methods in biostatistics: linear, logistic, survival, and repeated measures models New York, NY: Springer, 2005; 62–:138–139. [Google Scholar]
- 26.Hanley JA, McNeil BJ. The meaning and use of the area under a receiver operating characteristic (ROC) curve. Radiology 1982;143(1):29–36 [DOI] [PubMed] [Google Scholar]
- 27.Wright IC, Rabe-Hesketh S, Woodruff PW, David AS, Murray RM, Bullmore ET. Meta-analysis of regional brain volumes in schizophrenia. Am J Psychiatry 2000;157(1):16–25 [DOI] [PubMed] [Google Scholar]
- 28.Agartz I, Momenan R, Rawlings RR, Kerich MJ, Hommer DW. Hippocampal volume in patients with alcohol dependence. Arch Gen Psychiatry 1999;56(4):356–363 [DOI] [PubMed] [Google Scholar]
- 29.van de Pol LA, Hensel A, van der Flier WM, et al. Hippocampal atrophy on MRI in frontotemporal lobar degeneration and Alzheimer’s disease. J Neurol Neurosurg Psychiatry 2006;77(4):439–442 [DOI] [PMC free article] [PubMed] [Google Scholar]
- 30.Hyman BT, Van Hoesen GW, Damasio AR, Barnes CL. Alzheimer’s disease: cell-specific pathology isolates the hippocampal formation. Science 1984;225(4667):1168–1170 [DOI] [PubMed] [Google Scholar]
- 31.Callen DJ, Black SE, Gao F, Caldwell CB, Szalai JP. Beyond the hippocampus: MRI volumetry confirms widespread limbic atrophy in AD. Neurology 2001;57(9):1669–1674 [DOI] [PubMed] [Google Scholar]
- 32.Maddock RJ, Garrett AS, Buonocore MH. Remembering familiar people: the posterior cingulate cortex and autobiographical memory retrieval. Neuroscience 2001;104(3):667–676 [DOI] [PubMed] [Google Scholar]
- 33.Mosconi L. Brain glucose metabolism in the early and specific diagnosis of Alzheimer’s disease: FDG-PET studies in MCI and AD. Eur J Nucl Med Mol Imaging 2005;32(4):486–510 [DOI] [PubMed] [Google Scholar]
- 34.Choo IH, Lee DY, Oh JS, et al. Posterior cingulate cortex atrophy and regional cingulum disruption in mild cognitive impairment and Alzheimer’s disease. Neurobiol Aging 2010;31(5):772–779 [DOI] [PubMed] [Google Scholar]
- 35.Pengas G, Hodges JR, Watson P, Nestor PJ. Focal posterior cingulate atrophy in incipient Alzheimer’s disease. Neurobiol Aging 2010;31(1):25–33 [DOI] [PubMed] [Google Scholar]
- 36.Oh H, Mormino EC, Madison C, Hayenga A, Smiljic A, Jagust WJ. β-Amyloid affects frontal and posterior brain networks in normal aging. Neuroimage 2011;54(3):1887–1895 [DOI] [PMC free article] [PubMed] [Google Scholar]
- 37.Cabeza R, Ciaramelli E, Olson IR, Moscovitch M. The parietal cortex and episodic memory: an attentional account. Nat Rev Neurosci 2008;9(8):613–625 [DOI] [PMC free article] [PubMed] [Google Scholar]
- 38.Devanand DP, Mikhno A, Pelton GH, et al. Pittsburgh compound B (11C-PIB) and fluorodeoxyglucose (18 F-FDG) PET in patients with Alzheimer disease, mild cognitive impairment, and healthy controls. J Geriatr Psychiatry Neurol 2010;23(3):185–198 [DOI] [PMC free article] [PubMed] [Google Scholar]
- 39.Detoledo-Morrell L, Sullivan MP, Morrell F, Wilson RS, Bennett DA, Spencer S. Alzheimer’s disease: in vivo detection of differential vulnerability of brain regions. Neurobiol Aging 1997;18(5):463–468 [DOI] [PubMed] [Google Scholar]
- 40.Convit A, de Asis J, de Leon MJ, Tarshish CY, De Santi S, Rusinek H. Atrophy of the medial occipitotemporal, inferior, and middle temporal gyri in non-demented elderly predict decline to Alzheimer’s disease. Neurobiol Aging 2000;21(1):19–26 [DOI] [PubMed] [Google Scholar]
- 41.Whitwell JL, Shiung MM, Przybelski SA, et al. MRI patterns of atrophy associated with progression to AD in amnestic mild cognitive impairment. Neurology 2008;70(7):512–520 [DOI] [PMC free article] [PubMed] [Google Scholar]
- 42.Bennett DA, Schneider JA, Arvanitakis Z, et al. Neuropathology of older persons without cognitive impairment from two community-based studies. Neurology 2006;66(12):1837–1844 [DOI] [PubMed] [Google Scholar]
- 43.Schmitt FA, Davis DG, Wekstein DR, Smith CD, Ashford JW, Markesbery WR. “Preclinical” AD revisited: neuropathology of cognitively normal older adults. Neurology 2000;55(3):370–376 [DOI] [PubMed] [Google Scholar]
- 44.Stonnington CM, Chu C, Klöppel S, et al. Predicting clinical scores from magnetic resonance scans in Alzheimer’s disease. Neuroimage 2010;51(4):1405–1413 [DOI] [PMC free article] [PubMed] [Google Scholar]
- 45.Chen R, Herskovits EH. Machine-learning techniques for building a diagnostic model for very mild dementia. Neuroimage 2010;52(1):234–244 [DOI] [PMC free article] [PubMed] [Google Scholar]
- 46.Vemuri P, Gunter JL, Senjem ML, et al. Alzheimer’s disease diagnosis in individual subjects using structural MR images: validation studies. Neuroimage 2008;39(3):1186–1197 [DOI] [PMC free article] [PubMed] [Google Scholar]