

Abstract
Ischemia/reperfusion (I/R) injury was induced in primary porcine cardiomyocytes in a low-shear microfluidic culture chip. The chip was capable of sustaining cardiomyocyte culture and inducing I/R injury by subjecting the cells to periods of hypoxia lasting 3-4 hours followed by normoxia. Mitochondrial membrane potential was assayed using MitoTracker Red to follow mitochondrial depolarization, the earliest stage of apoptosis. Cell adhesion and morphology were also determined simultaneously with fluorescence measurements. Changes in membrane potential were observed earlier than previously reported, with mitochondria becoming depolarized as early as 2 hours into the ischemia period. The cells with depolarized mitochondria were deemed apoptotic. Out of 38-61 cells per time frame, the fraction of apoptotic cells was found to be similar to control samples (3%) at two hours of ischemia, which increased up to 22% at the end of ischemia period as compared to 0% in the control samples. Morphological analysis of cells showed that 4 hours of ischemia followed by reperfusion produced blebbing cells within 2 hours of restoring oxygen to the chip. This approach is a versatile method for cardiomyocyte stress, and in future work additional analytical probes can be incorporated for a multi-analyte assays of cardiomyocyte apoptosis.
1. Introduction
Heart disease is the most common cause of mortality in the United States. Ischemia and reperfusion (I/R) injury has been recognized for years as a major contributor to complications from heart disease. Ischemia lasts from the seconds to hours timescale in cases such as angina and surgery. In the case of long term ischemia, the condition can persist for years. Ischemia and reperfusion injury results in widespread apoptosis in cardiomyocytes, resulting in damage to the heart and contributing to heart disease (1). Loss of cardiomyocytes from long-term, low-grade hypoxia, glucose deficiency, and oxidative stress play a role in ventricular hypertrophy (2), a sign of heart failure. While long-term ischemia leads to necrosis in the myocardium, it is reperfusion that results in apoptotic cell loss (3).
Long-term apoptotic loss of myocytes in the ventricles of the heart is a key indicator of heart disease (4-6). It has been shown that arresting apoptosis improves the prognosis of heart attack patients (7). However, treating long-term cardiac muscle loss due to cardiomyocytes apoptosis may be more effective in preventing heart disease. While apoptosis is prevalent in many aspects of heart disease, injury due to ischemia (hypoxia) and subsequent reperfusion (reoxygenation) is known to induce apoptosis on a large scale in cardiomyocytes. Apoptotic cardiomyocytes are typically found at higher levels in reperfused rather than ischemic tissue, and the mechanism for this difference is not well understood (8). Blocking apoptosis after reperfusion has been shown to improve cardiac function (9-10). However, oxidative stress and the restoration of ATP-dependent apoptosis (11) have both been attributed to reperfusion. The mitochondrial apoptotic pathway is the primary mechanism of cell loss in ischemia/reperfusion injury. This pathway is susceptible to both hypoxia caused by ischemia and oxidative stress caused by reperfusion. There is, therefore, a need to understand the mechanism of apoptosis in ischemia/reperfusion injury, particularly the role of oxygen restoration. In addition to controlling the rate of reperfusion, steps must also be taken to reduce the buildup of free cytochrome c in the cytosol in order to effectively treat ischemia/reperfusion injury. Our group has developed several analytical tools (12-15) to study apoptosis in the cellular microenvironment, integrating both microfluidic and spectroscopic techniques.
In recent years, there has been a remarkable advance in the field of microfluidic devices. Microfluidic devices have the potential for cellular analysis as they provide an automated and controlled platform for cell culture and analysis within a single device. Microfluidic devices have been used for investigation of in vivo processes under haemodynamic conditions (16). They have been used to mimic in vivo processes like communication between different cell types by mimicking the blood brain barrier (17), or to study the response of cardiac cells to mechanical stress by mimicking the native heart (18).
Many studies of myocardial apoptosis have been performed using animal models of ischemia (19). However, increasing numbers of researchers have used cultured cardiomyocytes as models for heart disease. In addition, microfluidic cell systems have been viewed with increasing interest, as cell culture can be integrated with chemical analysis (20). To date, most microfluidic devices for apoptosis have either demonstrated on-chip flow cytometry (21), the detection of caspase activity outside of cells (22), or electrophoretic separation of apoptotic cell organelles or analytes (23-24). In other devices where cells were used, traps of various geometries have been employed to monitor apoptosis induction by fluorescence imaging (25-27). These approaches either analyze cell components or culture cells with a single analytical measurement performed on-chip. Microfluidic systems have also been used with cardiomyocytes (28-30) for localized sampling and electroporation, and also for physical stimulation of contractile movement (31) and the culture of cardiac tissue.
Ischemia/reperfusion injury has been produced in vivo (19) as well as in air-tight chambers for cultured primary cells (32). Cell culture devices with an integrated system of oxygen sensing have also been developed [33-34]. These devices utilize oxygen sensitive dyes to provide spatial and temporal control over oxygen concentration. We now report on a low-shear microfluidic system, with integrated oxygen sensing system based on fluorescence quenching of ruthenium-based dye, to induce I/R injury in primary cardiomyocytes and monitor the cell sample for apoptosis. Cells were subjected to ischemia conditions, followed by reperfusion to normal oxygen levels. Apoptosis was followed by monitoring mitochondrial membrane potential with a fluorescent probe and fluorescence microscopy. These findings show that primary porcine cardiomyocytes are susceptible to apoptosis after only short periods of ischemia followed by sudden reperfusion. In addition, mitochondrial membrane potential is lost early in ischemia conditions, supporting the hypothesis that while reactive oxygen species play a role in apoptosis, key elements in the apoptotic process are already set in motion during ischemia.
2. Materials and Methods
Cardiomyocyte Isolation and Culture
Animals harvested for commercial use were handled at the Texas Tech Animal and Food Sciences Meat Laboratory, as per standard USDA guidelines. Hearts from the harvested pigs were removed and placed in a beaker containing 500 mL PBS and antibiotics. Digestion media was prepared previously by mixing 40 mL Earle's Balanced Salt Solution (EBSS), 0.06 g Collagenase Type II, 0.4 g Bovine Serum Albumin (BSA) and 1 dose of antibiotics. The prepared digestion media was placed in the water bath for 10 minutes and filtered through 0.2 μm filter into a flask. The hearts from the pigs were then excised using 4.5 inch mincing scissors (average down-time of the hearts was 25 minutes). The excised muscle tissue was placed in a Petri dish containing 10 mL of digestion media from the flask. The tissue was minced to a very fine consistency with the help of the scissors and placed back in the flask. The weight of the flask plus digestion medium was obtained before and after adding heart tissue in order to obtain the tissue weight. Collagenase digestion was then performed by placing the flask in a shaking water bath for 40 minutes at 20 rpm. The contents of the flask were then filtered into a sterile 50 mL centrifuge tube through a 200 μm nylon membrane-covered funnel. The tube was then centrifuged at 1000 rpm for 5 minutes. The tissue pellet was then resuspended in 20 mL of digestion media. Centrifugation was repeated again at 1000 rpm for 5 minutes and this time the pellet was resuspended in the culture medium (DMEM + 10% Fetal Bovine Serum (FBS) and antibiotics). The cell suspension was then placed into several matrigel coated 225 cm2 tissue culture flasks. The flasks were then placed in the incubator at 37°C and 5% CO2. The remaining cell suspension was placed in 4 mL of freezing medium and transferred to 4 cryovials. The cryovials were placed in an -80°C freezer overnight and transferred to a liquid nitrogen tank for future use.
Low-Shear Culture Chip Fabrication
Fabrication of the microfluidic device was performed by modifying the technique described by Liu et al. (12). Briefly, uncured polydimethylsiloxane (PDMS, Dow Sylgard 184) was prepared by mixing the pre-polymer and the cross-linking agent in a 10:1 ratio. The mixture was stirred and then degassed under vacuum for 30 minutes. Then the mixture was poured into a machined mold that was modified to include an injection port/loading channel that helped to inject the cells directly into the wells (Figure 1). The mold was then placed in an oven at 75°C for 20 minutes. The cured PDMS was then cut into pieces such that each piece consisted of a flow channel and a well. The pieces were then bonded with the glass slide by using an oxygen plasma system. After bonding the pieces together, tubing was connected to the chip on the outlet, inlet, and the injection port. For ischemia studies, two PDMS channels, each containing a low-shear channel, were bonded on the same glass slide so that the two pieces faced in opposite direction (Figure 1). This design helped to place the tubing for two separate pieces independently. One channel served as the culture well, while the second channel contained the oxygen-sensitive dye.
Figure 1.
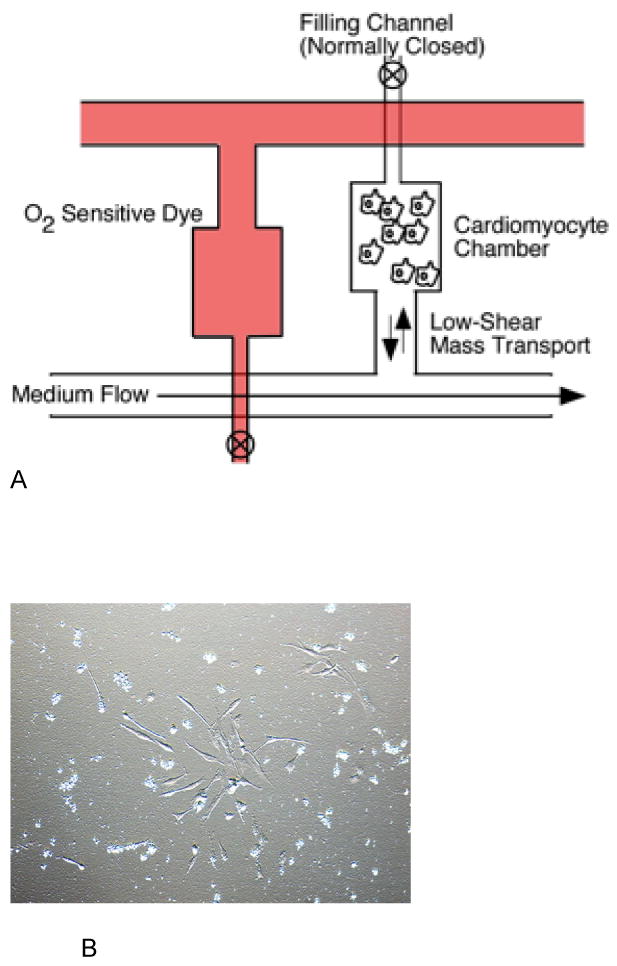
Schematic of the Cardiomyocyte Ischemia/Reperfusion Chip (A). The lower PDMS fluidic layer housed a culture chamber connected in a low-shear mass transport arrangement. Cells were loaded from a filling channel located at the distal end of the culture chamber. Medium flow in the main channel produced low-shear mass transport to the culture chamber. An identical upper PDMS layer was filled with O2-sensitive dye to monitor oxygen concentrations. Cardiomyocytes cultured on the chips under normoxia conditions had similar morphology to cells grown in culture flasks (B).
Cell Loading and On-Chip Culture
The primary cardiomyocytes, previously harvested from the animal, were maintained in matrigel coated flasks in an incubator at 37°C and 5% CO2. On the day of experiment, previously fabricated chips were coated with matrigel for an hour at room temperature. In some cases, the coated chips were placed inside the incubator overnight prior to use. Cells were then removed from the flask by trypsinization and stained with MitoTracker Red solution (1μM in PBS) for 30 minutes at room temperature. After washing once with PBS, the cells were resuspended in culture medium (DMEM + 10% FBS) and kept in the incubator until the device was ready for injection. The coated chips were connected to a syringe pump and the medium was flowed at the rate of 1mL/hr. Then, the cells were injected into the culture well via the cell loading channel, which was subsequently sealed off to ensure low-shear culture operation. The chip was placed inside the incubator to let the cells attach on the coated surface. For ischemia/reperfusion studies, cells were loaded and the ischemia process started after 1.5-2 hours.
Ischemia/Reperfusion Studies
For chips where ischemia/reperfusion injury was induced, the chip was placed inside a small polycarbonate box on the microscope stage. The bottom part of the box consisted of a rectangular opening through which the cells on the chip were imaged. The top part consisted of an inlet and outlet for nitrogen flow to displace oxygen and induce ischemia. This setup allowed for rapid and precise control of the oxygen content on the chip. Tris(4,7-diphenyl-1,10-phenanthroline) ruthenium(II) dichloride was used to monitor oxygen content in the chip. The ruthenium complex (250 μM in PBS) was injected into the upper layer of the chip (Figure 1) and fluorescence images of the well containing the dye were taken during the experiment to determine oxygen concentration (35). Oxygen measurements were calibrated using N2, Air, and O2 gases. For the control experiments, the chip was placed inside the incubator and imaged on certain time intervals.
Fluorescence Microscopy and Membrane Potential Measurements
MitoTracker Red (Invitrogen) was used to image membrane potential in cardiomyocytes. The loss of membrane potential as mitochondria depolarized resulted in release of MitoTracker Red (MTR) from the mitochondria and a subsequent decrease in fluorescence. Nuclei were stained with Hoechst 33342 (0.5 μg/mL) Cells were imaged on an inverted microscope (IX71, Olympus) with a 20×, 0.25 NA objective for white light and fluorescence images. A 100W Hg lamp (Olympus) and filters appropriate for MitoTracker Red were used for fluorescence excitation and collection. Images were acquired with a 16-bit CCD camera (Orca, Hamamatsu) and processed in NIH ImageJ software (National Institutes of Health). All final images are comprised of 5 averaged images. The exposure time was 3 ms and 75 ms for Hoechst and MitoTracker Red, respectively. The intensities of cells as a function of time were calculated. Cell intensities were measured for 30-70 cells per time frame. Mean intensity values are reported with +/- 1 standard deviation. Images are depicted in this paper without any enhancement.
3. Results and Discussion
Chip Operation
The culture chip was based on our previous low-shear designs for long-term culture (12). The chip (Figure 1) was able to culture cardiomyocytes for the experiment duration (8 hours maximum). Ischemia can be acute or long-term, in I/R studies, thus, the period of ischemia and reperfusion varies from several hours (36) to several days (37). In the current study, the ischemia and reperfusion lasted for few hours representing the acute ischemia that can occur during cardiac arrest or excessive oxygen demand. The morphology of cells cultured in control chips (under normoxia conditions) was similar to cells grown in flasks (Figure 1). Cardiomyocytes isolated from heart tissue of animals have been recognized as models for myocardium for years (38). While rat hearts are commonly used (39-40), porcine cardiomyocytes are closer in size to human cardiomyocytes. In addition, a single animal can provide multiple experiments worth of cardiomyocytes. Single cardiomyocytes have been used for some time as models for in vivo studies (41). In the low-shear chip, the entire experiment typically lasts less than 8 hours, and cardiomyocytes did not undergo apoptosis under normoxia conditions. The degree of cell adhesion on the matrigel surface does not affect cell function and viability, as cells attach fully after several hours of on-chip culture.
On-Chip Oxygen Measurements
Ischemia was induced by hypoxia conditions in the chip. Reperfusion injury was induced by rapidly restoring oxygen concentration. The second channel containing the oxygen sensing dye was used to monitor oxygen concentration during ischemia/reperfusion studies. This approach allowed for measurements of oxygen concentration without physical access required for electrodes. The oxygen permeability of PDMS is such that the difference between channels would be negligible for the duration of hypoxia (3-4 hours) in this study. The ratio of initial fluorescence (I0) to the fluorescence at any time point (I) was used to determine oxygen concentrations (See Supplementary Information). The oxygen concentration rapidly decreased to less than 1% (within 30 minutes) demonstrated by the increase in intensity of the oxygen sensing dye (Figure 8). Thus, the induction of ischemia and subsequent reperfusion was rapid given the timescales and duration of ischemia/reperfusion injury.
Figure 8.
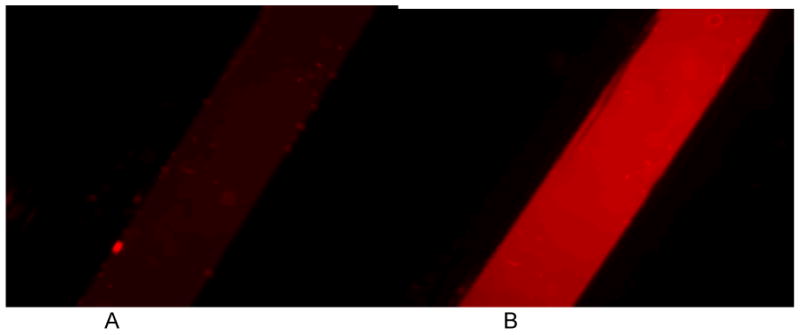
The oxygen measurement experiment showing the fluorescence images of ruthenium based oxygen sensitive dye (concentration = 250 uM) inside the chip at (A) 0 minutes and (B) 30 minutes of flowing nitrogen inside the hypoxia box.
Membrane Potential Measurements
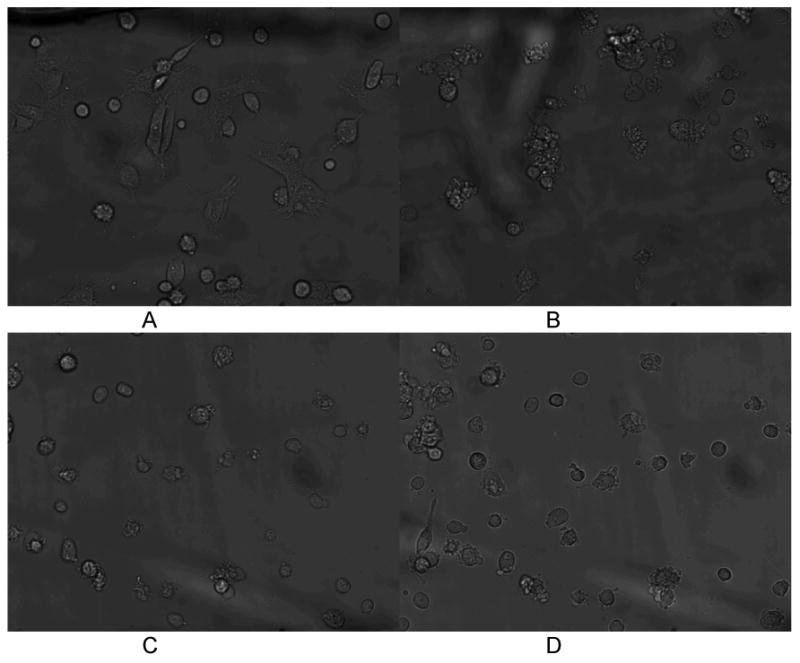
Control cells cultured on the chip, under normoxia conditions for the entire experiment, are shown in Figure 2. Cells were stained with 1 μM MitoTracker Red and Hoechst 33342 dyes. The Hoechst dye did not show significant photobleaching. The MitroTracker Red fluorescence was observed to decrease slightly but was still bright in control cells for the duration of all experiments. In cells cultured under hypoxia to induce ischemia, MitoTracker Red fluorescence decreased at a greater rate, significantly decreasing after two hours of hypoxia (Figure 3). MitoTracker Red fluorescence continued to decrease at three hours of hypoxia, and decreased further upon restoration of oxygen to the cells. Histograms of fluorescence intensity (Figure 4A-B) were used to determine cell fluorescence at each time point (three images total, 38-61 cells per time period, except for the 1 hour normoxia time point, in which only 9 cells were imaged). Cells falling below 200 intensity counts (for 1 μm MTR) were determined to be depolarized and therefore apoptotic by MTR fluorescence. This value was determined as a threshold based on control cell fluorescence measurements. Control cells in an chip incubated at 37oC and room temperature both showed similar fluorescence intensities for the experiment duration. For cells undergoing ischemia, 3% of cells were apoptotic at two hours compared to 0% in the control chips, which was not statistically different from the control. The number of apoptotic cells in the ischemia chip increased to 22% at three hours. An hour after normoxia was restored to simulate reperfusion, the apoptotic cell fraction was 11%. The fraction of apoptotic cells after ischemia and reperfusion were statistically different from each other and the control samples at the 95% confidence level. The reason for the decrease in cells with depolarized membranes after normoxia is not clear, but the small number of collected cells may impart a systematic error to this last time point. In addition, during later stage reperfusion some cells are too morphologically altered to obtain an accurate MTR intensity. These cells were omitted from the analysis. In the experiment in which hypoxia was induced for 5 hours, the fraction of apoptotic cells increased steadily until 5 hours and doubled after 1 hour of restoration of oxygen. These observations demonstrate that apoptosis is initiated in ischemia as well as reperfusion, but that reperfusion results in a larger apoptotic fraction, even with longer periods of ischemia preceding it.
Figure 2.
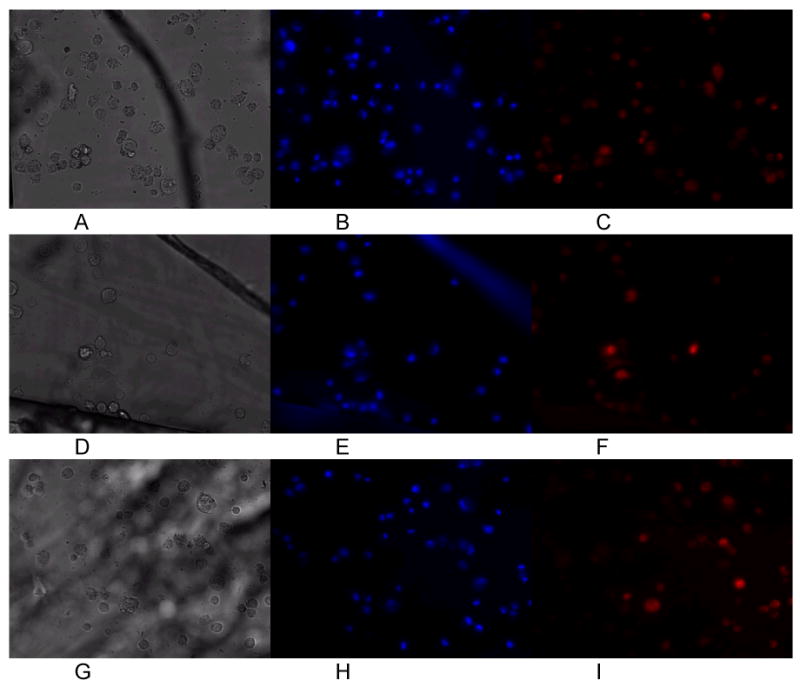
Control cardiomyocytes cultured at 0 hours (A-C), 1 hours (D-F), and 3 hours (G-I) in the chip. White light morphology (A,D,G), Hoechst (B,E,H) and MitoTracker Red (C.F.I) fluorescence did not change significantly during the course of culture (up to 6 hours).
Figure 3.
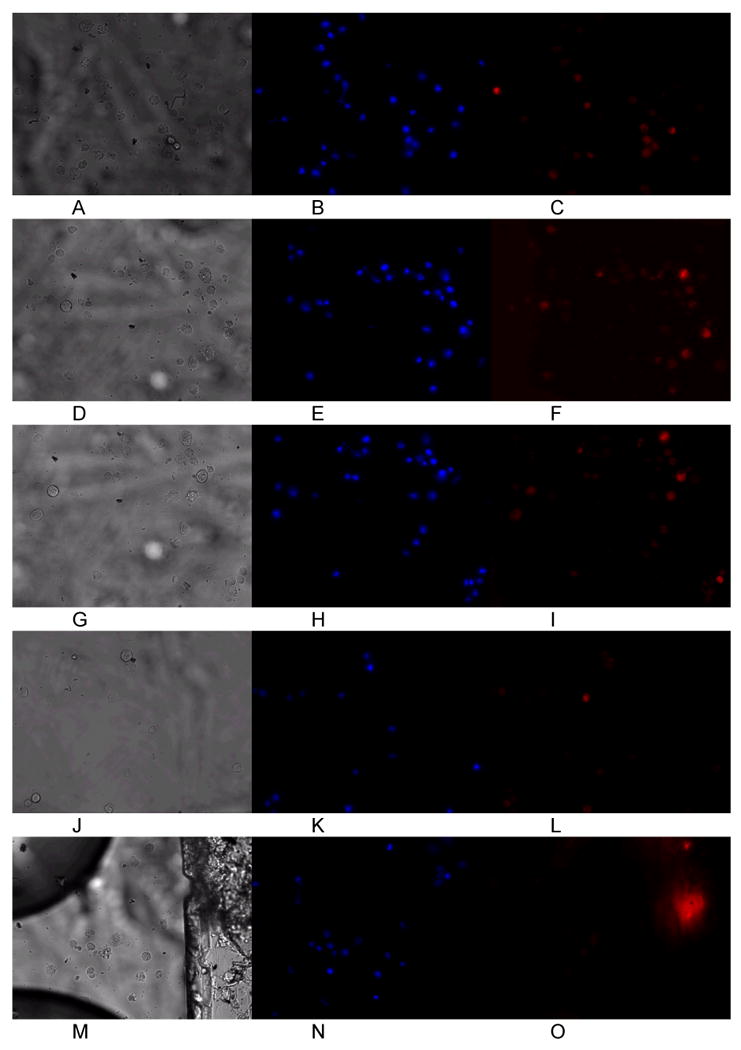
Representative images of cardiomyocytes cultured under hypoxia at 0 hours (A-C), 1 hour (D-F), 2 hours (G-I), and 3 hours (J-L) in the chip. Normoxia was then restored and images taken after 1 hour of normal oxygen levels (M-O). Hoechst imaging of the nuclei did not show significant photobleaching or other loss of fluorescence intensity (B,E,H,K, N). MitoTracker Red fluorescence was observed to decrease as cells became depolarized after 2 hours of hypoxia to induce ischemia in the cells (L). When oxygen flow was restored (O), further loss of mitochondrial membrane potential was observed. The larger fluorescent mass in panel O is an impurity in the PDMS chip and did not affect cell measurements.
Figure 4.
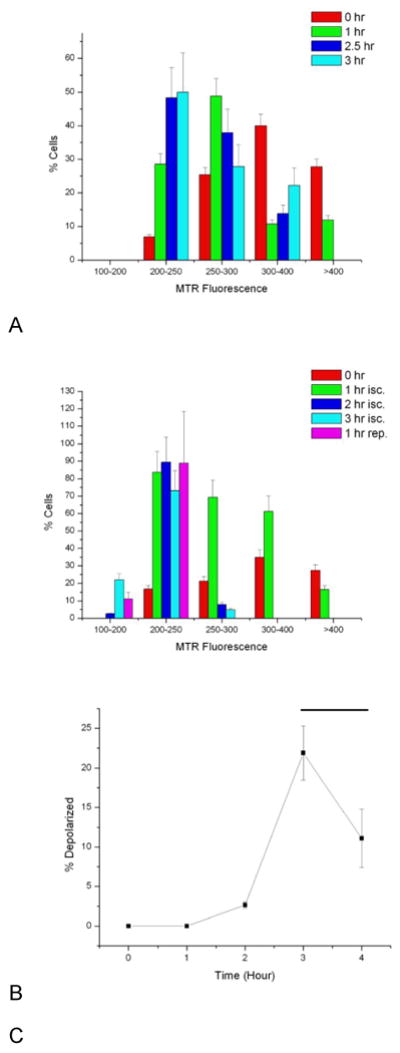
Histograms of MitoTracker Red (MTR) fluorescence for control cells (A) and cells cultured under ischemia (isc.) and reperfusion (rep.) conditions (B). Control cell intensities do decrease over the imaging period, but remain above 200 counts (for 1 μM MTR). Cells falling below 200 counts of MTR fluorescence intensity were deemed apoptotic. Cells grown on the ischemia/reperfusion chip show a greater decrease in MTR fluorescence, with a steady growth in the number of cells (C) with depolarized mitochondria (determined as the number of cells with <200 MTR signal counts). Black bar denotes period of reperfusion and restoration of normoxia. Error bars represent the counting error.
The restoration of oxygen after ischemia creates a shift in pH and produces reactive oxygen species, both of which contribute to a loss of membrane potential. Since apoptosis is an ATP-dependent process, the lack of oxygen during ischemia has often been cited as a reason for lower rates of apoptosis in ischemia than in reperfusion. However, membrane potential measurements, such as those performed in this work, demonstrate that apoptosis initiates during ischemia as well as during reperfusion. It is possible that, while pH shifts and reactive oxygen species trigger mitochondria-driven apoptosis, hypoxia also plays a significant role in pre-apoptotic factors such as cytochrome c release. In future work, we will couple these measurements with fluorogenic caspase detection (13,15) to determine if caspase activation is also prevalent during cardiomyocyte ischemia.
Morphological Aspects of Ischemia
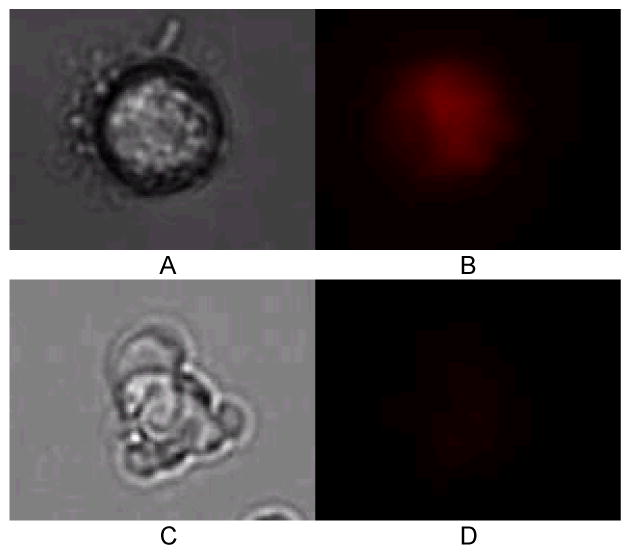
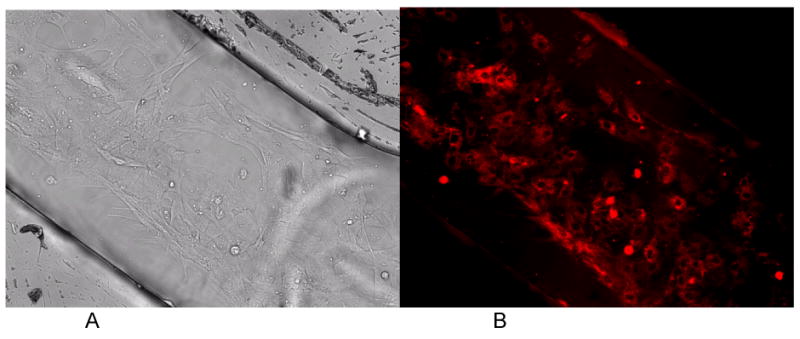
Cardiomyocytes suffering from ischemia were also observed to change their adhesion properties to the matrigel-coated chip (Figure 5). At the start of the experiment, after a 1.5-2 hour attachment period, all cells in the chip are adhered to the matrigel surface, with some cells fully spread out onto the chip. After 1 hour of ischemia, nearly all of the cells have retracted into a spheroid shape, while remaining attached to the chip surface. Rounding up of cardiomyocytes has been observed by others during ischemia (6), and serves as a marker of cell stress. This morphological condition continues through the ischemia process (4 hours). After reperfusion and restoration of normoxia, the cardiomyocytes remain in a spheroid shape, although some of the cells had begun to spread out on the matrigel again (Figure 5D). These cells that attempt to retain a spread-out morphology after reperfusion also have high MTR fluorescence, indicating that they have survived the I/R injury process. Toward the end of ischemia, some cells were also observed to be in later stages of apoptosis, as measured morphologically (Figure 6). In Figure 6A, an attached, spheroid cardiomyocyte retains MTR and exhibits bright fluorescence after 4 hours of hypoxia. A blebbing cell (identified by smaller spheroid apoptotic bodies rather than an intact cell (41)) 2 hours after reperfusion exhibited lower MTR fluorescence. Six cells were determined to be apoptotic by morphology after reperfusion, out of a sample of 144 cells. Since MTR fluorescence assays the earliest stages of apoptosis, the small number of late stage apoptotic cells measured by morphology is valid. In future work, we will extend these studies to longer culture times in order to determine the total effects of apoptosis during I/R injury.
Figure 5.
Morphological changes in chip-cultured cardiomyocytes during ischemia and reperfusion injury. At the experimental onset (A, top left) cells are fully attached or in the process of attaching to the matrigel surface. When ischemia is induced (B) cell-surface contact area decreases and the cardiomyocytes retract into spheroid shapes. 1 hour after reperfusion (C) cells remain spheroid with minimal attachment to the surface. 2 hours after hypoxia some cells have begun to reattach, but the majority of cardiomyocytes remain spheroid (D).
Figure 6.
Cell attached at 4 hours of ischemia, showing MitoTracker Red fluorescence (A, white light image; B, MTR fluorescence image). Apoptotic cell in the process of blebbing 2 hours after reperfusion (C, white light image; D MTR fluorescence imaging), with minimal MTR fluorescence signal from the cell.
Temporal Dynamics of Cardiomyocyte Apoptosis
As discussed earlier, loss of membrane potential and release of cytochrome c are some of the earliest steps in apoptosis (42) when triggered via the mitochondrial pathway. However, release of cytochrome c does not guarantee the formation of the apoptosome with apaf-1 and subsequent activation of caspase 9. Bcl-2, a regulator of apoptosis, provides some degree of cardioprotection during ischemia and reperfusion injury (10). Over-expression of Bcl-2 mitigates apoptosis. Indeed, blocking apoptosis has been identified as a therapeutic target to increase the survival rate in heart disease. French and co-workers (4) used multiple apoptosis markers (morphology, TUNEL assay, caspase 3 activation) to determine that the number of apoptotic cells is small during ischemia, while Kang and co-workers (6) showed that reoxygenation produces elevated rates of apoptosis. Our findings show that conditions for apoptosis are indeed set in motion during ischemia. Future work will determine if cardiomyocytes undergoing I/R injury in our chips also possess other pre-apoptotic and apoptotic markers.
Conclusion
Ischemia/Reperfusion injury continues to be a major source of cardiomyocyte loss in heart disease. Apoptosis has been identified as a contributor to muscle loss, one that can potentially be blocked during treatment. Our microfluidic system offers an alternative to whole-animal studies, one that can be used to enable multi-analyte measurements. While membrane potential was studied in this work, it is possible to add other markers of apoptosis and cardiomyocytes stress. In future work, we will incorporate other methods such as on-chip electrophoresis to assay additional apoptosis parameters.
The microfluidic device described in this work builds upon our previous work in low-shear cell culture, with additional functionality for gas control and oxygen monitoring. In addition, cells can be assayed for membrane potential changes, the earliest changes of apoptosis. It is important to stress, however, that membrane potential loss, and the release of cytochrome c, does not guarantee that apoptosis will ensue. However, morphological examination of cells imaged on the chip indicates that apoptosis does begin to occur after reperfusion. Experiments performed on chips such as these can use a single animal for repeat experiments, with control experiments coming from the same tissue rather than a different animal. This chip and related approaches has proven to be a facile method for inducing ischemia/reperfusion injury in primary cardiomyocytes, and can be used with other analytical methods (35) to determine the kinetics of apoptosis in cardiomyocyte loss.
Supplementary Material
Figure 7.
White light (A) and MTR fluorescence (B) images of long-term cardiomyocytes culture in the control sample inside the chip. The cells inside the chip demonstrate the confluency of cardiomyocytes inside the chip.
Acknowledgments
This work was supported by the National Institutes of Health (Grant RR025782 to DP) and the Robert A. Welch Foundation (Grant D-1667 to DP). BJ and KC acknowledge support from the Gordon W. Davis Regent's Chair Endowment at Texas Tech University. GK was supported by a Texas Tech University Provost's Fellowship.
References
- 1.Gill C, Mestril R, Samali A. FASEB Journal. 2002;16:135–146. doi: 10.1096/fj.01-0629com. [DOI] [PubMed] [Google Scholar]
- 2.Ding B, Price RL, Goldsmith EC, Borg TK, Yan X, Douglas PS. Circulation. 2000;101:2854–2862. doi: 10.1161/01.cir.101.24.2854. [DOI] [PubMed] [Google Scholar]
- 3.Buja LM. Cardiovascular Pathology. 2005;14:170–175. doi: 10.1016/j.carpath.2005.03.006. [DOI] [PubMed] [Google Scholar]
- 4.French CJ, Spees JL, Zaman AKMT, Taatjes DJ, Sobel BE. FASEB Journal. 2009;23:1177–1185. doi: 10.1096/fj.08-116509. [DOI] [PMC free article] [PubMed] [Google Scholar]
- 5.Ottaviani G, Lavezzi AM, Rossi L, Matturri L. European Journal of Histochemistry. 1999;43:7–14. [PubMed] [Google Scholar]
- 6.Kang PM, Haunstetter A, Aoki H, Usheva A, Izuma S. Circulation Research. 2000;87:118–125. doi: 10.1161/01.res.87.2.118. [DOI] [PubMed] [Google Scholar]
- 7.Holly TA, Drincic A, Byun Y, Nakamura S, Harris K, Klocke FJ, Cryns VL. J Molec Cell Cardiol. 1999;31:1709–1715. doi: 10.1006/jmcc.1999.1006. [DOI] [PubMed] [Google Scholar]
- 8.Machado NG, Alves MG, Carvalho RA, Oliveira PJ. Cardiovascular Toxicology. 2009;9:211–227. doi: 10.1007/s12012-009-9055-1. [DOI] [PubMed] [Google Scholar]
- 9.Lee P, Sata M, Lefer DJ, Factor SM, Walsh K, Kitsis RN. American Journal of Physiology Heart and Circulatory Physiology. 2003;284:H456–H463. doi: 10.1152/ajpheart.00777.2002. [DOI] [PubMed] [Google Scholar]
- 10.Chen Z, Chua CC, Ho YS, Hamdy RC, Chua BH. American Journal of Physiology Heart and Circulatory Physiology. 2001;280:H2313–H2320. doi: 10.1152/ajpheart.2001.280.5.H2313. [DOI] [PubMed] [Google Scholar]
- 11.Freude B, Masters TN, Robicsek F, Fokin A, Kostin S, Zimmerman R, Ullmann C, Lorenz-Meyer S, Schaper J. Journal of Molecular and Cellular Cardiology. 2000;32:197–208. doi: 10.1006/jmcc.1999.1066. [DOI] [PubMed] [Google Scholar]
- 12.Liu K, Dang D, Bayer K, Harrington T, Pappas D. Langmuir. 2008;24:5955–5960. doi: 10.1021/la8003917. [DOI] [PubMed] [Google Scholar]
- 13.Martinez MM, Reif RD, Pappas D. Analytical and Bioanalytical Chemistry. 2010;396:1177–1185. doi: 10.1007/s00216-009-3298-3. [DOI] [PubMed] [Google Scholar]
- 14.Reif RD, Martinez MM, Wang K, Pappas D. Analytical and Bioanalytical Chemistry. 2009;395:787–795. doi: 10.1007/s00216-009-3024-1. [DOI] [PubMed] [Google Scholar]
- 15.Reif RD, Martinez MM, Pappas D. Analytical and Bioanalytical Chemistry. 2010;397:3387–3396. doi: 10.1007/s00216-010-3567-1. [DOI] [PubMed] [Google Scholar]
- 16.Neeves KB, Diamond SL. Lab Chip. 2008;8:701–709. doi: 10.1039/b717824g. [DOI] [PMC free article] [PubMed] [Google Scholar]
- 17.Genes LI, Tolan NV, Hulvey MK, Martin RS, Spence DM. Lab Chip. 2007;7:1256–1259. doi: 10.1039/b712619k. [DOI] [PubMed] [Google Scholar]
- 18.Giridharan GA, Nguyen M, Estrada R, Parichehreh V, Hamid T, Ameen Ismahil M, Prabhu SD, Sethu P. Anal Chem. 2010;82:7581–7587. doi: 10.1021/ac1012893. [DOI] [PubMed] [Google Scholar]
- 19.Kawada T, Yamazaki T, Akiyama T, Kitagawa H, Shimizu S, Mizuno M, Li M, Sugimachi M. Life Sciences. 2010;83:490–495. doi: 10.1016/j.lfs.2008.07.013. [DOI] [PubMed] [Google Scholar]
- 20.Pappas D. Practical Cell Analysis. Wiley & Sons; 2010. [Google Scholar]
- 21.Poulsen CR, Culbertson CT, Jacobson SC, Ramsey JM. Analytical Chemistry. 2005;77:667–672. doi: 10.1021/ac049279i. [DOI] [PubMed] [Google Scholar]
- 22.Wu G, Irvine J, Luft C, Pressley D, Hodge CN, Janzen B. Combinatorial and High Throughput Screening. 2003;6:303–312. doi: 10.2174/138620703106298554. [DOI] [PubMed] [Google Scholar]
- 23.Chen Z, Li Q, Wang X, Wang Z, Zhang R, Yin M, Yin L, Xu K, Tang B. Analytical Chemistry. 2010;82:2006–2012. doi: 10.1021/ac902741r. [DOI] [PubMed] [Google Scholar]
- 24.Lu H, Gaudet S, Schmidt MA, Jensen KF. Analytical Chemistry. 2004;76:5705–5712. doi: 10.1021/ac049794g. [DOI] [PubMed] [Google Scholar]
- 25.Valero A, Merino F, Wolbers F, Luttge R, Vermes I, Andersson H, ven den Berg A. Lab on a Chip. 2005;5:49–55. doi: 10.1039/b415813j. [DOI] [PubMed] [Google Scholar]
- 26.Wlodkowic D, Faley S, Zagnoni M, Wikswo JP, Cooper JM. Analytical Chemistry. 2009;81:5517–5523. doi: 10.1021/ac9008463. [DOI] [PMC free article] [PubMed] [Google Scholar]
- 27.Wlodkowic D, Skommer J, McGuinness D, Faley S, Kolch W, Darzynkiewicz Z, Cooper JM. Analytical Chemistry. 2009;81:6952–6959. doi: 10.1021/ac9010217. [DOI] [PMC free article] [PubMed] [Google Scholar]
- 28.Klauke N, Smith G, Cooper JM. Analytical Chemistry. 2009;81:6390–6398. doi: 10.1021/ac9008429. [DOI] [PubMed] [Google Scholar]
- 29.Klauke N, Smith G, Cooper JM. Analytical Chemistry. 2010;82:585–592. doi: 10.1021/ac901886j. [DOI] [PubMed] [Google Scholar]
- 30.Klauke N, Smith GL, Cooper JM. Analytical Chemistry. 2007;79:1205–1212. doi: 10.1021/ac061547k. [DOI] [PubMed] [Google Scholar]
- 31.Cheah LT, Dou YH, Seymour AML, Dyer CE, Haswell SJ, Wadhawan JD, Greenman J. Lab on a Chip. 2010;10:2720–2726. doi: 10.1039/c004910g. [DOI] [PubMed] [Google Scholar]
- 32.Maddaford TG, Hurtado C, Sobrattee S, Czubbryt MP, Pierce GN. American Journal of Physiology Heart and Circulatory Physiology. 1999;277:H788–H798. doi: 10.1152/ajpheart.1999.277.2.H788. [DOI] [PubMed] [Google Scholar]
- 33.Oppegard SC, Blake AJ, Williams JC, Eddington DT. Lab Chip. 2010;10:2366–2373. doi: 10.1039/c004856a. [DOI] [PubMed] [Google Scholar]
- 34.Sinkala E, Eddington DT. Lab Chip. 2010;10:3291–3295. doi: 10.1039/c0lc00244e. [DOI] [PubMed] [Google Scholar]
- 35.Thomas PC, Halter M, Tona A, Raghavan SR, Plant AL, Forry SP. Analytical Chemistry. 2009;81:9239–9246. doi: 10.1021/ac9013379. [DOI] [PubMed] [Google Scholar]
- 36.Vakeva AP, Agah A, Rollins SA, Matis LA, Li L, Stahl GL. Circulation. 1998;97:2259–2267. doi: 10.1161/01.cir.97.22.2259. [DOI] [PubMed] [Google Scholar]
- 37.Tanaka M, Ito H, Adachi S, Akimoto H, Nishikawa T, Kasajima T, Marumo F, Hiroe M. Circ Res. 1994;75:426–433. doi: 10.1161/01.res.75.3.426. [DOI] [PubMed] [Google Scholar]
- 38.Jacobson SL, Piper HM. J Molec Cell Cardiol. 1986;18:661–678. doi: 10.1016/s0022-2828(86)80939-7. [DOI] [PubMed] [Google Scholar]
- 39.Diez C, Simm A. Cardiovascular Research. 1998;40:530–537. doi: 10.1016/s0008-6363(98)00189-8. [DOI] [PubMed] [Google Scholar]
- 40.Davidson MM, Nesti C, Palenzuela L, Walker WF, Hernandez E, Protas L, Hirano M, Isaac ND. J Molec Cell Cardiol. 2005;39:133–147. doi: 10.1016/j.yjmcc.2005.03.003. [DOI] [PubMed] [Google Scholar]
- 41.Hacker G. Cell Tissue Research. 2000;301:5–17. doi: 10.1007/s004410000193. [DOI] [PubMed] [Google Scholar]
- 42.Martinez MM, Reif RD, Pappas D. Analytical Methods. 2010;2:996–1004. [Google Scholar]
Associated Data
This section collects any data citations, data availability statements, or supplementary materials included in this article.