Abstract
In this paper, we continue to explore the repair mechanisms of the cyclobutane pyrimidine dimer. We find that a full description of both C5-C5′ and C6-C6′ bond splitting requires a multidimensional treatment involving a solvent coordinate in addition to changes in internal dimer coordinates. Non-equilibrium effects are likely to be important as well, although the initial conditions following forward electron transfer to the dimer, beyond the scope of this study, will ultimately determine the importance of these effects. Throughout the splitting of C5-C5′ and C6-C6′ bonds, a significant amount of excess charge is delocalized onto the solvent. We have verified that this is not an artifact of the electronic density functional theory (DFT) method used for this anionic system with Schröinger equation-based quantum chemical cluster calculations. The amount and variability of charge delocalization changes with the course of the reaction. The splitting of the C6-C6′ bond is accompanied by both an increase in electron density on the C6 and C6′ carbon atoms and an increase in the water density near those atoms. These features are observed both in our equilibrium umbrella sampling simulations and non-equilibrium trajectories.
1 Introduction
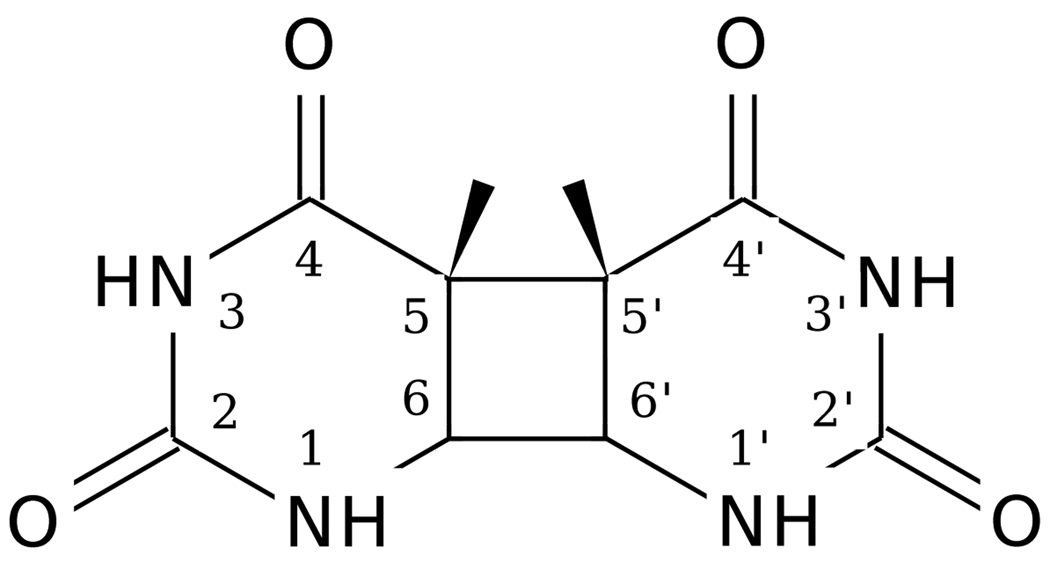
Cyclobutane pyrimidine dimers are a form of damage that occur in DNA via UV radiation.1–3 The thymine CPD is shown in Fig. 1. The enzyme photolyase can repair these lesions by injecting an electron at the site of damage.3, 4 There have been several experimental3–5 and theoretical efforts6–8 made to understand the mechanism by which the enzyme and model systems repair the dimers. The splitting of cyclobutane pyrimidine dimer anions has also been studied in numerous experiments on model compounds in a variety of solvents.9–11 The reader is referred to our companion paper12 for a detailed review. In this paper we continue our study of the splitting of the cyclobutane pyrimidine dimer in water, which has direct bearing on model compound studies and implications for DNA repair in photolyase.
Figure 1.
Thymine cyclobutane dimer.
We begin by briefly summarizing some of the main results of our first paper on the mechanisms in the repair of the cyclobutane thymine dimer. Ab initio simulations of the cis,syn-thymine cyclobutane pyrimidine dimer (CPD) splitting in aqueous solvent were conducted. The motion of both the CPD unit and the solvent is governed by a potential surface calculated using electronic density functional theory (DFT). Umbrella sampling was used to elucidate a two-dimensional free energy surface for dimer anion splitting with respect to the C5-C5′ and C6-C6′ bond lengths. Our 2D free energy surface predicts that the splitting of the C5-C5′ and C6-C6′ bonds is asynchronous concerted and complete within several picoseconds, consistent with recent theoretical work by Masson et al.6, 7 In contrast, the activation barrier for splitting the thymine dimer on the neutral surface is exceedingly large and splitting of the neutral dimer would not be accomplished by thermal fluctuations.
Back electron transfer (back ET or BET) is an intrinsic part of biological repair. Since the donor which transfers an electron to the CPD and the acceptor (generally the same group) that accepts the electron during BET are not part of our calculations, we cannot model BET explicitly. However, our calculations do provide some information on the BET process. We approximate BET as a vertical electron detachment. In doing so, we neglect the bias in the initial conditions following electron transfer toward fluctuations that bring the system to the transition state for the electron transfer process. If this bias weakly affects the subsequent partitioning of trajectories following BET toward either CPD re-formation or ring splitting, this approximation is acceptable. We find that the free energy maximum of the neutral surface that divides reactive from unreactive trajectories following BET, is quite close to the transition state (TST) on the anion surface. This implies that if back ET occurs after the TST on the anion surface, the quantum yield of repair would be close to unity. However back ET significantly before the TST on the anion surface will lead to a very low repair quantum yield. Finally, although we are unable to calculate an absolute BET rate without modeling the electron acceptor, our reaction free energy surfaces imply that the activation barrier for BET is lowest, and hence the relative rate of BET is largest, in the vicinity of the transition state for splitting of the dimer anion. If the dimer anion crosses the TST for splitting, BET will likely lead to successful repair.
In this paper, we first explore the role of multidimensional effects involving solvent motion on the splitting of the C5-C5′ bond. Our calculations show that the solvent plays a critical role in the splitting of both the C5-C5′ and C6-C6′ bonds. With regard to rate, solvent effects are more pronounced on the splitting of the C5-C5′ bond. However, we demonstrate that solvent is also mechanistically involved with C6-C6′ bond cleavage. Furthermore, our studies show that non-equilibrium effects associated with C5-C5′ bond cleavage, are likely. In previous studies,6, 7 the electronic structure of the surrounding solvent was not treated quantum mechanically and so issues such as charge transfer (CT) from the CPD unit to the solvent could not be examined. In this paper we present evidence that the CT delocalization onto the solvent is significant, and not an artifact of DFT by performing Schrödinger equation-based quantum chemical fragment calculations.
The computational methods deployed in this work and in our companion paper are briefly summarized in section 2. We begin in section 3 by discussing the multidimensional nature of the free energy landscape involved in the splitting of the C5-C5′ bond. Within this section we also discuss the role of solvent and dynamic changes in the electron density on the dimer, during the splitting process. As mentioned earlier, we find a significant amount of charge delocalization onto the solvent. In section 4 we verify this result with benchmarks that validate that the charge delocalization onto the solvent is not an artifact of the electronic structure calculation. In section 5, we discuss the partitioning of electron density between the dimer and solvent during the splitting the C6-C6′ bond. Changes in the solvent density around the C6 and C6′ carbon atoms during the splitting process as predicted from our equilibrium umbrella sampling simulations, are also detailed in this section. These results are verified by a comparison with non-equilibrium trajectories in section 6. Finally we end with conclusions of our work in section 7.
2 Computational Methods
Ab initio molecular dynamics simulations of the thymine CPD were conducted using Quickstep which is part of the CP2K package.13, 14 In these calculations, ab initio Born-Oppenheimer molecular dynamics is used for propagation of the classical nuclei. The electronic orbitals are converged to the Born-Oppenheimer surface at every step in the molecular dynamics simulation. The wave function was optimized using an orbital transformation method15 in conjunction with the DIIS scheme,16, 17 as described in Ref.14. The convergence criterion for optimization of the wave function was set to 10−6. Using the Gaussian and plane waves (GPW) method, the wave function was expanded in the Gaussian DZVP basis set. An auxiliary basis set of plane waves was used to expand the electron density up to a plane wave cutoff of 300Ry. We used the Becke-Lee-Yang-Parr gradient correction18, 19 to the local density approximation and Goddecker-Tetter-Hutter (GTH) pseudopotentials.20 In all anion simulations the local spin density approximation (LSD) is used for the exchange-correlation energy.
A time step of 0.5 fs was used in all simulations. The system consists of the thymine dimer solvated by 32 waters in a cubic periodic box of side length 9.8Å. The Nosé thermostat21, 22 with a time constant of 0.2ps was used to maintain the system temperature at 300K in the simulations. In our companion paper,12 umbrella sampling simulations were performed to determine the equilibrium free energy profiles along the splitting of the C5-C5′ and C6-C6′ bond lengths. Technical details of the umbrella sampling calculations are described in our companion paper.12 In this work we explore the role of non-equilibrium effects on the repair mechanisms of the CPD dimer. To study the non-equilibrium relaxation of the dimer anion during the first 0.5ps following electron transfer, 343 configurations were sampled from an equilibrium simulation of the neutral system consisting of the thymine dimer surrounded by 32 waters with both C5-C5′ and C6-C6′ bonds intact. The neutral system was equilibrated for 7ps, after which initial configurations for non-equilibrium trajectories were taken from an ensuing 20ps of simulation.
3 Multidimensional and possible non-equilibrium effects during C5-C5′ bond splitting
The free energy surfaces presented in our companion paper,12 were calculated using an equilibrium distribution, or as close as one can be approximated with finite sampling, for all degrees of freedom except those constrained in the umbrella sampling. These surfaces indicate that opening the C5-C5′ bond involves only a very small free energy barrier, and a larger barrier of 1.5kcalmol−1 for cleavage of the C6-C6′ bond. Hence the newly formed anion is expected to quickly reach equilibrium at the local free energy minimum associated with the partially cleaved C5-C5′ bond and intact C6-C6′ bond. Using transition state theory for C5-C5′ bond cleavage with the C5-C5′ bond length as a reaction coordinate assumes that all coordinates orthogonal to the C5-C5′ bond cleavage coordinate reach local equilibrium on a shorter timescale than the fast C5-C5′ bond splitting time predicted by the small barrier obtained previously.12 The nascent anion with the C5-C5′ and C6-C6′ bonds intact is formed by the transfer of an electron to the neutral system, where the solvent is equilibrated near a neutral CPD unit (or more precisely, is executing a fluctuation likely to induce forward electron transfer to the CPD unit). This opens the possibility that non-equilibrium effects could affect this stage of the dimer splitting reaction. Regardless of whether non-equilibrium effects occur, it is always possible that involvement of additional degrees of freedom in the reaction process should be considered to better characterize the reaction path and more accurately estimate the true free energy barrier for the reaction.
In this work we do not model the electron transfer process from a potential donor to the thymine dimer. Hence, we cannot specify the typical dimer and solvent configurations where electron transfer occurs, which would form the nascent distribution on the anion surface for dimer splitting. To obtain some information on the likelihood of multidimensional and non-equilibrium effects, we adopted the equilibrium distribution of the neutral thymine dimer surrounded with 32 waters, as the initial nuclear configurational distribution following electron transfer. Masson et al.,7 who have recently conducted QM/MM simulations of the thymine dimer in the active site of the photolyase protein, made a similar choice for their initial configurations. With this caveat concerning the initial distribution, we have studied the non-equilibrium dynamics of the anion dimer starting from the equilibrium distribution of the neutral. The results presented below indicate that the one- and two-dimensional free energy profiles presented in the earlier paper,12 might not capture the full complexity of the reaction dynamics. In particular we show that solvent motion comes into play, requiring an additional reaction coordinate describing the configuration of nearby water molecules. Of course, to definitively determine whether non-equilibrium effects will play a role, we would need a better estimate of the initial distribution following electron transfer. This will depend on the chemical identity of the electron donor and is beyond the scope of this study.
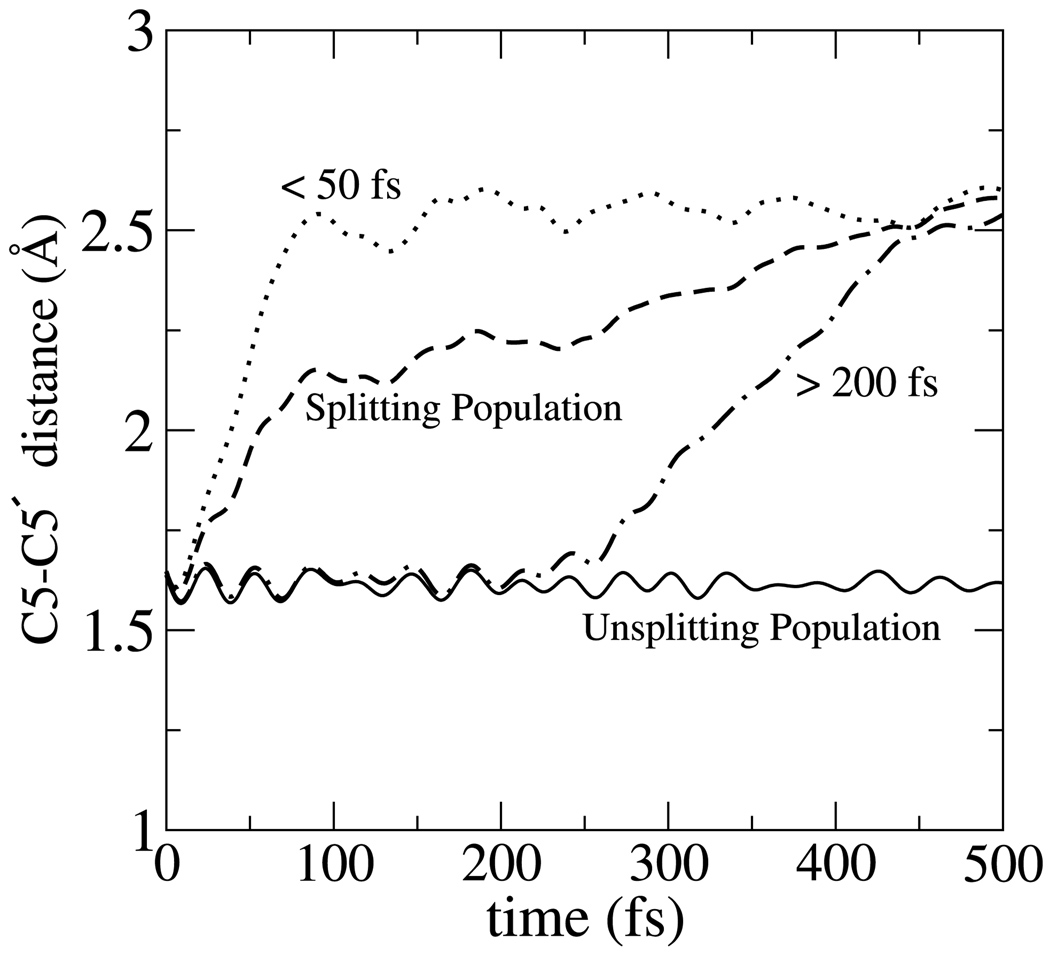
To study the non-equilibrium relaxation of the dimer anion during the first 0.5ps following electron transfer, 343 configurations were sampled from an equilibrium simulation of the neutral system consisting of the thymine dimer surrounded by 32 waters with both C5-C5′ and C6-C6′ bonds intact. The neutral system was equilibrated for 7ps, after which initial configurations for non-equilibrium trajectories were taken from an ensuing 20ps of simulation. Details concerning the basis sets and simulation methods are given in the companion paper.12 The initial velocities for the non-equilibrium simulations were chosen from a Maxwell-Boltzmann distribution at 300K.We monitored the C5-C5′ and C6-C6′ distances as well as the evolution of other charge and configurational properties. Fig. 2 shows that for 52% of the trajectories, the C5-C5′ bond rapidly elongated from 1.6Å to 2.5Å within the 500fs run time while the other 48% remained uncleaved at 1.6Å and appear to be opening on a longer time scale than that which would be inferred by our equilibrium free energy curve along the C5-C5′ coordinate documented in the earlier paper12 (barrier of 0.6kcal mol−1). Fig. 2 also shows the non-equilibrium average of trajectories that split within 50fs and those that split between 200–500fs. These populations are later analyzed separately. Masson et al.7 also found that the C5-C5′ bond in one of their seven trajectories remained intact for an unusually longer time of 400fs. In our simulations the C6-C6′ bond remained intact, near 1.6Å in all but 14 of our 343 non-equilibrium trajectories lasting 500fs. In those 14 cases, splitting of the C6-C6′ bond was preceded by splitting of the C5-C5′ bond. The delocalization of the excess charge onto the solvent, for which evidence is presented in the following section, was observed in both the splitting and unsplitting populations. This effect is somewhat sensitive to the size of the box. We performed a limited number of non-equilibrium simulations for a system with 64 waters, which is described in the Supporting Information. A similar division between splitting and non-splitting trajectories was found, but the delay for the non-splitting trajectories was not as great as for the 32-water system. Based on the limited statistics for the system with 64 waters, the trajectories appear to remain trapped at a fixed C5-C5′ length for a shorter period of time than those observed for the 32 water system.
Figure 2.
Non-equilibrium dynamics of C5-C5′ bond after electron injection leading to splitting and unsplitting populations. The solid curve (unsplitting population) is the average C5-C5′ bond length among 48% of trajectories with no C5-C5′ bond cleavage out to 500fs. The dashed curve (splitting population) gives the same average for the remaining 52% of trajectories. Also shown are trajectories from the splitting population that split within 50fs (60%) and between 200–500fs (40%).
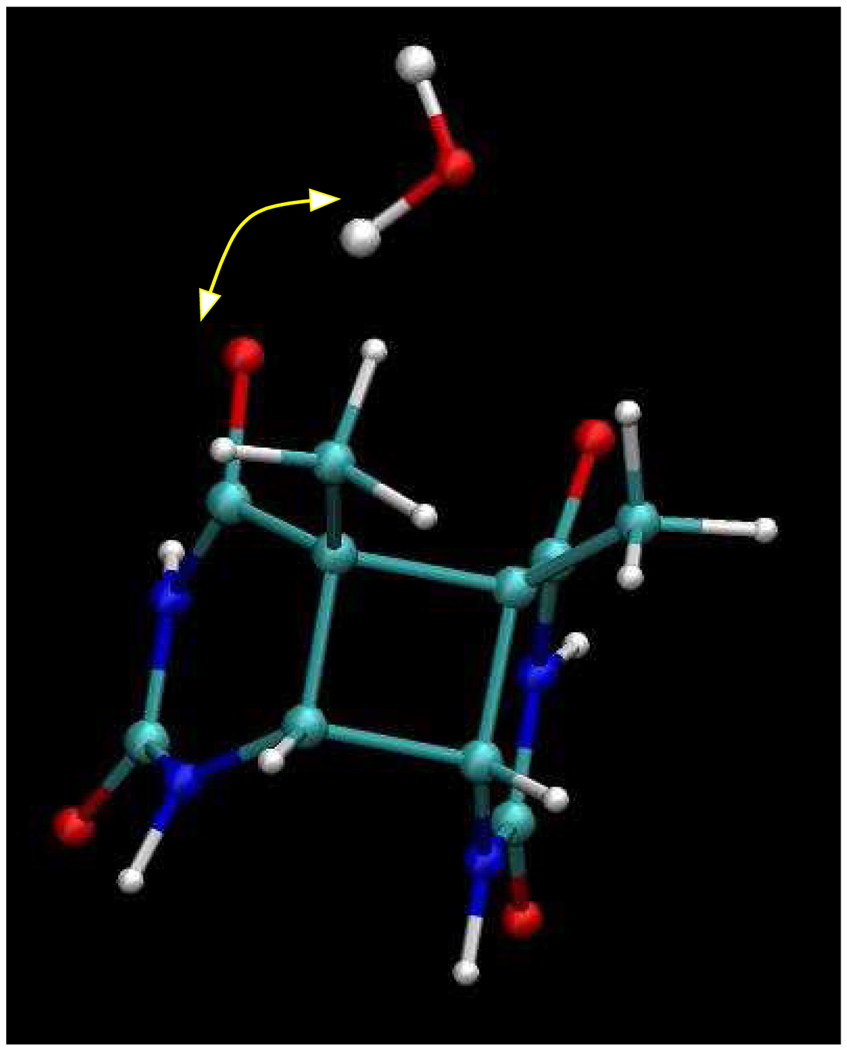
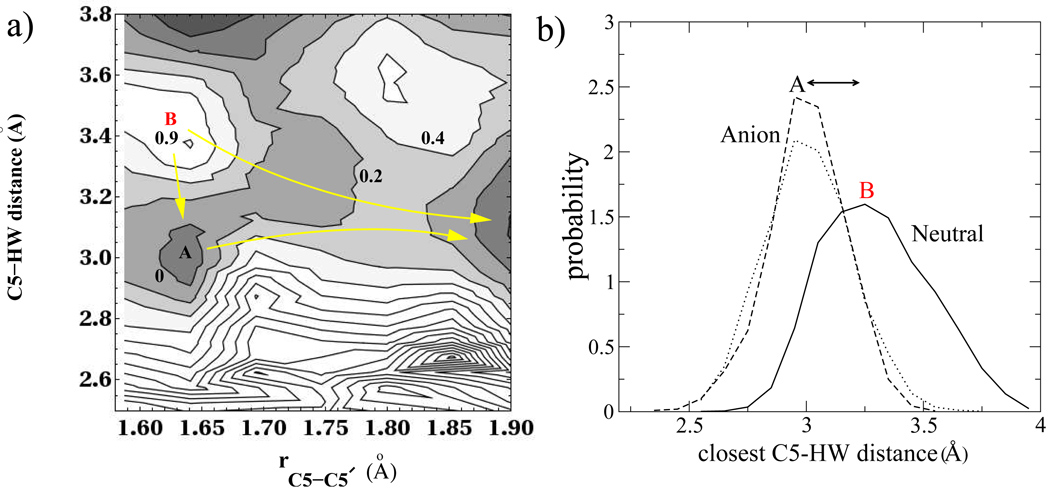
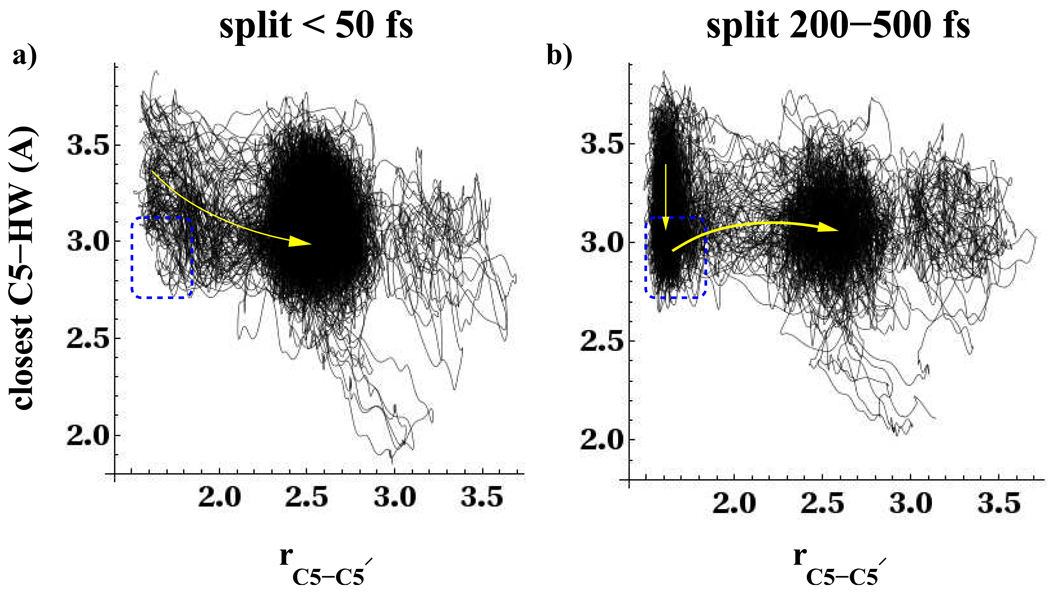
The involvement of aqueous solvent in the reaction dynamics, is revealed by tracking several solute-solvent coordinates. During our umbrella sampling simulations we find that a single water molecule as shown in Fig. 3, stays close to the O4 carbonyl oxygen throughout most of the simulation time. After much longer simulations and larger system sizes we would expect to sample configurations where water molecules would exchange with the bulk and interact in this fashion with the other carbonyl oxygen. The configuration of the water molecules close to the C5 carbon atom is important in determining the evolution of the two populations (splitting and unsplitting trajectories) following electron addition. Fig. 4a shows a 2D potential of mean force (PMF) for the distance between the C5 carbon atom and hydrogens on the waters obtained from all our umbrella sampling windows along the C5-C5′ coordinate. The plot shows some interesting features. There exists a shallow minimum at a C5-C5′ distance of 1.6Å and a C5-HWdistance of 3.0Å corresponding to the location of the closest waters near the C5 carbon atom (labeled A in figure). In Fig. 4a, the free energy is assigned to have a value zero at this local minimum. In Fig. 4b we show the distribution of the closest C5-HW distance amongst waters near the C5 carbon atom on the neutral surface (labeled B) as well as the first two umbrella windows on the anion surface where the C5-C5′ distance was constrained to 1.59Å and 1.64Å respectively (labeled A). The figure shows that on the neutral surface the closest water hydrogen is located further out at approximately 3.3Å on a softer potential while on the anion surface the closest hydrogen of the waters is located at a distance of approximately 3.0Å on a tighter potential. This implies that transfer of an electron to an equilibrium distribution of neutral dimers will place most of the initial configurations near a free energy maximum at approximately 0.9kcal mol−1 in Fig. 4a (position B), from which trajectories may evolve toward direct splitting of the C5-C5′ bond, or become trapped in the local free energy minimum shown in Fig. 4a (position A). This subtle difference between the water configuration near the C5 carbon atom on the neutral and anion surface determines the fate of the splitting and unsplitting populations, and makes the water separation an important component in the reaction coordinate for the repair of the CPD unit.
Figure 3.
Snapshot showing location of single water molecule near the O4 carbonyl oxygen
Figure 4.
a) 2D Surface for potential of mean force between C5 and HW of all waters with distances in Angstroms and free energy in kcal mol−1 b) Distribution of the distance of the closest water hydrogen to the C5 atom on the neutral surface and the first two umbrella windows (rC5−C5′ = 1.59, 1.64Å) on the anion surface.
In Fig. 5 we show the evolution of the C5-C5′ bond and the closest C5-HW distance for the non-equilibrium swarm of trajectories. The yellow arrows on both figures serve as a guide to illustrate that the equilibrium free energy analysis incorporating solvent in the reaction coordinate shown in Fig. 4a, is consistent with the non-equilibrium trajectories. The left panel of Fig. 5 shows the non-equilibrium swarm of trajectories that split within 50fs while the right panel of Fig. 5 shows the non-equilibrium swarm of trajectories that splits between 200–500fs. The swarm that splits on the faster timescale does not exhibit a strong density of trajectories in the region indicated in the figures with a rectangular box corresponding to the free energy minimum at rC5−C5′ = 1.6Å, rC5−HW = 3.0Å in Fig. 4a. The trajectories that split within 50fs bypass or briefly linger in the rectangular region of the left panel in Fig. 5. They do not become deactivated in the free energy minimum corresponding to this region. For these trajectories we observe that as the C5-C5′ bond splits, the distance between the closest water hydrogen and the C5 carbon atom also decreases by 0.3Å. The trajectories that split between 200–500fs are seen to populate the free energy well near rC5−C5′ = 1.6Å, rC5−HW = 3.0Å (point A Fig. 4a and right panel of Fig. 5). When comparing the left and right panels of Fig. 5, note that roughly the same number of trajectories is plotted in each figure. After equilibration into the shallow minimum, where the C5-C5′ bond is still intact, the trajectories on the right panel of Fig. 5 then undergo splitting of the C5-C5′ bond when activated by an increase in the closest water hydrogen distance to the C5 atom (curved arrow in Fig. 5b).
Figure 5.
Non-equilibrium swarm of trajectories in left panel a) that split within 50fs and right panel b) that split between 200–500fs. The total length of all trajectories was 500fs. The dashed rectangular box indicates the location of a local free energy minimum for water near the C5 atom of an unsplit C5-C5′ bond. This minimum is located at point A in Figs. 4.
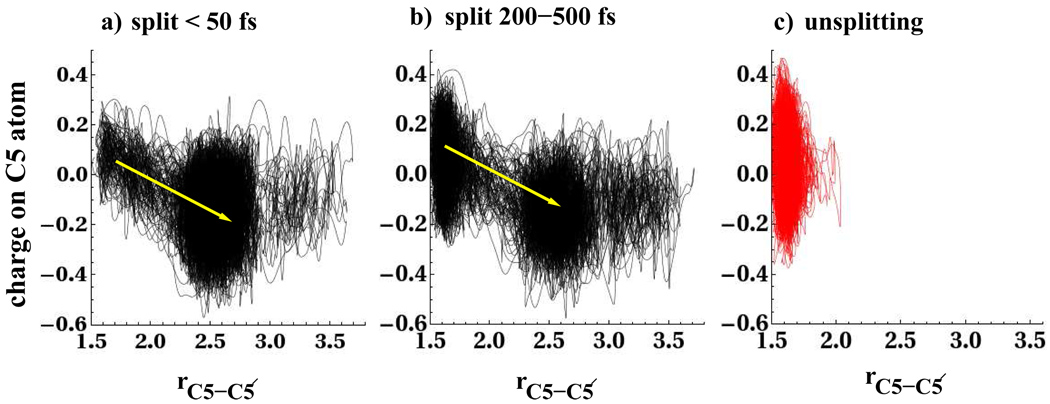
Several features of the charge and electronic orbital distributions observed in our non-equilibrium trajectories and umbrella sampling studies agree with previous theoretical work. Rosch and coworkers23 studied the evolution of the spin densities at the C5 and C5′ carbon atoms for the gas phase thymine dimer and proposed that as the C5-C5′ bond splits, the unpaired electron localizes at the C5′ carbon atom. In the left panel of Fig. 6 we show the evolution of the charge on the C5 carbon atom for the trajectories that split within the first 50fs, and on the right panel we show the unsplitting population and trajectories that split between 200–500fs. Charges were calculated using the density derived DDAP24 charges. The data shows that as the C5-C5′ bond splits, there is partial localization of electron density on the C5 carbon atom in the splitting populations. The data in the left panels of Fig. 5 and Fig. 6 show that the splitting of the C5-C5′ bond, is accompanied by an increase in electron density at the C5 carbon atom and a decrease in the closest water hydrogen distance to the C5 carbon atom by roughly 0.3Å. For the unsplitting populations and the swarm that split over a longer timescale, the average charge on the C5 carbon atom is close to zero when the C5-C5′ bond is intact, after which bond splitting leads to localization of charge on the C5 carbon atom. We observe the same effect at the C5′ carbon atom and hence report only the behavior at the C5 carbon atom.
Figure 6.
Non-equilibrium swarm of trajectories showing evolution of charge on C5 carbon atom for populations in which the C5-C5′ bond splits a) within 50 f s, b) in a time between 200 and 500 f s, and c) for those trajectories that do not split within 500 f s.
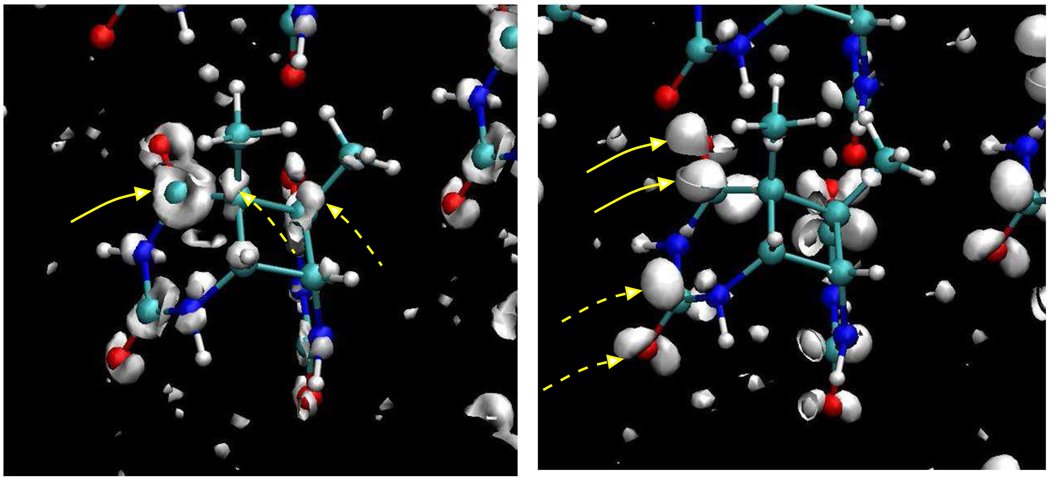
In order to provide some qualitative insight into the mechanism of bond breaking (C5-C5′ first followed by C6-C6′ second), we have calculated maps of the electron density difference between anion and neutral states for configurations with both bonds intact. Amap for one such configuration is displayed in Fig. 7 where the ball-and-stick representations of the waters have been removed for visual clarity. A positive isovalue for the electron density is plotted on the left in Fig. 7, revealing where electron density is enhanced following electron transfer. A negative isovalue is plotted on the right in Fig. 7, indicating regions of depleted electron density resulting from electron transfer. Pockets of density outside of the dimer correspond to regions where the electron density is delocalized on the water. The left panel of Fig. 7 shows quite clearly that when the electron is added to the neutral system, there is an increase in electron density in the C4-O4σ and in the C5-C5′σ* orbitals. The increase in electron density seems to be more significant at the C4-O4(C4′-O4′) carbonyls but occurs at the C2-O2(C2′-O2′) carbonyls as well. In the right panel in Fig. 7 we observe regions of decrease in electron density at the C4-O4π* orbital. As before, this seems to be most significant at the C4-O4(C4′-O4′) carbonyls but also occurs at the C2-O2(C2′-O2′) carbonyls. We also find a decrease in electron density in the C5-C5′σ orbital in another fragment but the data is not shown for brevity. Delocalization of electron density from the C4-O4π* orbital was recently suggested by Masson et al.7 as the mechanism for the rapid splitting of the C5-C5′ bond upon electron addition. The foregoing observations concerning the electron density in Fig. 7 are consistent with the mechanisms suggested in these previous theoretical works.7, 8, 25
Figure 7.
Isosurfaces showing location of difference in electron density between anion and neutral systems. The isosurface on the left represents a positive isovalue while that on the left represents a negative isovalue. Solid and dashed yellow arrows in the left panel point to the C4-O4σ and C5-C5′σ* orbitals respectively. Solid and dashed yellow arrows in the right panel point to the C4-O4π* and C2-O2π* orbitals respectively.
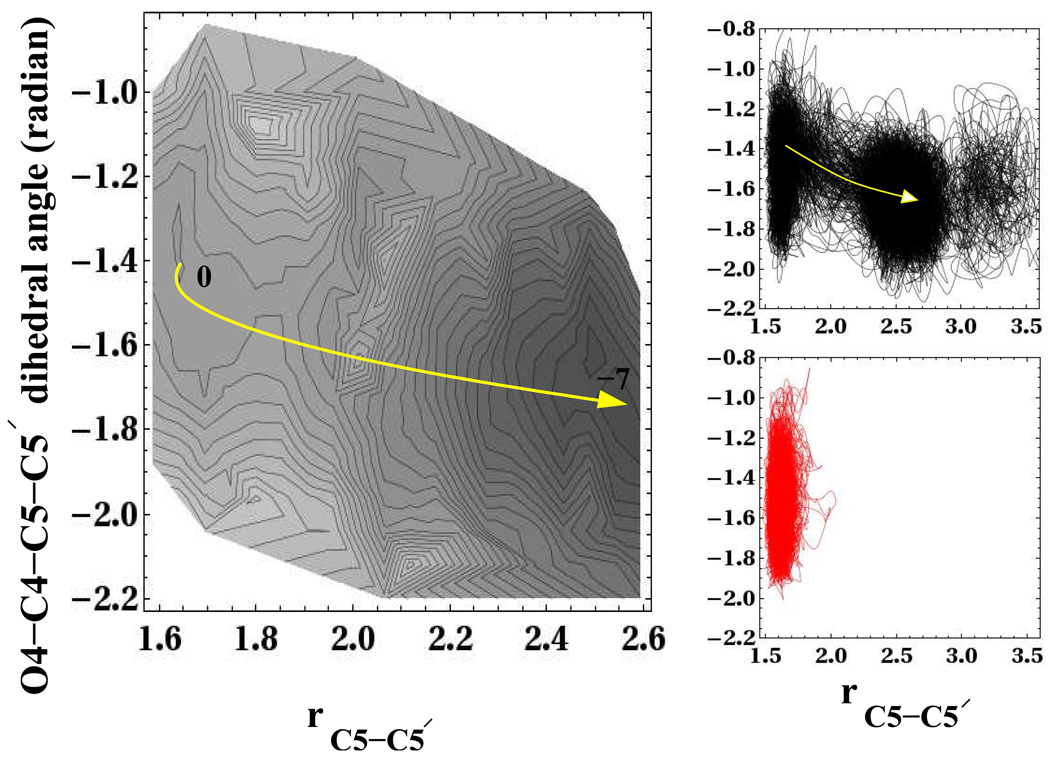
As mentioned earlier, Masson et al.7 observe a longer C5-C5′ bond splitting time in one of their trajectories, consistent with the non-equilibrium effects we have documented. They attribute the delayed C5-C5′ bond splitting to a different extent of C4-O4π* and C5-C5′σ* orbital coupling in one of their trajectories, associated with a smaller and more widely fluctuating O4-C4-C5-C5′ dihedral angle. So far, we have not found evidence to associate smaller dihedral angle with delayed C5-C5′ bond splitting, although it may not be entirely appropriate to compare dimer splitting in DNA photolyase with splitting of the free dimer anion in solution treated here. The top and bottom right panels of Fig. 8 shows that at the instant of electron injection there is no discernible difference between the splitting and unsplitting populations along the O4-C4-C5-C5′ dihedral angle coordinate. Both splitting and unsplitting populations at the instant of electron injection have an average O4-C4-C5-C5′ dihedral angle of approximately −1.4 radians. Furthermore, the fluctuations also appear to be very similar. The non-equilibrium trajectories that split along the C5-C5′ bond show some widening of the dihedral angle to more negative values, consistent with the shift of the minimum free energy toward more negative values of the dihedral angle with increasing C5-C5′ bond length, observed in the free energy surface in the left and right panels of Fig. 8 as indicated by the yellow arrows.
Figure 8.
On the left is the 2D free energy surface for the C4-O4-C5-C5′ dihedral angle and C5-C5′ bond. On the right the path of a swarm of non-equilibrium trajectories over these two coordinates is shown. The trajectories that split are black (top right), while those that do not split within the observation window of 0.5–1ps are shown in red (bottom right).
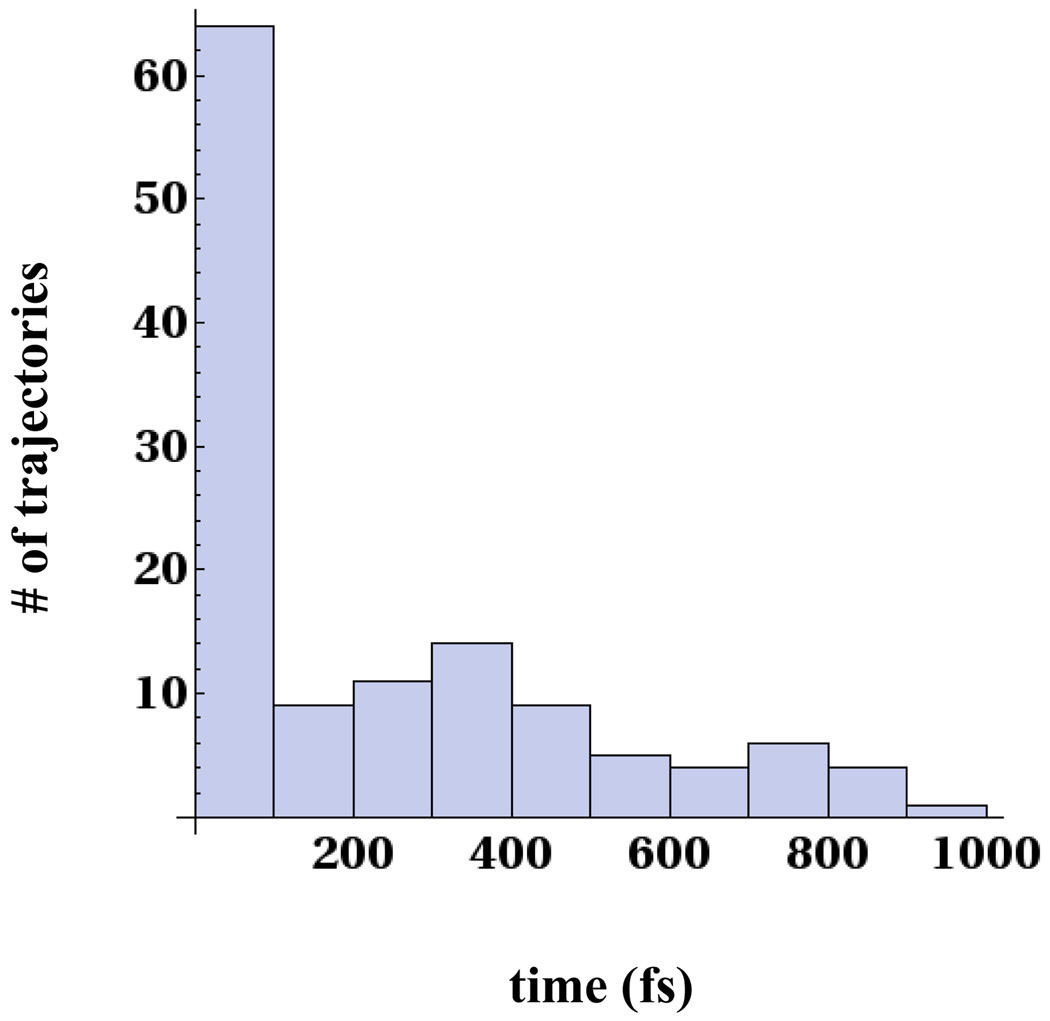
Having accumulated many trajectories that involve the splitting of the C5-C5′ bond, we can examine the distribution of splitting times. Fig. 9 shows the distribution of splitting times for the C5-C5′ bond among 179 non-equilibrium 1ps trajectories with initial conditions randomly sampled from an equilibrium distribution of the neutral dimer. There is a big peak between 0–50fs indicating that majority of the splitting population cleaves within a very short time. However, we do observe a long tail of splitting times beyond 50fs all the way up to 1 ps. The long tail corresponds to trajectories that first equilibrate into the region shown in Fig. 4a with the C5-C5′ intact and at a C5-HW bond distance of 3.0Å which corresponds to the closest water hydrogen approach to the C5 atom (position A). The C5-C5′ and C6-C6′ bonds for 49 of the trajectories, a substantial fraction of the initial sample, remain unsplit after 1ps of running time. In our earlier paper,12 we stated that the two-dimensional free energy surface in the C5-C5′ and C6-C6′ bond lengths suggests an asynchronous concerted process for the bond splitting. Even though the C5-C5′ and C6-C6′ bonds are broken sequentially along the reaction path from the initial state following electron transfer to the split products, there is only one significant transition state, the one separating the partially cleaved configuration (C5-C5′ bond cleaved, C6-C6′ intact) and the split products. This applies for the swarm of trajectories that split within 50fs shown in the left panel of Fig. 5. However the swarm of trajectories that split between 200–500fs and the 49 trajectories that remain unsplit and trapped in the shallow minimum shown in Fig. 4a, indicate that enlarging the reaction coordinate to include solvent can reveal a stepwise character to the reaction. The probability of proceeding directly to the partially cleaved locally stable state or being trapped in the shallow minimum found in Fig. 4a depends on the nascent configurational distribution following electron transfer. The first reaction mechanism is concerted, while the second is stepwise because the system surmounts two free energy barriers on the way to split products. Consequently, a stringent assignment of stepwise versus concerted mechanism is complicated by the non-equilibrium effects involving the role of solvent.
Figure 9.
Distribution of splitting times for C5-C5′ bond for 1ps non-equilibrium trajectories that began at the nascent anion position.
The results of this section should be taken as a possible example of the type of non-equilibrium or multi-dimensional effects that can result from the initial distribution following electron transfer, and how these may require additional reaction coordinates, in this case involving solvent, for their description. Non-equilibrium effects that could occur in the model compounds9–11 or in the active site of the protein4 are likely to be more complex and should be explored in greater detail. Our non-equilibrium trajectories were initially sampled from a relatively short 20ps simulation of the neutral solvated CPD unit feasible for AIMD simulations. Macromolecular fluctuations on longer timescales that are likely prevalent in the active site of the protein and in model compounds with a long tether to the photoreceptor, might also provide conditions for other multidimensional and non-equilibrium effects that are beyond the scope of this study. Some of these non-equilibrium effects might arise from coupled motion involving the protein and solvent.26, 27 The timescale associated with relaxation of the surrounding solvent to stabilize the CT state formed after forward ET in comparison with the timescale for bond cleavage will play a critical role in determining the mechanism of the splitting process.28, 29
It is worth noting that the X-ray crystal structure of the protein photolyase, PDB code 1TEZ,30 shows that the adenine dinucleotide of the cofactor FADH−, occupies a similar topographical position in the active site as the closest water described in our simulations above. This might suggest a role for the adenine dinucleotide to participate in the splitting of the C5-C5′ bond as suggested by experiments by Zhong and co-workers.4 However, more detailed simulations of this system in the active site of the protein will be required to confirm this mechanism and the role of the adenine dinucleotide in DNA repair.
4 Methodological issues regarding charge delocalization
A central issue in a substantial portion of the previous work on CPD splitting is the location of the excess electron density during the course of the splitting process.6, 8, 23, 31, 32 During the entire splitting process we find a significant degree of charge delocalization onto the water. Before presenting results it is necessary to discuss several methodological difficulties associated with calculating the disposal of excess charge. Charge delocalization can sometimes arise as an artifact in density functional theory calculations. The SIE (self interaction error) is well known to plague DFT type calculations, especially for excited states but also in ground state systems.33 Furthermore, assignment of charge to different locations is susceptible to some arbitrariness based on the partitioning scheme, with density-based methods more reliable than schemes based on atomic orbital coefficients, such as Mulliken charges.34 We classify schemes based on fitting to the electrostatic potential among the density-based schemes, since Poisson’s equation directly relates the density and electrostatic potential.
In light of the well-known difficulties involved in calculating and partitioning the charge density, we tested the validity of the charge delocalization observed in our simulations. We applied several quantum chemical methods, basis sets, system sizes and charge assignment schemes to the dimer clustered with either 6 or 10 water molecules. We have also computed the extent of charge delocalization onto the water using the long range corrected density functional LC-BLYP developed by Hirao and co-workers,35 where the long range part of the exchange interaction is treated with full Hartree-Fock exchange and has been shown to improve the description of charge transfer states. In the Supporting Information, we document that significant charge delocalization onto water molecules still appears even with a long range corrected density functional or even using Hartree-Fock theory, which is not plagued by SIE. Hence charge delocalisation does not appear to be a methodological artifact. The results show that moving to more flexible basis sets still results in a substantial amount of charge delocalization. Furthermore, using Hartree-Fock methods, which are not plagued by SIE, the charge delocalization is also quite substantial. Hence, significant charge delocalization onto water molecules does not appear be an artifact of using density functional theory for this anionic system. The charges from CP2K reported later in this are the density derived DDAP charges.24
It is worth noting that charge transfer between solute and solvent has already been reported in several systems. Klein and co-workers36 conducted ab initio simulations of a zwitterionic peptide, halide anions and alkali cations in water. They observed a substantial amount of charge transfer between the carboxylate terminus and the solvent (0.1e). Chloride and bromide anions were found to transfer more electronic charge (0.26e) onto the surrounding solvent. CT effects in halide-water clusters have also been reported by Hynes et al.37 Truhlar and co-workers have recently observed substantial CT (0.18–0.32e) to surrounding water in different anionic solutes.38 Perhaps more pertinent to larger protein-water systems, Merz and co-workers39 determined that for a cold shock protein A(CspA), a substantial amount of charge was transferred from the protein surface to the surrounding solvent using PM3 and AM1 semi-empirical methods. Analogously, the negatively charged residues Glu and Asp were found to transfer the most charge to the water (approximately 0.2e on average). Merz et al.40 have also verified through extensive benchmarking on various systems that the qualitative nature of the charge transfer between the solute and solvent is captured by both semi-empirical and ab initio methods.
The gas phase CPD anion has been described as a dipole bound state while the addition of water to the CPD anion is thought to stabilize the valence bound state.8 The solvated CPD anion that we study has properties intermediate between a dipole bound and valence bound anion (where the electron is exclusively localized within the framework of the molecule). While not delocalized to the same extent as a dipole bound anion, the solvated CPD anion in our work, exhibits a large degree of electron delocalization onto the neighboring solvent. However, splitting of the dimer after accepting an electron triggered by population of an anti-bonding molecular orbital a characteristic consistent with a valence bound anion, occurs in the CPD anion that we study. Furthermore, we also observe an increase in the C5-C5′ and C6-C6′ bond lengths of the split anion products after back electron transfer, another characteristic expected for a VB anion.12 Thus, properties associated with a valence bound anion can occur for this anionic system even though a significant amount of electron density is delocalized onto the solvent.
5 Evolution of molecular properties during splitting
The charge distribution on the dimer and its effect on dimer-solvent interactions has been considered in previous studies of CPD repair.6, 7 We document the evolution of these molecular properties during the splitting process. Specifically, we look at the changes in the electron density on both the dimer and solvent and the solvent number density around the regions undergoing splitting. We focus on the rate determining step, namely the splitting of the C6-C6′ bond. Four points along the reaction coordinate, identified in Fig.4 of the preceding paper,12 are examined in detail: (1) the minima of the partially split dimer where the C5-C5′ bond is broken and the C6-C6′ bond is intact, (2) near the transition state, (3) a point beyond the transition state on the way to the split products, and (4) the completely split dimer. Umbrella sampling trajectories at these four points were run for at least 10ps longer than the other umbrella sampling windows, to converge as best as possible, molecular properties reported below.
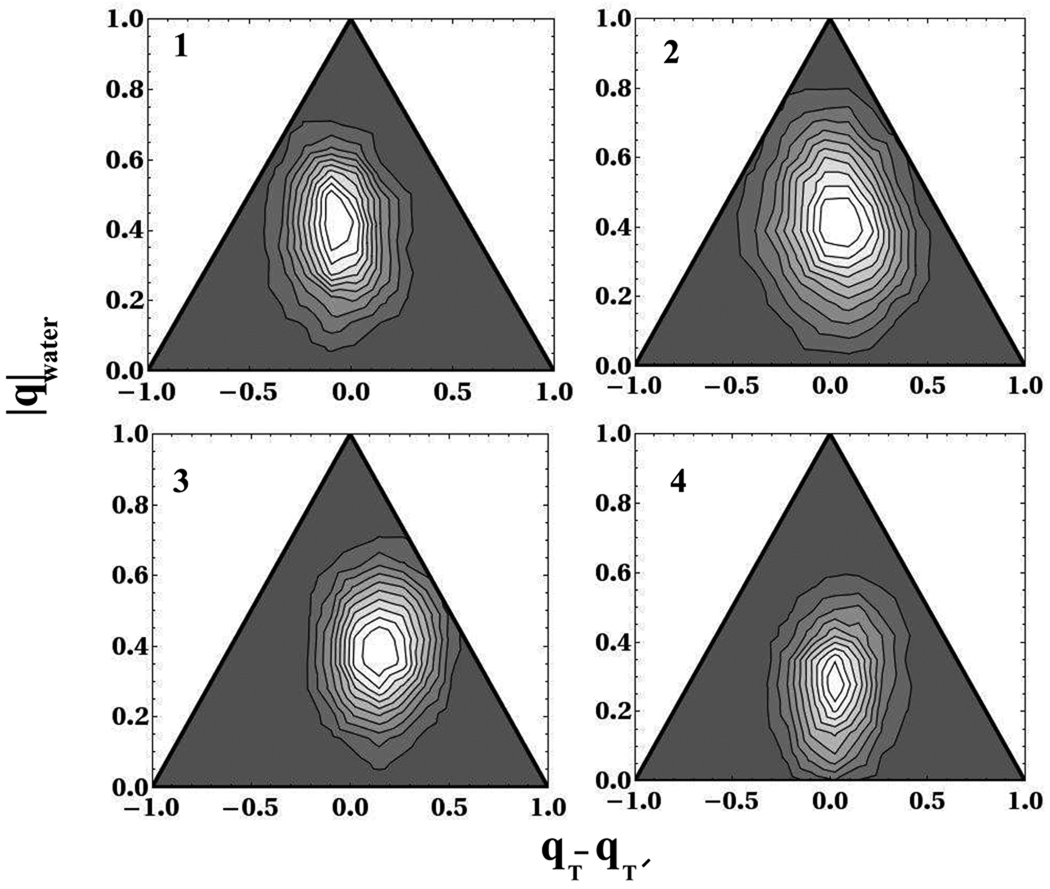
The partition of excess charge between the two bases and on the aqueous solvent is displayed using a ternary plot. A point at the bottom left and right hand corners of the triangles in Fig. 10 represents the full electron charge on each base respectively, while the top corner of the triangle represents full electron transfer onto the solvent. The assignment of charge to the C5,C5′,C6 and C6′ atoms as reported in Fig. 10 was accomplished using the DDAP scheme, as discussed at the beginning of section 4.
Figure 10.
Electron charge partitioning between water and two thymine bases during splitting of the C6-C6′ bond at four points along the splitting of the C6-C6′ bond. The y-axis in all four panels is the absolute value of the total charge on the water and the x-axis is the difference in charge between the two thymine bases. A point at the bottom left and right hand corners of the triangle represents the full electron charge on each base respectively, while the top corner of the triangle represents full electron transfer onto the solvent
At all points along the splitting process, the majority of the excess electron charge is localized on the dimer although there is a substantial leakage of the electron density onto the water. For points 1, 2 and 3 the average charge on the dimer is −0.6 and hence the water supports −0.4 of an elementary charge. The variation of the fraction of density-based charge on the solvent is quite wide, ranging from no transfer to almost complete transfer of the excess charge, as shown by the ternary plots in Fig. 10. In fact at the transition state there appears to be stronger fluctuations of the electron density onto the solvent. The standard deviations of the distributions of the total charge on the water at points 1, 2, 3 and 4 are: 0.14, 0.17, 0.14 and 0.14 respectively. This is reflected in the ternary plot of the transition state which exhibits a significantly greater spread onto the region near the top corner. As the system reaches the products at point 4, we observe further localization of the electron charge onto the dimer as it supports −0.72 of the total electron density. The ternary plots of Fig. 10 also describe how the total dimer charge is partitioned between the two bases at the four stages of the splitting process. In gas phase calculations using AM1 semi-empirical theory, Voityuk et al.23 found that the charge is localized on one base throughout the splitting process except at the transition state. Our density functional results in the presence of solvent indicate that the electron density is delocalized on both bases throughout all stages of the splitting process. This is consistent with recent work by Kawabata and co-workers41 who perform ab initio simulations of a gas phase thymine anion dimer with Hartree Fock and B3LYP electronic structure theory. They observe that the electron is approximately equally shared between both bases throughout the splitting of the C5-C5′ bond.
During the ~ 20ps sampling time to which we are limited to by the cost of ab initio simulations, the excess charged is trapped, or solvation occurs somewhat asymmetrically between the two bases. For example, we showed earlier in Fig. 3 that a single water molecule interacts with a carbonyl oxygen throughout the simulation time. Asymmetries due to limited sampling are also evident in the ternary plots of Fig. 10, and in the data of Tables 1 and 2 as described next. After much longer simulations, we would expect to sample configurations where the charge is localized on the other base or the pattern of solvation is reversed. We are unable to simulate these systems for the hundreds of picoseconds needed for the system to jump to configurations where the other carbonyl receives a hydrogen bond, rendering the sampling non-ergodic. Error bars shown in Table 1 and Table 2 are calculated using a standard blocking method.42 They indicate variability during the short runs feasible with the AIMD method but of course do not capture the error which arises from inability to sample processes whose time scale is longer than the simulation length.
Table 1.
Charge on carbon atoms: C5,C5′,C6,C6′. Error bars for each data set are estimated by the blocking method42 by partitioning each run into 4 blocks.
| Point | C5 | C5′ | C5+C5′ | C6 | C6′ | C6+C6′ |
|---|---|---|---|---|---|---|
| 1 | −0.08(0.013) | −0.23(0.004) | −0.31 | 0.14(0.005) | 0.31(0.003) | 0.45 |
| 2 | −0.13(0.014) | −0.18(0.011) | −0.31 | 0.09(0.016) | 0.23(0.027) | 0.32 |
| 3 | −0.07(0.009) | −0.12(0.009) | −0.19 | −0.09(0.016) | 0.01(0.007) | −0.08 |
| 4 | −0.04(0.009) | −0.17(0.012) | −0.21 | −0.13(0.024) | 0.08(0.014) | −0.05 |
Table 2.
Average number of water hydrogens near C5,C5′,C6 and C6′ carbons. Error bars for each data set are estimated by the blocking method42 by partitioning each run into 4 blocks.
| C5 | C5′ | C6 | C6′ | |
|---|---|---|---|---|
| 1 | 0.32(0.06) | 0.07(0.01) | 0.21(0.05) | 0.24(0.02) |
| 2 | 0.38(0.07) | 0.44(0.18) | 0.49(0.10) | 0.52(0.08) |
| 3 | 0.85(0.04) | 0.77(0.04) | 0.83(0.02) | 1.04(0.05) |
| 4 | 0.20(0.03) | 0.63(0.12) | 1.12(0.07) | 1.25(0.10) |
Rosch and co-workers23 were the first to point out the critical processes that occur at the C5,C6,C5′ and C6′ carbon atoms during the splitting process. Table 1 provides the average charges of the C5,C6,C5′ and C6′ carbon atoms and the combined C5,C5′ and C6,C6′ charge at the four points described earlier along the splitting of the C6-C6′ bond. On the anion surface the C5,C5′ carbon atoms, which incur initial cleavage, carry a substantial amount of excess charge. The C6,C6′ carbon atoms remain electron deficient at both points 1 and 2 by about 0.3–0.4 electron charges. The data shows that the electron deficiency of carbons C6 and C6′ reduces significantly after passage through the transition state. The number of water neighbors of a particular C5(C5′) or C6(C6′) carbon atom was counted by determining the number of water hydrogens that were within 3Å of the carbon atom. Table 2 gives the average number of water neighbors around each carbon atom. We observe that our equilibrium umbrella sampling simulations predict that as the C6-C6′ bond splits there is an increase in water density near the C6 and C6′ carbon atoms. Thus our simulations suggest that the splitting of the C6-C6′ bond is accompanied by non trivial changes in the local water density near the atoms undergoing splitting. The mechanistic implications of these effects for DNA repair are elaborated further in the next section with an analysis of non-equilibrium trajectories.
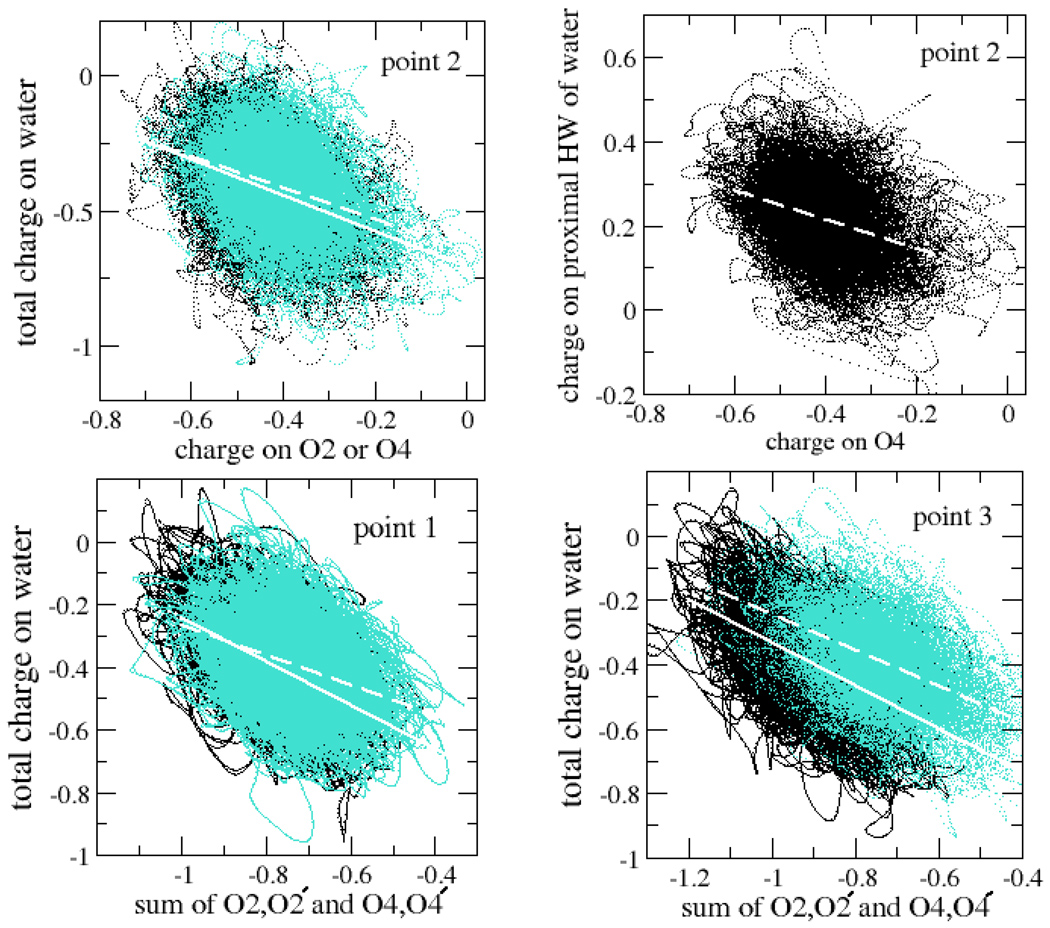
As indicated earlier, the electron density shows marked delocalization onto the solvent. In order to understand the mechanism of coupling better, the coupling of charge fluctuations of water and carbonyl oxygens are tracked in Fig. 11. Panel (a) in Fig. 11 exhibits the correlation between the O2 and O4 charges at the transition state and the total charge on the water. The O2 and O4 points lie roughly in ellipsoidal regions whose major axis have slopes −0.66 and −0.58, respectively, as estimated by the linear fits to the data points indicated in Fig. 11. In other words, as the charge on the O2 and O4 carbonyl oxygens fluctuates, on average 66% and 58%, respectively, of the change in oxygen charge is reflected in an opposite change in the total charge on water. Panel (b) indicates that a significant proportion of the charge exchange with the O4 atom involves the closest water hydrogen atom: On average 35% of change in the O4 oxygen charge is reflected in a compensating change in the charge of the proximal water hydrogen alone. Panels (c) and (d) in Fig. 11 depict the charge exchange between the O2/O2′ carbonyl oxygens and O4/O4′ oxygens at points 1 and 3. For the O2/O2′ oxygens 70% and 67% of a charge deviation on the O2/O2′ oxygens at points 1 and 3, respectively, were reflected in an opposite deviation of the total water charge. In contrast, 47% and 56% of a deviation of the O4/O4′ charge was reflected in an opposite deviation of the water. If the electron transfer to or from the dimer is mediated by the surrounding solvent, these results suggest that the carbonyl oxygens might play an important role in the process. They are also consistent with observations made by Truhlar and co-workers38 showing substantial CT in systems stabilized by hydrogen bonding.
Figure 11.
Charge coupling between carbonyl oxygens and solvent. The individual plots are discussed in the text. The degree of coupling of charge fluctuations is assessed using a linear fit to the data, which is indicated with a dashed line for O2/O2′ and a solid line for O4/O4′.
6 Molecular mechanisms of C6-C6′ Splitting
In section 5 we demonstrated that during the splitting of the C6-C6′ bond, the electron density on the C6 and C6′ carbon atoms increases. We also showed that the number of waters near the C6 and C6′ carbon atoms increases as the C6-C6′ bond splits. In this section we provide further evidence that the reaction involves a dynamical role for solvent. Unlike the C5-C5′ bond splitting, solvent participation in the reaction does not appear to change the effective free energy barrier for splitting of the C6-C6′ bond.
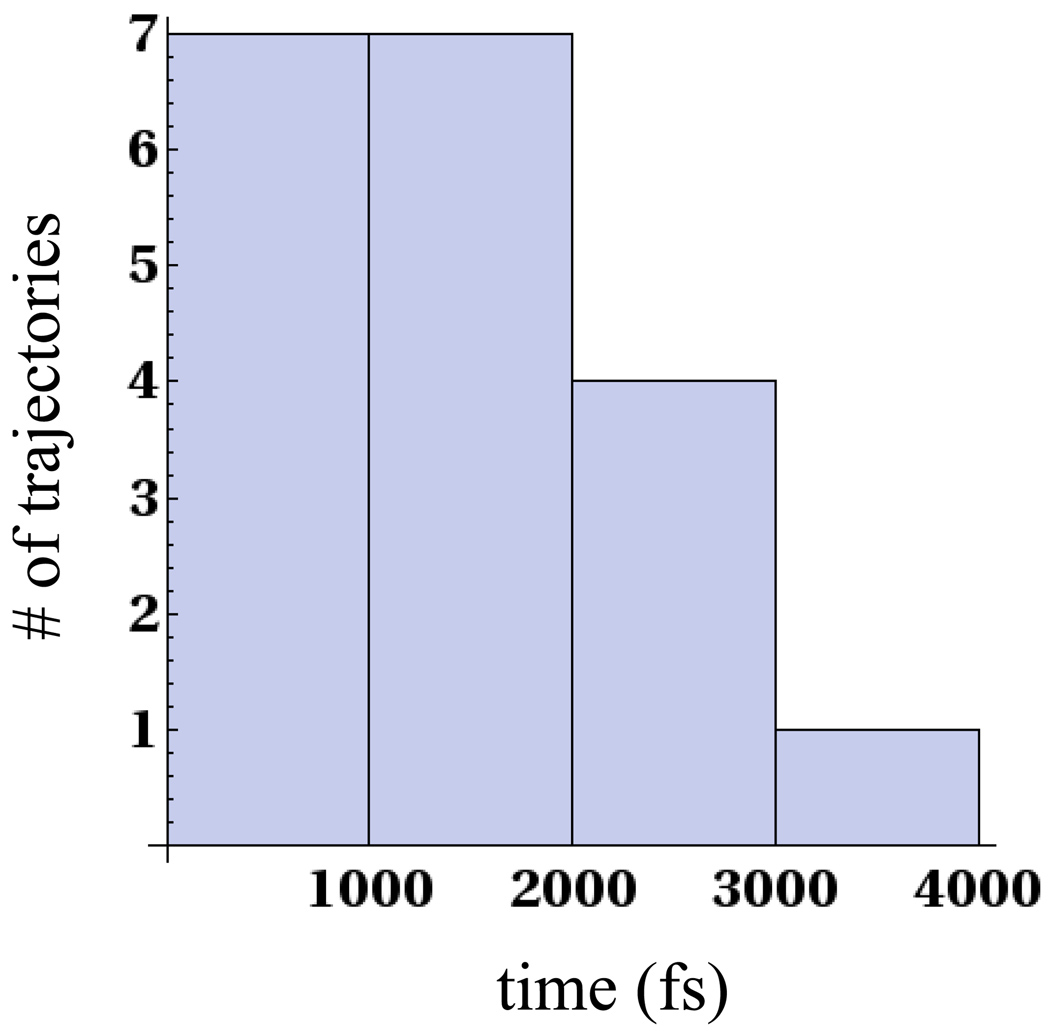
49 non-equilibrium trajectories were propagated from the partially cleaved minima where the C6-C6′ bond was intact, most of which were run for 4.5ps. The C6-C6′ bond for about 40% of these trajectories cleaved within this timescale. On the left panel of Fig. 12 we show the distribution of splitting times of the C6-C6′ bond for the non-equilibrium trajectories that split within 4.5ps. The results suggest that our TST prediction of the splitting time of the C6-C6′ bond overestimates the rate by a small amount. If the TST estimate of 0.5ps was to rigorously hold, approximately 63% of the 49 trajectories would split within 0.5ps. However, the distribution shown in Fig. 12 suggests that the splitting time of the C6-C6′ bond is within a few picoseconds (2–3ps) and our TST prediction performs quite well. In section 3 we observed that both the C5-C5′ and C6-C6′ bonds split for several trajectories that were begun at the nascent anion position. The splitting of both bonds in some of these trajectories could be characterized by non-equilibrium effects and TST theory might not be applicable.
Figure 12.
Figure shows the distribution of splitting times for trajectories that were begun in the partially cleaved minimum.
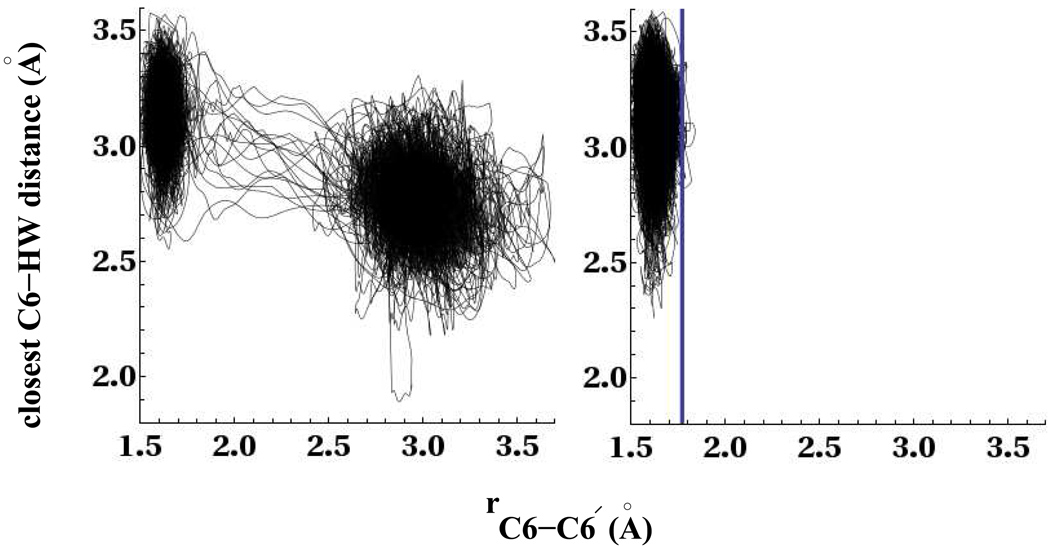
The left panel of Fig. 13 shows the relationship between the C6-C6′ bond distance and closest C6-HW distance for the trajectories whose C6-C6′ bond split within the timescale of our simulation. The figure shows that the splitting of the C6-C6′ bond is characterized by an increase in water density near the C6 carbon atom. These results are consistent with our equilibrium umbrella sampling results above in Table 2. The behavior is similar near the C6′ carbon atom so we only show the data for the C6 atom. On the right panel of Fig. 13 we show the closest C6-HW distance and C6-C6′ bond distance for those trajectories whose C6-C6′ bond did not split within 4.5ps. The vertical blue line shows the predicted TST C6-C6′ distance at 1.77Å. The figure also shows that there are a few trajectories that undergo recrossings at the TST without leading to cleaved photoproducts. The effect of recrossings can be considered as either a correction factor to the TST estimate, often expressed as the pre-exponential transmission factor that would correct for the recrossings, or an underestimation of the free energy barrier that results from a less than optimal choice of reaction coordinate.43 More sophisticated methods43 can be used to determine the transmission factor κ, but is beyond the scope of this study. Since the number of recrossings is small, they do not change the timescales of splitting by a significant amount for this CPD anion system.
Figure 13.
Left panel shows the evolution of the C6-C6′ distance with the closest water distance to the C6 atom for splitting trajectories. The right panel shows the same for trajectories that do not split within the timescale of our simulation runs. The vertical line in the right-hand plot indicates the transition state for splitting of the C6-C6′ bond.
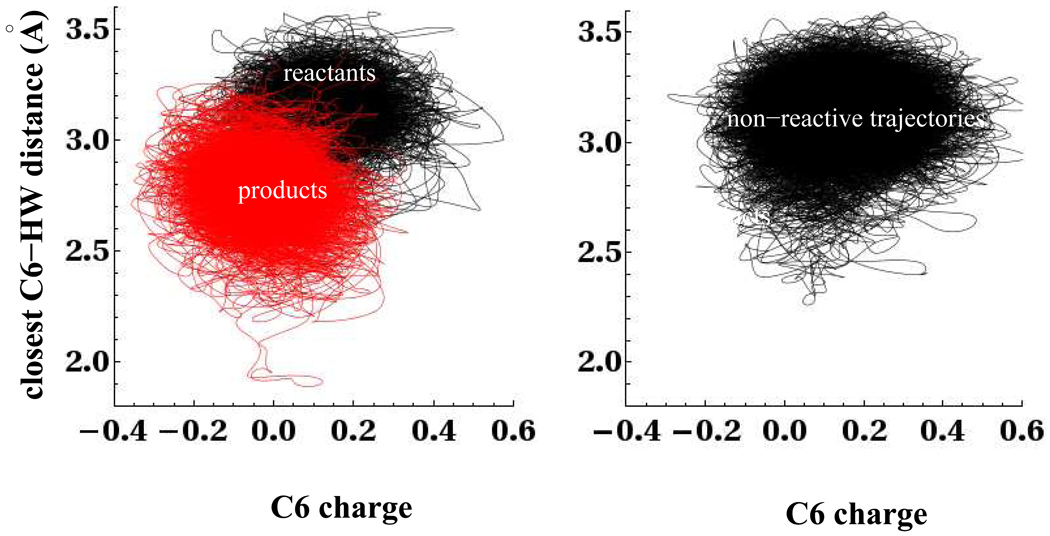
In our equilibrium umbrella sampling simulations shown in section 5, we showed that as the C6-C6′ bond splits, there was localization of electron density onto the C6 and C6′ carbon atoms (Table 1). Fig. 14 furnishes further evidence that the localization of charge onto the C6 and C6′ atoms is an important part of the splitting of the C6-C6′ bond. The left panel of Fig. 14 shows the distribution of the charge on the C6 carbon atom and the closest C6-HW water distance for the non-equilibrium trajectories propagated from the partially cleaved minima. The data shows that the splitting of the C6-C6′ bond involves a simultaneous increase in the electron density of the C6 carbon atom and the water density near the same atom. The data in the left panel of Fig. 14 is color coded in red for regions of the trajectories where the C6-C6′ bond distance is greater than 1.85Å, and in black when the distance is less than 1.85Å. The right panel of Fig. 14 shows the distribution of charge on the C6 carbon atom and the closest C6-HW water distance for those non-reactive trajectories that remain unsplit during the 4.5ps simulation running time. The data shows that the splitting of the C6-C6′ bond involves a shift in the average C6 charge toward more negative values. The distributions of charge and C6′ -HW distance show similar trends and are left out for brevity.
Figure 14.
Distribution of charge on C6 atom and closest water distance to C6 for both splitting and unsplitting trajectories. On the left, the red labels parts of the trajectory where rC6-C6′ > 1.85Å, while the black labels portions where rC6-C6′ < 1.85Å. The data in black on the right is for trajectories that remain unsplit during the 4.5ps run time.
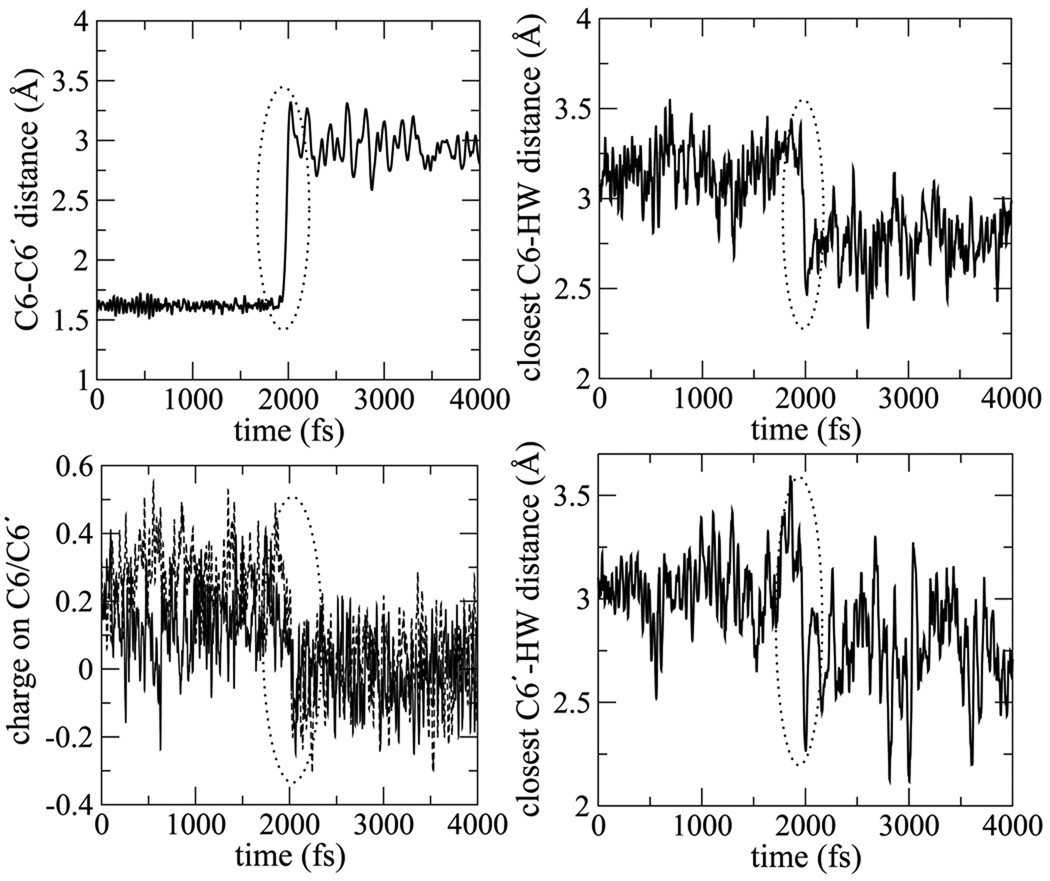
An analysis into the dynamics of the splitting process in the individual trajectories provides further illustrates the coupling of the dynamics of water, the C6-C6′ bond splitting and the increase in electron density of the C6(C6′) carbon atom observed in Figs. 13 and 14. The four panels in Fig. 15 show the evolution of the C6-C6′ bond, closest water to C6 and C6′ carbon and the charge on the C6(C6′) carbon atoms. The splitting of the C6-C6′ bond in this particular trajectory occurs at about 2ps. On that same timescale we observe the water near the C6 and C6′ move closer to it by about 0.5Å. Three other trajectories showing similar behavior are documented in the Supporting Information. They all exhibit similar behavior, and in aggregate they lead to the data shown in Figs. 13–14. Generally, we find that the C6 and C6′ charges become less positive as the C6-C6′ bond splits, although their timing is not as closely tied to bond splitting as is the closer approach of a nearby water. Our results show that the approach of a water to the carbon atoms is synchronized with the splitting of the C6-C6′ bond and does not appear to be simply an effect resulting from the C6-C6′ cleavage. As indicated earlier we have repeated some of our calculations with a larger box size consisting of the thymine dimer solvated by 64 waters. These results also confirm that the splitting of the C6-C6′ bond is synchronized with the close approach of a water molecule. (See Supporting Information for calculations performed with larger box size.)
Figure 15.
Top left panel shows C6-C6′ bond splitting over time, top right panel shows closest water distance to C6, bottom left shows charge on C6 and C6′ and bottom right shows closest water distance to C6′.
After analyzing several other trajectories similar to the ones shown in the text and in the Supporting Information, we find that the dynamics of the increase in electron density on the C6 and C6′ carbon atom can can range from either occurring simultaneously with the C6-C6′ bond splitting, to beginning almost a picosecond before the C6-C6′ bond splits. The results of Figs. 13–14 show that the splitting of the C6-C6′ bond is strongly coupled to the increase in local water density near the C6 and C6′ carbon atoms. Furthermore these processes are linked on the wide range of C6-C6′ bond splitting times. Our results are compatible with Masson et al.’s observation that the amino acids Arg350 and Arg232 in the active site of DNA photolyase may play an important role in triggering ring splitting either through direct hydrogen bonding with the thymine base or indirectly through hydrogen bonding with water molecules.7 Furthermore the dynamic evolution of the charge on the C6 and C6′ carbon atoms and the solvent motion suggests that the underlying energetics is more complex than a simple hydrogen bonding effect.
7 Conclusions
Ab initio MD simulations of the cyclobutane pyrimidine dimer (CPD) surrounded by 32 waters reported in our companion12 paper and this work, show that the splitting of the C5-C5′ and C6-C6′ bond in water is complete within several picoseconds. These results are consistent with recent simulations by Masson et al.6, 7 on dimer splitting for self-repair in DNA and in DNA photolyase. For both the splitting of the C5-C5′ and C6-C6′ bonds we find that the surrounding solvent appears to be coupled to the splitting process although more work is needed to understand the underlying coupling mechanism. This has important implications for the role of the surrounding amino acids in the active site of the protein and is consistent with femtosecond experiments that report dynamic active site solvation in photolyase.4, 44 Future experiments that involve site mutagenesis or selective deuteration of amino acids near the C6 and C6′ carbon atoms may reveal similarities between the splitting process in photolyase and in aqueous solvent.
The reaction in water is asynchronous because the C5-C5′ bond opens before the C6-C6′ bond. The two dimensional free energy surface with respect to the C5-C5′ and C6-C6′ bond lengths developed in our companion paper12 indicate that the reaction is concerted because the only significant reaction barrier is the one separating the partially cleaved (broken C5-C5′ bond) structure from the split products. There is a very small barrier along the way to the partially cleaved structure, but it is so small we would hesitate to claim that it defines a reaction intermediate. However, in this work we demonstrate that coupling to solvent can impart a stepwise character to CPD anion splitting. A significant number of non-equilibrium trajectories take on the order of a picosecond for cleavage of the C5-C5′ bond, which is not accounted for by the two-dimensional free energy surface in the C5-C5′ and C6-C6′ bond lengths. We have traced this to coupling of C5-C5′ bond cleavage to motion of neighboring water molecules, which can trap the system near free energy traps. Since the relevance of the solvent associated free energy barrier to C5-C5′ bond splitting depends on the configurational distribution created by forward electron transfer, and because the reaction is still quite fast and intermediates difficult to identify experimentally, it may be premature to call for a re-classification of the splitting reaction from concerted to stepwise. This will depend on factors outside the scope of this work, including the chemical identity of the electron donor. Since the dimer anion splitting time scale is so short, we speculate that, after forward electron transfer but before splitting, the system may not have enough time to relax in a local free energy minimum before splitting. Hence a quantitative description of the reaction may require treatment of non-equilibrium effects.
Because we treat both the CPD unit and the surrounding pocket of 32 waters quantum mechanically, we are able to address issues like charge transfer (CT) between the dimer and surrounding solvent. Our ab initio MD simulations show that there is a substantial amount of the CT from the dimer to the solvent throughout the splitting of both the C5-C5′ and C6-C6′ bonds. In this work, we have verified through quantum chemical cluster calculations, that the CT we observe in this anionic system, is not an artifact of DFT. Hartree-Fock theory, which does not suffer from the self-interaction error, still predicts a substantial amount of charge transfer to the solvent. Furthermore, benchmarks using the long range corrected density functional (LC-BLYP) that has been designed to overcome the problem of charge transfer artifacts which occur using standard density functionals, also show substantial CT from the dimer to the solvent. Focusing on several points along the splitting of the C6-C6′ bond, we find that before the reactants equilibrate into the split product well, the water supports 40% of the electron density. Upon reaching the split products, the electron density on the water reduces to 30%. Throughout the splitting process, the electron density is delocalized over both bases. This is consistent with recent ab initio gas phase simulations of the CPD with Hartree Fock and B3LYP levels of theory.41
Our simulations show that there is a considerable amount of reorganization of both the CPD unit and the surrounding solvent during the splitting of the C6-C6′ bond. During the splitting of the C6-C6′ bond we find that there is an increase in the electron density of the C6 and C6′ carbon atoms. We also find an increase in the water density near these atoms. This is verified in both our equilibrium umbrella sampling simulations as well as non-equilibrium trajectories. Speculating that amino acids in the active site may play a role analogous to water molecules in solution, this would suggest that the fast dynamical motions of the amino acids in the active site of the protein on the picosecond timescale, will play an essential role in biological repair of the anion CPD dimer.44 For similar reasons, we speculate that the adenine dinucleotide of the FADH cofactor in the active site of the protein might play an analogous role in the repair enzyme.4 Using TST theory we predict that the splitting time of the C6-C6′ bond to be ~ 0.5ps. This is strictly a lower bound to the splitting time but our non-equilibrium trajectories suggest that the TST estimate adequately predicts the splitting time for the C6-C6′ bond.
In conclusion, the results of the previous12 and current work provide important new insights into the mechanistic details of the DNA repair. The non-equilibrium trajectories propagated from the nascent anion where both the C5-C5′ and C6-C6′ bonds are intact, reveal that the initial conditions prior to electron transfer can change the splitting time of the C5-C5′ bond from the femtosecond to the picosecond timescale, although it is still a fast process. It is likely that corrections to transition state theory due to non-equilibrium effects will be required. Experimental validation of this mechanism will require sophisticated experiments that can probe the existence of the unsplit nascent anion population. Our calculations identify several crucial interactions between the dimer and aqueous solvent as essential for cleavage of the C5-C5′ and C6-C6′ bond.
Supplementary Material
Acknowledgments
This work was supported by the National Institutes of Health (GM074813-01A1). The calculations reported here were made possible by a grant of resources from the Ohio Supercomputer Center. A.A.H acknowledges Ya-Ting Kao and Xunmin Guo for fruitful discussions.
References
- 1.Sancar A. Biochem. 1994;33(1):2–9. doi: 10.1021/bi00167a001. [DOI] [PubMed] [Google Scholar]
- 2.Carell T, Burgdorf LT, Kundu LM, Cichon M. Curr. Opin. Chem. Biol. 2001;5(5):491–498. doi: 10.1016/s1367-5931(00)00239-8. [DOI] [PubMed] [Google Scholar]
- 3.Sancar A. Chem. Rev. 2003;103(6):2203–2237. doi: 10.1021/cr0204348. [DOI] [PubMed] [Google Scholar]
- 4.Kao Y-T, Saxena C, Wang L, Sancar A, Zhong D. Proc. Nat. Acad. Sci. U.S.A. 2005;102(45):16128–16132. doi: 10.1073/pnas.0506586102. [DOI] [PMC free article] [PubMed] [Google Scholar]
- 5.MacFarlane, Stanley RJ. Biochemistry. 2003;42(28):8558–8568. doi: 10.1021/bi034015w. [DOI] [PubMed] [Google Scholar]
- 6.Masson F, Laino T, Tavernelli I, Rothlisberger U, Hutter J. J. Am. Chem. Soc. 2008;130(11):3443–3450. doi: 10.1021/ja076081h. [DOI] [PubMed] [Google Scholar]
- 7.Masson F, Laino T, Rothlisberger U, Hutter J. ChemPhysChem. 2009;10(2):400–410. doi: 10.1002/cphc.200800624. [DOI] [PubMed] [Google Scholar]
- 8.Saettel NJ, Wiest O. J. Am. Chem. Soc. 2001;123(11):2693–2694. doi: 10.1021/ja005775m. [DOI] [PubMed] [Google Scholar]
- 9.Kim S-T, Rose SD. Photochem. Photobiol. 1988;47(5):725–729. [Google Scholar]
- 10.Song Q-H, Tang W-J, Hei X-M, Wang H-B, Guo Q-X, Yu S-Q. Eur. J. Org. Chem. 2005;2005(6):1097–1106. [Google Scholar]
- 11.Song Q-H, Tang W-J, Ji X-B, Wang H-B, Guo Q-X. Chem. Eur. J. 2007;13(27):7762–7770. doi: 10.1002/chem.200700251. [DOI] [PubMed] [Google Scholar]
- 12.Hassanali AA, Zhong D, Singer SJ. J. Phys. Chem. 2010 B. [Google Scholar]
- 13.CP2K website. http://cp2k.berlios.de.
- 14.VandeVondele J, Krack M, Mohamed F, Parrinello M, Chassaing T, Hutter J. Comput. Phys. Commun. 2005;167(2):103–128. [Google Scholar]
- 15.VandeVondele J, Hutter J. J. Chem. Phys. 2003;118(10):4365–4369. [Google Scholar]
- 16.Pulay P. Chem. Phys. Lett. 1980;73(2):393–398. [Google Scholar]
- 17.Pulay P. J. Comput. Chem. 1982;3(4):556–560. [Google Scholar]
- 18.Becke AD. Phys. Rev. 1988;A38(6):3098–3100. doi: 10.1103/physreva.38.3098. [DOI] [PubMed] [Google Scholar]
- 19.Lee C, Yang W, Parr RG. Phys. Rev. 1988;B37(2):785–789. doi: 10.1103/physrevb.37.785. [DOI] [PubMed] [Google Scholar]
- 20.Goedecker S, Teter M, Hutter J. Phys. Rev. 1996;B54(3):1703–1710. doi: 10.1103/physrevb.54.1703. [DOI] [PubMed] [Google Scholar]
- 21.Nosé S. Mol. Phys. 1984;52(2):255–268. [Google Scholar]
- 22.Hoover WG. Phys. Rev. 1985;A31(3):1695–1697. doi: 10.1103/physreva.31.1695. [DOI] [PubMed] [Google Scholar]
- 23.Voityuk AA, Michel-Beyerle M-E, Rösch N. J. Am. Chem. Soc. 1996;118(40):9750–9758. [Google Scholar]
- 24.Blöchl PE. J. Chem. Phys. 1995;103(17):7422–7428. [Google Scholar]
- 25.Hartman RF, Van Camp JR, Rose SD. J. Org. Chem. 1987;52(13):2684–2689. [Google Scholar]
- 26.Li T, Hassanali AA, Kao Y-T, Zhong D, Singer SJ. J. Am. Chem. Soc. 2007;129(11):3376–3382. doi: 10.1021/ja0685957. [DOI] [PubMed] [Google Scholar]
- 27.Li T, Hassanali AA, Singer SJ. J. Phys. Chem. 2008;112(50):16121–16134. doi: 10.1021/jp803042u. [DOI] [PMC free article] [PubMed] [Google Scholar]
- 28.Walker GC, Åakesson E, Johnson AE, Levinger NE, Barbara PF. J. Phys. Chem. 1992;96(9):3728–3736. [Google Scholar]
- 29.Reid PJ, Barbara PF. J. Am. Chem. Soc. 1995;99(11):3554–3565. [Google Scholar]
- 30.Mees A, Klar T, Gnau P, Hennecke U, Eker APM, Carell T, Essen L-O. Science. 2004;306(5702):1789–1793. doi: 10.1126/science.1101598. [DOI] [PubMed] [Google Scholar]
- 31.Voityuk AA, Rösch N. J. Phys. Chem. 1997;A101(44):8335–8338. [Google Scholar]
- 32.Harrison CB, ONeil LL, Wiest O. J. Phys. Chem. 2005;A109(32):7001–7012. doi: 10.1021/jp051075y. [DOI] [PubMed] [Google Scholar]
- 33.Mantz YA, Gervasio FL, Laino T, Parrinello M. J. Phys. Chem. 2007;A111(1):105–112. doi: 10.1021/jp063080n. [DOI] [PubMed] [Google Scholar]
- 34.Szefczyk B, Sokalski WA, Leszczynski J. J. Chem. Phys. 2002;117(15):6952–6958. [Google Scholar]
- 35.Tawada Y, Tsuneda T, Yanagisawa S, Yanai T, Hirao K. J. Chem. Phys. 2004;120(18):8425–8433. doi: 10.1063/1.1688752. [DOI] [PubMed] [Google Scholar]
- 36.Peraro MD, Raugei S, Carloni P, Klein ML. ChemPhysChem. 2005;6(9):1715–1718. doi: 10.1002/cphc.200500039. [DOI] [PubMed] [Google Scholar]
- 37.Thompson WH, Hynes JT. J. Am. Chem. Soc. 2000;122(26):6278–6286. [Google Scholar]
- 38.Marenich AV, Olson RM, Chamberlin AC, Cramer CJ, Truhlar DG. J. Chem. Theory Comput. 2007;3(6):2055–2067. doi: 10.1021/ct7001539. [DOI] [PubMed] [Google Scholar]
- 39.Nadig G, Van Zant LC, Dixon SL, Merz KM. J. Am. Chem. Soc. 1998;120(22):5593–5594. [Google Scholar]
- 40.van der Vaart A, M JMK. Int. J. Quantum Chem. 2000;77(1):27–43. [Google Scholar]
- 41.Tachikawa H, Kawabata H. J. Phys. Chem. 2008;B112(24):7315–7319. doi: 10.1021/jp801564t. [DOI] [PubMed] [Google Scholar]
- 42.Flyvbjerg H, Petersen HG. J. Chem. Phys. 1989;91(1):461–466. [Google Scholar]
- 43.Geissler PL, Dellago C, Chandler D. J. Phys. Chem. 1990;B103(18):3706–3710. [Google Scholar]
- 44.Chang C-W, Guo L, Kao Y-T, Li J, Tan C, Li T, Saxena C, Liu Z, Wang L, Sancar A, Zhong D. Nat. Acad. Sci. U.S.A. 2010;107(7):2914–2919. doi: 10.1073/pnas.1000001107. [DOI] [PMC free article] [PubMed] [Google Scholar]
Associated Data
This section collects any data citations, data availability statements, or supplementary materials included in this article.


