Abstract
Biological databases are an important resource for the life sciences community. Accessing the hundreds of databases supporting molecular biology and related fields is a daunting and time-consuming task. Integrating this information into one access point is a necessity for the life sciences community, which includes researchers focusing on human disease. Here we discuss the Ensembl genome browser, which acts as a single entry point with Graphical User Interface to data from multiple projects, including OMIM, dbSNP, and the NHGRI GWAS catalog. Ensembl provides a comprehensive source of annotation for the human genome, along with other species of biomedical interest. In this unit, we explore how to use the Ensembl genome browser in example queries related to human genetic diseases. Support protocols demonstrate quick sequence export using the BioMart tool.
Keywords: computer graphics, databases, genetic variation, genomics, cytogenetics, sequence homology, sequence alignment, informatics, computational biology
INTRODUCTION
The number of databases supporting molecular and cell biological research are growing. Starting with OMIM (Online Mendelian Inheritance in Man; Borate and Baxevanis, 2009), a collection of diseases and phenotypes in human developed in the 1970s, and moving up to the NHGRI’s recently developed GWAS (GenomeWide Association Studies) catalog (Hindorff et al., 2009), focusing on trait/disease-associated variations, the data available to the biological community are vast. Last year’s NAR database issue lists 1330 databases focusing on aspects of life sciences (Galperin and Cochrane, 2011).
However, challenges are presented in integrating these data into one single database, and/or graphical user interface such as a genome browser. Quality of information, data formats, and underlying sequences can differ, and the need for security in dealing with patient data present restrictions on data access (Horaitis and Cotton, 2005). The necessity of integrating information from disparate sources is clear, and projects are currently underway to standardize data formats (Dalgleish et al., 2010). The ability to access effects of sequence variation on genes, protein products, and diseases or phenotypes from one central point would allow faster integration and understanding of the effect of sequence variation on organisms, fueling fields such as pharmacogenomics (UNIT 9.19).
Genome browsers (the UCSC genome browser, NCBI Map Viewer, and the Ensembl genome browser) provide useful tools for data access from different sources. In this protocol, we focus on the Ensembl graphical user interface at http://www.ensembl.org. From sequence variation associated with human disease, to conserved genomic regions calculated from multispecies alignments, we present a how-to guide to accessing data that supports research and understanding, using the Ensembl genome browser.
Basic Protocol 1 takes a variation-centric view of genome browsing. We enter the browser by searching for a single nucleotide polymorphism (SNP) associated with hereditary hemochromatosis. This SNP is nonsynonymous in ten splice variants of the HFE gene. Navigation through the variation views for this SNP reveals the risk allele (A), individual genotypes, and the phylogenetic content (see Internet Resources) summary.We also view expression data for the HFE gene stored in the ArrayExpress database (Parkinson et al., 2009).
In Basic Protocol 2, we enter the genome browserwith a sequence. The Ensembl BLAST-Like Alignment Tool (BLAT; Kent, 2002) is used to position a short oligonucleotide sequence within the human genome, allowing identification of variations and genes (the MYC gene) corresponding to this sequence. The focus of this protocol is on location views, showing a region of the genome. Tissue-specific methylation patterns in this region are also examined.
Basic Protocol 3 explores functional information for the protein product of a human oncogene in the RAS superfamily of GTPases, HRAS, using gene ontology. The individual sequences of J.Watson (Wheeler et al., 2008) and C. Venter (Levy et al., 2007) are compared to the reference sequence. Linkage disequilibrium (LD) of associated variations are viewed as LD plots, and exported.
Basic Protocol 4 explores a region of the genome. We investigate the basis for a predicted regulatory sequence in a highly conserved region.
Support Protocols 1 and 2 focus on the export of sequences from the browser, and present the BioMart data-mining tool as an option to quickly export sequence and other gene annotation.
Please note that the discussion in this unit pertains to Ensembl version 60. Refer to our archive site at http://Nov2010.archive.ensembl.org/index.html for consistency.
BASIC PROTOCOL 1
EXPLORING AN SNP ASSOCIATED WITH HEMOCHROMATOSIS
Views: Variation tab (gene/transcript, individual genotypes, phenotype data), Gene tab (gene summary, external data: gene expression atlas).
In this protocol, we enter the Ensembl genome browser by searching with the dbSNP ID rs1800562 (Benyamin et al., 2009). This is the identifier for an SNP associated with hereditary hemochromatosis, a disease in which iron is not metabolized. This SNP has also been reported in the literature as C282Y, referring to the nonsynonymous status of this variation, which codes for cysteine or tyrosine (Cullen et al., 1999; Lucotte and Dieterlen, 2003).
The search function is the main entry point to the Ensembl genome browser; searching is described in more detail elsewhere (see Basic Protocol 1 in Fernández-Suárez and Schuster, 2010). A search can be performed using a gene symbol, name, or description; an identifier from a public sequence database such as UniProtKB or NCBI Entrez Gene; a gene ontology term from the GO project (Ashburner et al., 2000); a protein domain; a disease; or, as in Basic Protocol 1 of this unit, a variation.
Materials
A computer with a connection to the Internet
An up-to-date Web browser that supports JavaScript, such as Firefox, Safari, or the most recent version of Internet Explorer (at the time of writing, IE7 and IE8)
Getting started
-
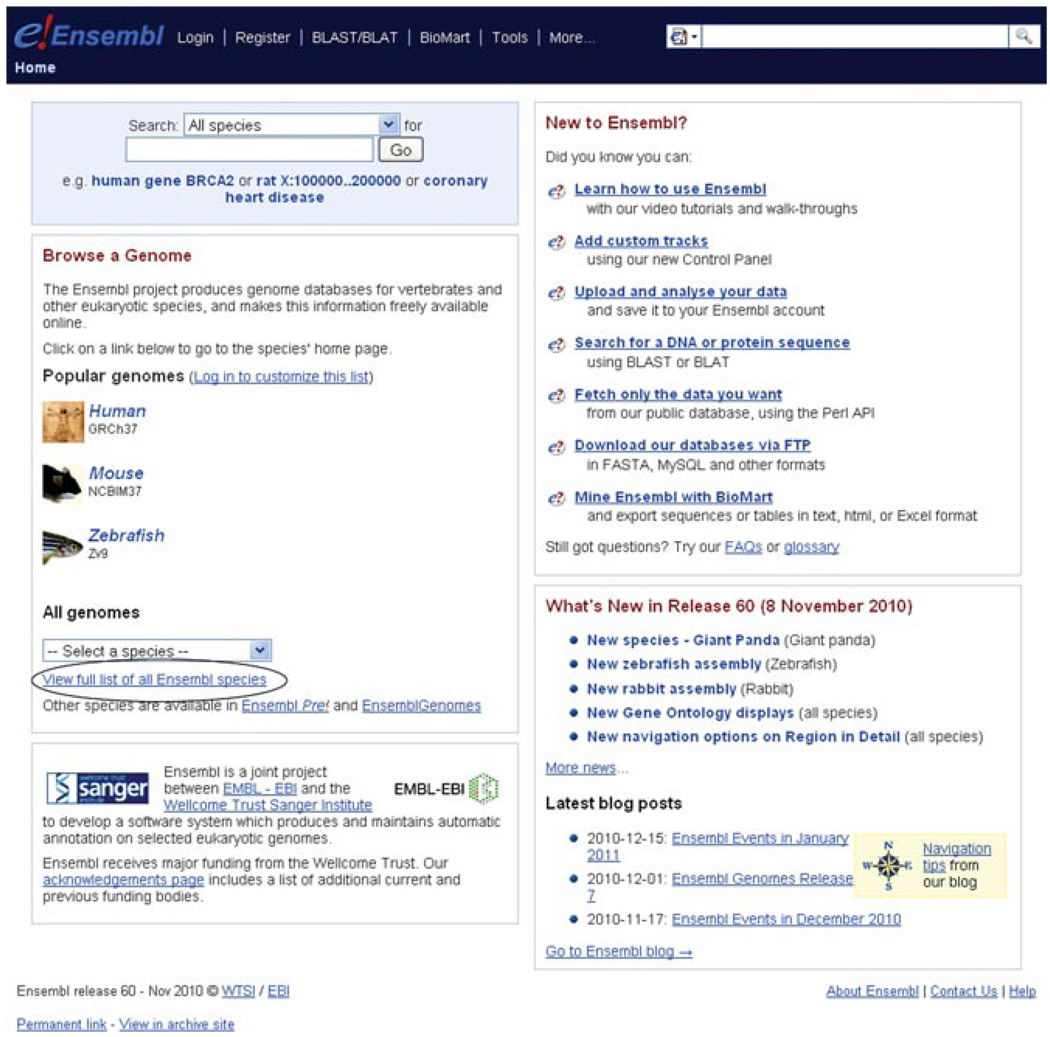
1.Go to http://www.ensembl.org, the Ensembl home page.The Ensembl home page (Fig. 6.11.1) provides links to all genomes housed in Ensembl, which include nearly 50 vertebrate species.The “view full list of all Ensembl species” link (circled in Fig. 6.11.1) allows access to a sister project focusing on invertebrates.Data for the Ensembl site are updated regularly. News for the latest update (or release) is shown at the bottom right of the home page.Species-specific news can be obtained by choosing a species from the drop-down menu in the “All genomes” section of the home page. Click on Human to go to the human index page. Click on What’s New at the left of the human home page to see human-specific updates in the current release.
-
2.Type rs1800562 into the text search box. Click Go.Sources of variations for human include NCBI dbSNP (Sayers et al., 2009), Affymetrix, and Illumina, and individual sequences (J. Watson and C. Venter). Variations in Ensembl are preferentially assigned a dbSNP identifier. If there is no dbSNP record for a variation, either the identifier from the contributing source is used, or, in the case of the alignment with Watson and Venter’s sequences, Ensembl assigns an ID (Chen et al., 2010).
-
3.
Click on “Variation,” which shows 1 hit. Alternatively, click on “Homo sapiens” at the right of the page, also showing 1 hit.
-
4.
Click on “Homo sapiens” (or if you chose to click on “Homo sapiens” in step 3, click on “SNP”). Further click either “SNP (1)” or “Homo sapiens (1).”
-
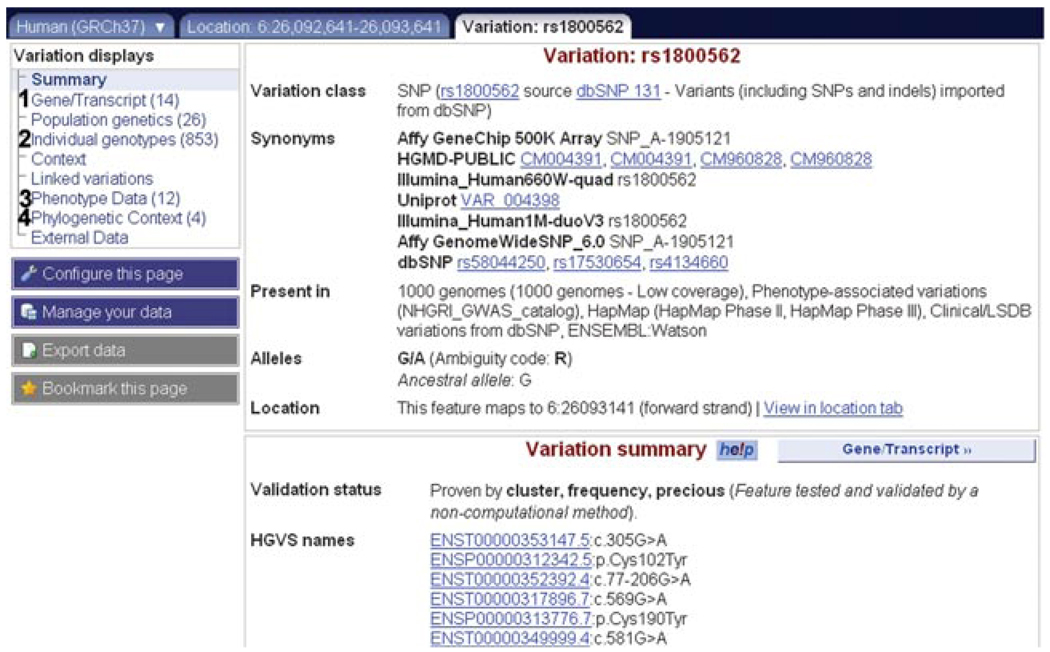
5.On the Result in Detail page which then appears, click on the hit “dbSNP Variation: rs1800562.”You should now be in the variation tab for rs1800562 (Fig. 6.11.2). Links at the left lead to information specific to this variation. The location tab will also be showing. In the location tab, you can explore a region of the genome. We will explore this tab, along with the gene and transcript tabs (not shown here), in Basic Protocol 2.The variation summary view(Fig. 6.11.2),which you should be currently looking at, shows the source(s) of the variation. A link to the dbSNP record is provided under “Variation class.” Synonyms, or other sources including this variation, are listed below the dbSNP ID. For example, rs1800562 is mapped in the Affymetrix GeneChip 500K Array, two Illumina arrays, and also UniProt. Also shown in the summary are links to linkage disequilibrium plots, and the flanking sequence, with the variation marked in red.
Figure 6.11.1.
The Ensembl home page at http://www.ensembl.org. A link to all available vertebrate and invertebrate species is circled in the figure. News for each release is shown at the bottom right hand corner of the page, and older releases can be accessed through the “View in archive site” link at the very bottom left.
Figure 6.11.2.
The variation tab for rs1800562. Ensembl genes and transcripts containing this variation are available through the Gene/Transcript link (1), genotype information for this variation can be accessed by “Individual genotypes” (2), phenotypes associated with rs1900562 through the GWAS catalog are shown in the Phenotype Data view (3), and external data in DAS format (SNPedia) can be accessed using the External Data link (4). For color version of this figure go to http://www.currentprotocols.com/protocol/hg0611.
The variation tab
-
6.Click on the link at the left named Gene/Transcript (Fig. 6.11.2, labeled “1”).There are fourteen transcripts associated with this variation. Human Ensembl transcript IDs begin with ENST, which is followed by a unique, eleven-digit number. Ensembl transcripts that overlap in coding sequence are assigned to the same gene identifier (ENSG …). This view shows that ENSG00000010704 is the only gene associated with rs1800562.The SNP is nonsynonymous in ten of the transcripts shown. The position in the transcript, counting from the transcript start site, is given where applicable. For example, in the transcript, ENST00000397022, the SNP position in the transcript is 936 bp.The amino acid positions of both synonymous and nonsynonymous coding variations are displayed in a column at the right of the table. For ENST00000397022, the SNP is located at amino acid position 259.The protein alleles are also listed; e.g., in ENST00000397022, the amino acid at position 259 is either a cysteine (C) or tyrosine (Y). This SNP was first identified in the literature as C282Y. Only two of the transcripts, ENST00000357618 and ENST00000309234, encode proteins with the variation at this position. This represents one challenge in transferring variations reported in the literature to positions on genes, transcripts, or the genome. Often, the literature reports the position on one transcript, and it is not always clear which transcript was examined. Indeed, at the time of discovery of the variation, only one transcript for a gene may have been known.For more variation positions and effects (including splice site and stop gained/lost), see Chen et al. (2010).
-
7.Click on the link at the left named “Individual genotypes” (Fig. 6.11.2, labeled “2”).Rs1800562 has been genotyped in 853 subjects. Populations analyzed by a variety of projects that submitted genotype information into dbSNP are shown at the right, in the “Populations” column. For example, the Windber Research Institute is listed in the table as a source of genotype data. Click on the links to find the original entries submitted into NCBI dbSNP.The majority of the genotyped individuals are G|G. This can also be seen in the “Population genetics” link.
-
8.Click on the link at the left named Phenotype Data (Fig. 6.11.2, labeled “3”).The strongest risk allele for several phenotypes is “A.” The phenotype relationships are taken from the NHGRI GWAS catalog. Compare this with the genotype found in the “Individual genotypes” or “Population genetics” view discussed in step 7, to deduce that the A allele is quite rare, at least in the populations studied.
-
9.Click “Linked variations” at the left (Fig. 6.11.2).Linkage disequilibrium expressed as r2 and D′ values are shown for different populations (e.g., HapMap groups). No data are shown for rs1800562 in version 60; however, look for variation rs1333049 for an example with linkage data.
-
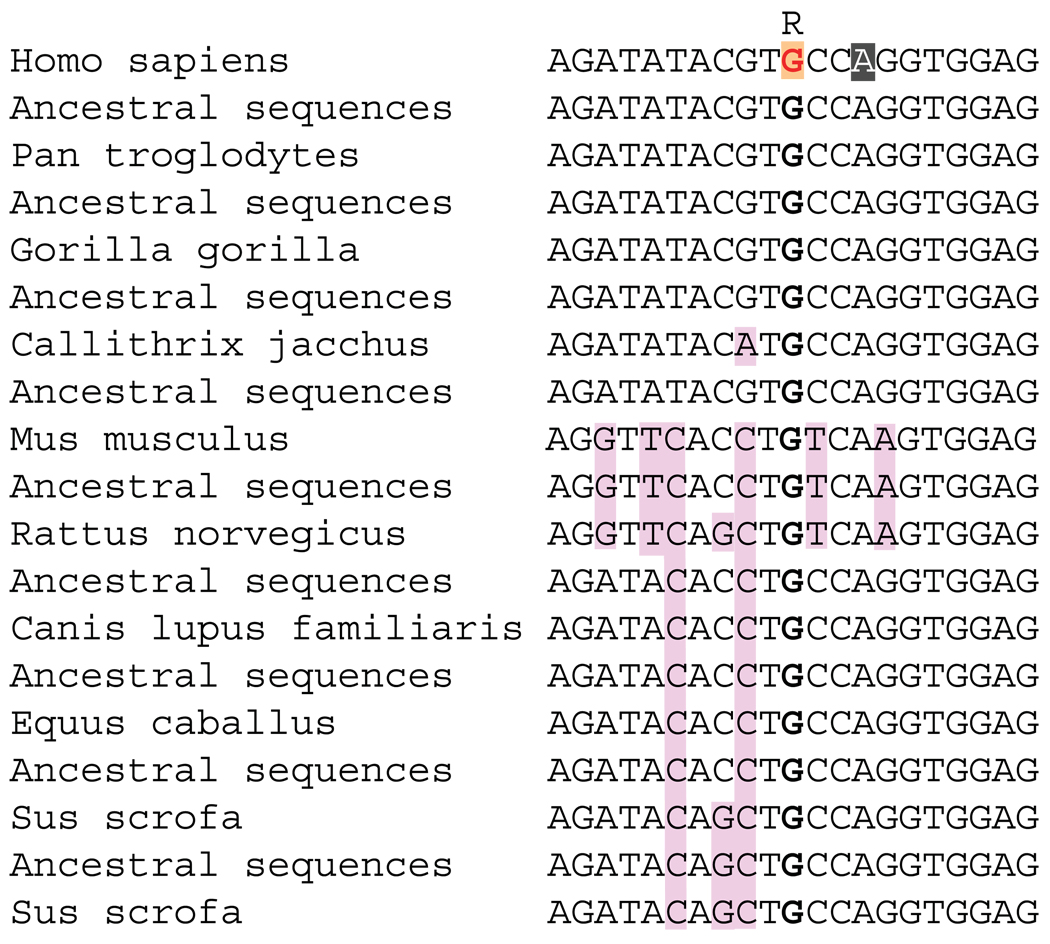
10.Click on the link at the left named Phylogenetic Context (Fig. 6.11.2, labeled “4”). Open the pull-down menu on the screen to “Select an Alignment.” Choose “12 eutherian mammals EPO” and click Go.The phylogenetic context view shows the nucleotide for other species that align in this region. Multiple genome alignments across 12 eutherian mammals were calculated by the Ensembl Compara team using the EPO pipeline (Fig. 6.11.3).
Figure 6.11.3.
Phylogenetic content for rs1333049. Variations are highlighted within the mammals in the alignment. The view is centered on rs1333049 in human.
External information in the gene tab
-
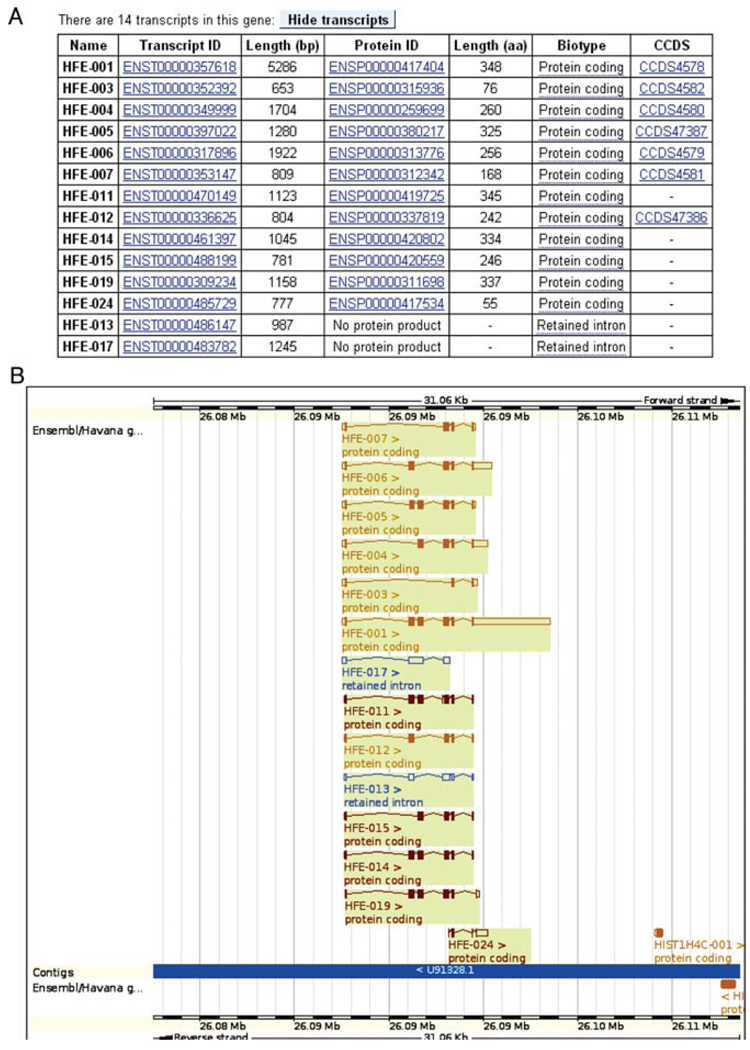
11.Go back to the Gene/Transcript link (step 6). Click on any of the links for the gene ID (ENSG00000010704) to go to the Gene tab. Click on Gene Summary at the left.The top panel of all “Gene” pages displays basic information, such as the gene name (HFE), the stable identifier (ENSG0000010704), and the genomic location, which is chromosome 6, base pairs 26,087,509-26,098,571 (from the start of the chromosome). The forward strand of the chromosome is indicated. A table lists all alternative splice variants for this gene and their corresponding protein products (Fig. 6.11.4A).The bottom panel of the “Gene” page shows a graphic of all transcript variants of this gene in their genomic context (Fig. 6.11.4B).Transcripts are color-coded, depending on how they are determined. Red indicates protein-coding transcripts that have either been annotated automatically (Ensembl) (Curwen et al., 2004) or manually (HAVANA; Wilming et al., 2008), while gold indicates protein-coding transcripts where automated and manual annotation lead to the same results (Ensembl-HAVANA merge). These “gold transcripts” have a higher probability of being correct, as two independent annotation methods (the Ensembl automatic annotation pipeline and HAVANA manual annotation) lead to the same transcript structure.A second measure of quality is found in the CCDS set (Pruitt et al., 2009a). The transcript table (Fig. 6.11.4A) indicates which transcripts have a consensus coding sequence agreed upon by Ensembl and RefSeq (Pruitt et al., 2009b). HAVANA and UCSC (Karolchik et al., 2009) are consulted when there are discrepancies in these transcripts.Blue transcripts in the diagram are noncoding, and are listed as such in the table. In the case of HFE, in release 60, seven protein-coding transcripts are agreed upon by Ensembl and HAVANA (gold transcripts), five protein-coding transcripts are from one source only, either Ensembl or HAVANA (red), and two transcripts are noncoding (blue). The seven gold transcripts have a CCDS identifier, meaning they are also agreed upon by NCBI and UCSC. Transcript names with a number beginning with “0” are manually curated by the HAVANA project, while those starting with “1” are from the Ensembl pipeline. Thus, all the red transcripts are from HAVANA (HFE-011, HFE-014, HFE-015, HFE-019, and HFE-024). The GENCODE set currently includes both HAVANA manual annotation and Ensembl automatic annotation, with the aim of representing all human transcripts. (Searle et. al., 2010).
-
12.
Click the External Data link at the left. Click the “Configure this page” button. Select the Gene Expression Atlas, then close the dialog.
-
13.Click on the new “Gene Expression Atlas” link at the left of the Gene page which now reloads (Kapushesky et al., 2010).This link shows data from the ArrayExpress project, housed at the EBI. The Gene Expression Atlas contains curated data showing individual gene expression across experiments, and across biological conditions.In this case, we can see the HFE gene is expressed in different organs (such as skeletal muscle and the pancreas). In some conditions, it is found to be over-expressed, and in others it is under-expressed.
Figure 6.11.4.
(A) Transcript table in the gene tab for the human HFE gene. Fourteen transcripts are shown. The twelve protein-coding transcripts are listed first. Seven transcripts are found in the CCDS set, and all transcripts have been identified by manual annotation (the HAVANA project), as indicated by transcript numbers beginning with “0.” (B) Transcript diagrams in the gene summary view in the gene tab. Gold transcripts are agreed upon by HAVANA and Ensembl automatic annotation. Boxes are exons, and connecting lines are introns. Filled boxes show coding sequence, while unfilled boxes indicate untranslated sequence (UTR). Transcripts are on the forward strand of the chromosome, as they are drawn above the blue line corresponding to the assembly. A greater than or less than sign after the transcript identifier indicates the strand by showing direction of translation. For color version of this figure go to http://www.currentprotocols.com/protocol/hg0611.
BASIC PROTOCOL 2
EXPLORING A NONSYNONYMOUS VARIATION IN THE MYC GENE
Views: BLAT, Location [“Region in Detail,” Alignments (text)] Variation (Population genetics, Gene/Transcript) Gene (Variation Image, Variation Table) Transcript (cDNA).
Studies using the oligonucleotide sequence:
5′-GATGCCCCTCAACGTTAGCTTCACCAACAGGAGC-3′
show hybridization to genomic DNA from diseased human cells, and no hybridization to wild-type human cells (under stringent conditions). Assume that you suspect at least one mutation in this sequence.
In this protocol, we use BLAT to align the oligonucleotide to the genomic sequence. The MYC gene, which overlaps with this sequence, is investigated, and a variation mapping to this sequence is identified. We discuss the potential effect of the variation on protein signatures and DNA methylation sites.
Materials
A computer with a connection to the Internet
An up-to-date Web browser that supports JavaScript, such as Firefox, Safari, or the most recent version of Internet Explorer (at the time of writing, IE7 and IE8)
Getting started
-
1.Go to http://www.ensembl.org, the Ensembl home page (Fig. 6.11.1). Click on the BLAST/BLAT link at the top right of the page.BLAT is the default alignment program in Ensembl. BLAT runs quickly, and is best for aligning sequences that will have an exact match. BLASTN and TBLASTX are also available for nucleotide searches, and are recommended for sequence alignments where gaps and/or mismatches are expected. BLASTP and TBLASTN are available for protein queries.
-
2.Paste GATGCCCCTCAACGTTAGCTTCACCAACAGGAGC into the query sequence box.Alternate entries into the BLAST program include a sequence ID or accession number, or an existing ticket ID.
-
3.
Use the default settings: “Homo sapiens, Latest GP” (which is the unmasked genome), and BLAT. Click RUN.
-
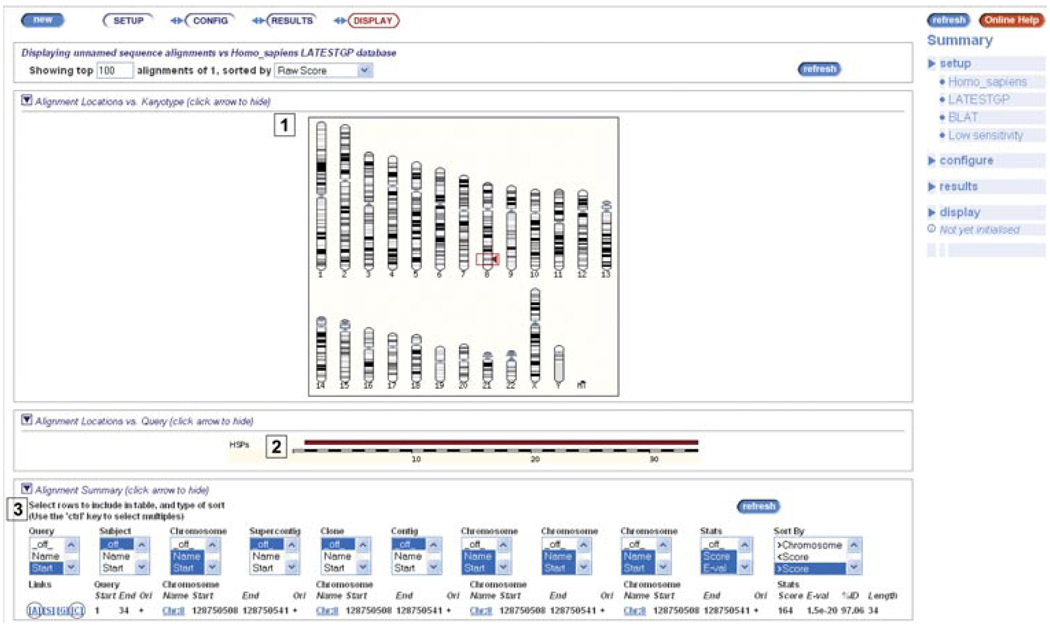
4.Examine the results (Fig. 6.11.5).The human karyotype is shown (Fig. 6.11.5, labeled “1”), with the best hit boxed. In this case, there is only one hit to chromosome 8. Look down the page (Fig. 6.11.5, labeled “2”). The high-scoring pair (HSP) is diagrammed in red along the query sequence, which is drawn as white and black blocks. This HSP appears to align with most if not all of the query sequence.Further down the page is a hit table (Fig. 6.11.5, labeled “3”). This table is customizable. By default, the score, E-value, %ID, and length are shown. In this case, the hit has a score of 164, a low E-value (reflecting the % chance that the hit is random), a high %ID, and a length nearly matching the query (remembering that the query sequence is only 34 nucleotides long.)
-
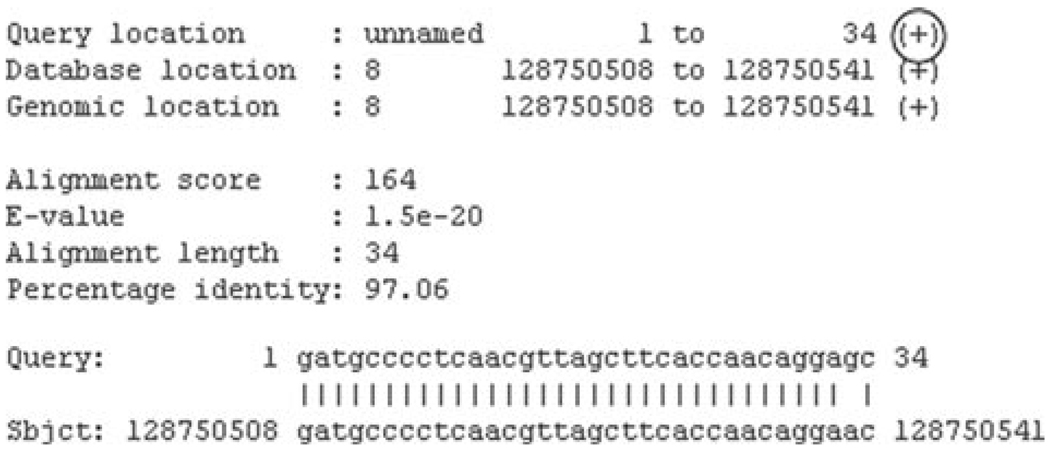
5.Click the “A” link in the alignment table (Fig. 6.11.5, circled).The alignment between the query sequence and the genomic sequence (chromosome 8, base pairs 128750508 to 128750541) shows only one mismatch (Fig. 6.11.6). The “g” at base pair 33 in the query sequence does not match the “a” at base pair 128750540 in chromosome 8. The + (Fig. 6.11.6, circled) denotes the positive strand, meaning the query sequence aligns to the positive, or forward, strand of chromosome 8.
-
6.
Click the tab with the BLAST results (it should still be open). Click the “C” link in the alignment table (circled in Fig. 6.11.5).
Figure 6.11.5.
Sequence alignment of a short query sequence to the human genome using BLAT. (1) Matches on the human karyotype are indicated by filled triangles, with the best match boxed. (2) The query sequence is drawn in an alternating black and white “racetrack.” High-scoring pairs (HSP) are drawn along the query. In this case, one HSP matches the full length of the query. (3) A table of BLAT hits is shown. Links to the sequence alignment (A) and a graphical view of the BLAT hit (C) are circled in the diagram. For color version of this figure go to http://www.currentprotocols.com/protocol/hg0611.
Figure 6.11.6.
Alignment of the query sequence to chromosome 8 on the human genome. Clicking on “A” (circled in Fig. 6.11.5) reveals this view. The positive signs (circled) indicate the forward strand of the chromosome. A mismatch is seen in the 33rd nucleotide of the query sequence.
Viewing a chromosomal region
-
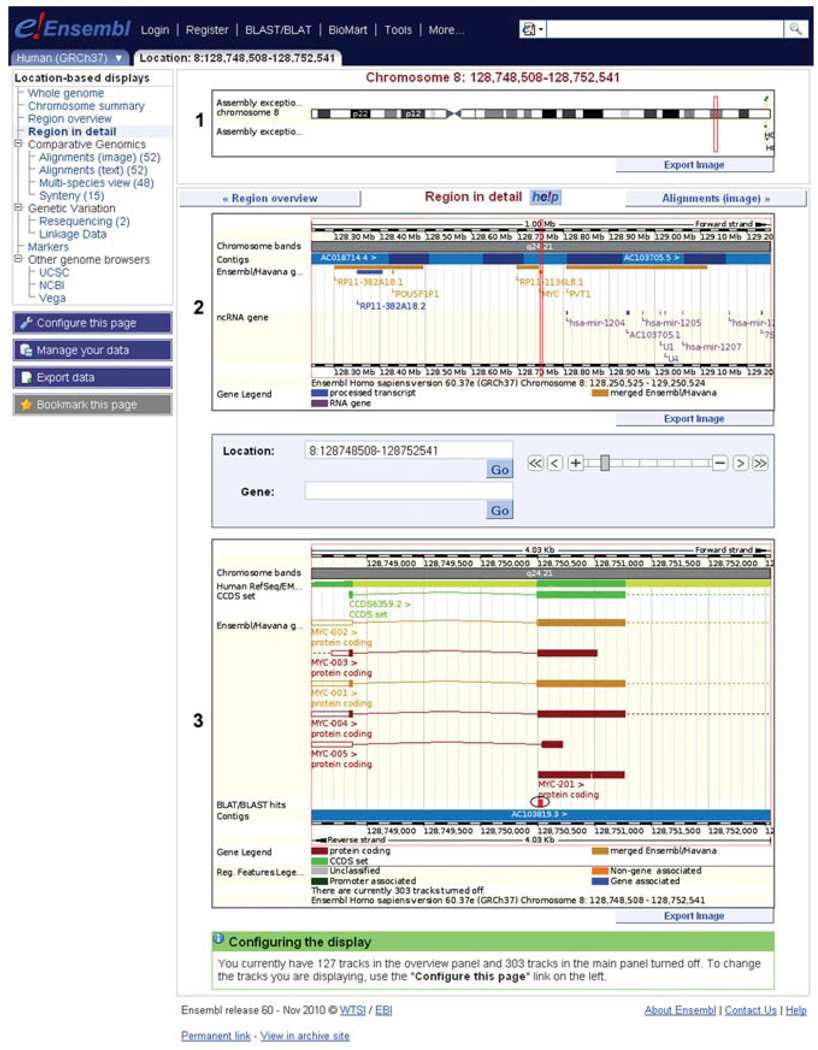
7.You should now be in “Region in detail,” a view accessible in the Location tab (Fig. 6.11.7).The “Region in detail” view is divided into three panels representing different zoom levels into the genome sequence. A red box outlines the extent of the region displayed in the panel one level below. The red box in chromosome 8 (Fig. 6.11.7, labeled “1”) outlines 1 Mb of sequence, and is expanded in the “top panel” (Fig. 6.11.7, labeled “2”). The red box in panel 2 is expanded to show sequence encoding the MYC gene in the “main panel” (Fig. 6.11.7, labeled “3”).Genome sequence annotation is organized in tracks and the entire data display is highly customizable using the configuration dialog. Individual tracks can be added or removed from the display, and the genome sequence region can also be zoomed in and out over a broad range.Click on a track name for information about the source of the track.
-
8.Take a look at the chromosome diagram (Fig. 6.11.7, labeled “1”).The uppermost panel shows an ideogram of the entire chromosome, indicating centromeric and telomeric regions, as well as the cytogenetic banding pattern, if one has been established for the species. Bands are labeled if space permits. The red box marks the indication of any gene you were previously browsing, or the center of the view (in this case, it is determined by our BLAT hit).
-
9.Now, inspect the “Top panel” (Fig. 6.11.7, labeled “2”).The top panel below the chromosome diagram provides an overview of a 1-million base-pair region for vertebrate species, or a 0.5-million base-pair region for other species with denser genomes. For a larger region of the genome, click on “Region overview” at the left of the page. The top panel is centered on the gene of interest (or in this case, our BLAT hit). A scale bar in the top panel illustrates the physical map coordinates for the region. The “Contigs” track indicates in alternating light and dark blue color the individual sequences that form the genome sequence assembly. Greater than or less than signs provide information regarding in which orientation a sequence region has been incorporated into the genome sequence. For human, mouse and zebrafish, the assembly almost exclusively comprises bacterial artificial chromosome (or BAC) clones, which are also stored in the EMBL, GenBank, and DDBJ nucleotide repositories. BAC clones are labeled with accession numbers assigned by these public nucleotide sequence archives, and can be shown in the “Main panel” of this display.By default the top panel also provides a graphic of Ensembl and HAVANA genes, as well as noncoding RNA genes and immunoglobulin and T-cell receptor genes that have been annotated in this region. Clicking any of these gene names provides more information about a particular gene, along with links to Gene pages.
-
10.Look at the Main panel (Fig. 6.11.7, labeled “3”).The main panel provides the finer details of the genome sequence and its annotation down to the base-pair level. The main panel of the display is highly configurable, in that many tracks can be added, representing features of various types that Ensembl annotates on a genome-wide scale. In contrast to the top panel, the main panel can be zoomed in a range from a single base pair up to 1 million base pairs. The sequence can be viewed all the way up to a 1-Mbp overview of genes and other annotation.As in the gene summary described in Basic Protocol 1, features shown above the genome sequence (blue bar) are annotated on the forward strand, while those shown below are on the reverse strand. Nonstranded features would be shown at the top (e.g., whole genome, multiple sequence alignments, and conservation scores) or bottom of the panel (e.g., pairwise conserved blocks and genetic variation information).
-
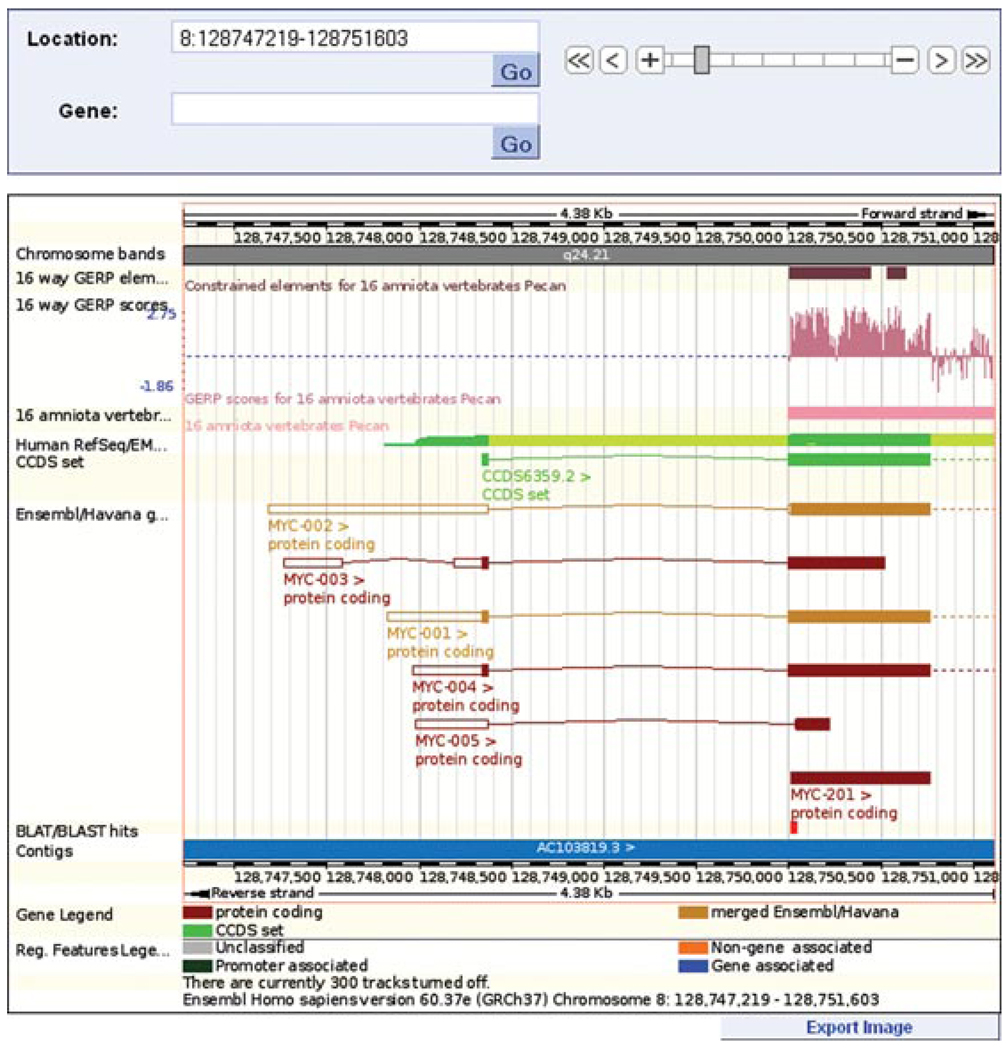
11.View the BLAT hit (Fig. 6.11.7, circled).While the top panel shows genes, the main panel shows individual transcripts color-coded according to the description in Basic Protocol 1, step 11. Six transcripts of the MYC gene are shown in the view.The BLAT hit (red-filled rectangle, circled in Fig. 6.11.7) aligns to the 5′ end of one MYC transcript, MYC-201, determined by the Ensembl annotation pipeline. A UTR has not been annotated in this transcript based on the evidence available.Two gold transcripts (HAVANA/Ensembl merges) are also shown (MYC-001 and MYC-002). The BLAT hit aligns to coding sequence (filled boxes) in these two transcripts. The dotted lines extending out of the view indicate that MYC-001 and MYC-002 are not fully shown.
-
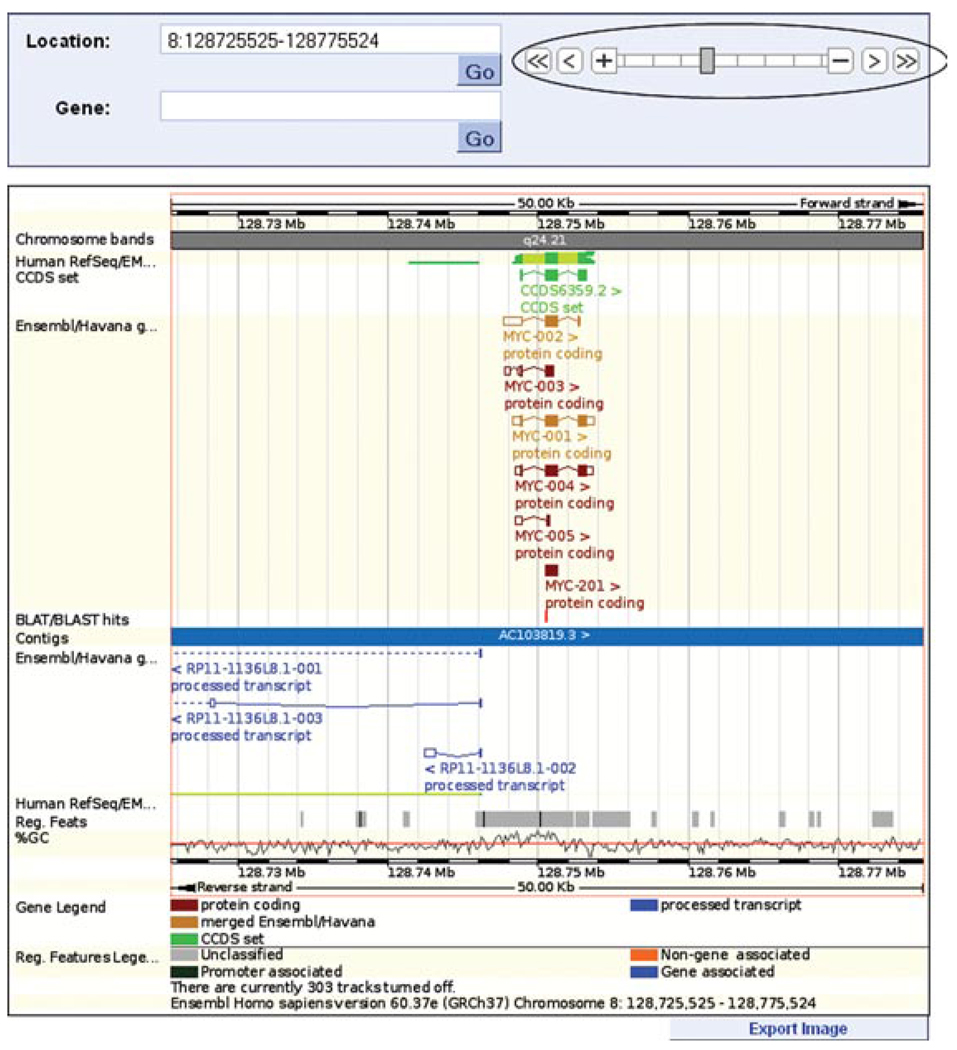
12.Use the zoom (circled in Fig. 6.11.8) to zoom out one step, in order to see the full MYC transcripts.Now that we are looking at a larger region, let us look at the tracks turned on by default (Fig. 6.11.8).Alignments of cDNA/mRNA sequences in the NCBI RefSeq set and in EMBL-nucleotides (Sterk et al., 2007) are shown in collapsed format, in green. These are alignments to the genome. Close inspection shows that many of these alignments mimic the exon structure of theMYC transcripts; thus, they can be seen as supporting the MYC transcript structure. Click on these green bars to find the accession number and description of the aligned sequence. They can be shown in expanded (normal) format using the “Configure this page” button at the left of the view.The CCDS set is also shown. Only one CCDS sequence aligns to the genome in this location, supporting MYC-001. The Human RefSeq/EMBL-nucleotides set and the CCDS sequence are drawn above the blue bar, indicating they are on the forward strand of the genome.Finally, regulatory features are drawn under the genome. The “core features” indicate sites of chromatin accessibility [DNase I hypersensitive sites (Gross and Garrard, 1988), transcription factor binding sites (http://www.ensembl.org/info/docs/funcgen/index.html), and CTCF binding sites (Nikolaev et al., 2009)]. The core features are extended to indicate positions of histone modification sites across cell types. Data for these features come from the ENCODE project (ENCODE Project Consortium, 2007). Click on any of these tracks (gray bars) for more information.Turn on the three tracks with 16 amniota vertebrates in the name using the “Multiple alignments” menu of the configuration dialog. The “16 way GERP scores” track shows a conservation score (Cooper et al., 2005) for every nucleotide in a whole-genome alignment of sixteen amniota vertebrates (Chicken, Chimpanzee, Cow, Dog, Gorilla, Horse, Human, Macaque, Marmoset, Mouse, Opossum, Orangutan, Pig, Platypus, Rat, and Zebra Finch). This alignment was performed using the Pecan program (Paten et al., 2008). Positive scores indicate highly conserved nucleotides. Regions of conserved nucleotides (consecutive peaks in the GERP score plot) are shown in the “16 way GERP elements” track.
-
13.To zoom in to the 5′ end of the MYC transcript, click and drag your mouse to outline a box around the first two exons of the MYC-002 transcript. Click on “Jump to region” in the resulting pop-up box.The display should now be zoomed in (Fig. 6.11.9).
-
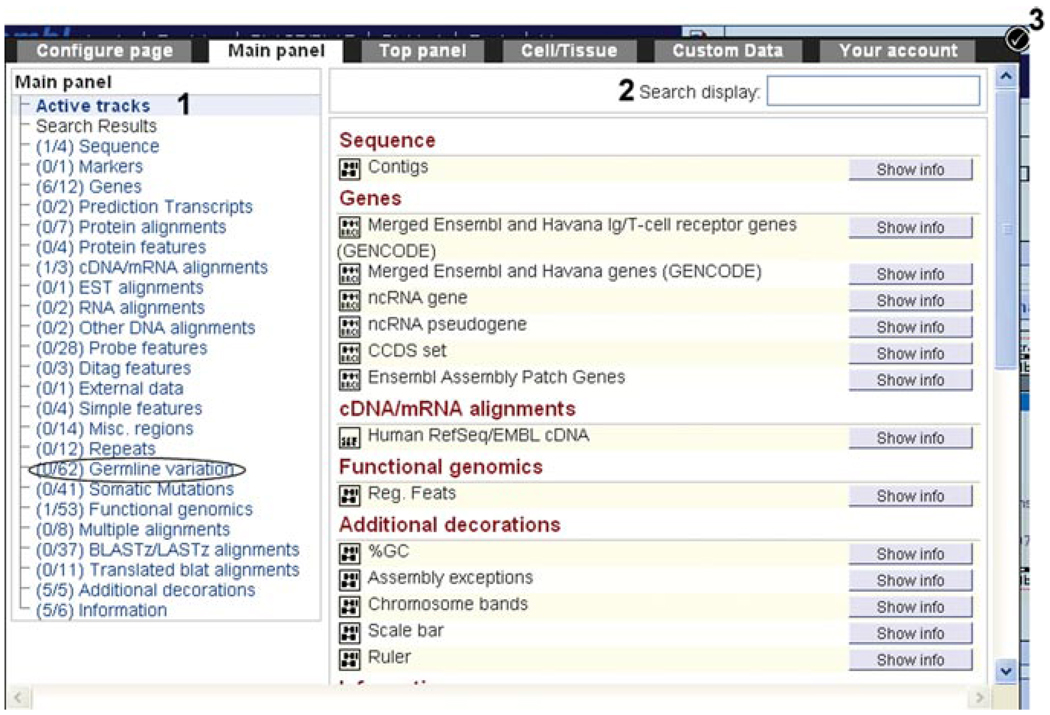
14.To turn on some tracks, click on “Configure this page” at the left to enter the configuration dialog.The available tracks are divided into submenus (Fig. 6.11.10, labeled “1”). The “Active tracks” are the data selected by default.
-
15.To add or remove a track, click on the box at the left of a data track.For example, we could expand the Human RefSeq/EMBL cDNA track by clicking on the half-filled box to the left of the track, and changing the selection to “normal.”
-
16.
To search for a track, type part of the name in the search box at the top right of the configuration dialog (Fig. 6.11.10, labeled “2”).
Figure 6.11.7.
Location tab: “region in detail” view, centered on the human MYC gene. (1) The chromosome panel reveals banding from homochromatin/heterochromatin staining. The red box shows the position of the MYC gene. (2) The “top panel” is centered on the MYC gene, indicated by the red box. Contigs are colored in light and dark blue, to differentiate them in the assembly. Clicking on a contig will show its identifier. Neighboring genes to MYC are indicated along the genomic assembly. Click on any gene to recenter the display. (3) The “main panel” is zoomed in to the MYC gene, further explored in Figure 6.11.8. The BLAT hit is circled. All panels can be exported as images using a button at the lower right-hand corner of each panel. For color version of this figure go to http://www.currentprotocols.com/protocol/hg0611.
Figure 6.11.8.
The main panel of the “region in detail” view shown in Figure 6.11.7, zoomed out. A region of chromosome 8 (base pairs 128725525-128775524) is shown. The zoom ladder is circled. Sequences from the NCBI reference sequence set and EMBL nucleotides are drawn in collapsed format above the blue bar, indicating they are on the forward strand of the chromosome. One coding sequence in the CCDS set is displayed, along with six MYC protein-coding transcripts. The BLAT hit matches to part of a common exon in the MYC transcripts. Below the blue bar are regulatory features indicating regions of open chromatin detected in the ENCODE project. For color version of this figure go to http://www.currentprotocols.com/protocol/hg0611.
Figure 6.11.9.
A zoomed-in view of the main panel shown in Figure 6.11.8. Decreasing the range to chromosome 8, base pairs 128,747,219 to 128,751,603 shows, with more clarity, the BLAT hit alignment to the 5′ end of the MYC-201 transcript. The constrained elements block and GERP scoring indicate this exon is highly conserved across sixteen species.
Figure 6.11.10.
The configuration dialog for the location tab: “region in detail” view. Click on the “configure this page” link at the left of the “region in detail” to select or deselect data tracks. Active tracks are shown by default, and list the selected data already shown in “region in detail.” (1) Data options are separated into menus, such as Germline Variations (circled). (2) A search box at the top right allows the name of a data source to be entered, revealing the appropriate track. (3) Once data are selected and/or deselected, the “check mark” must be clicked on to redraw the “region in detail” page according to the new configuration.
Annotation overlapping the BLAT hit
-
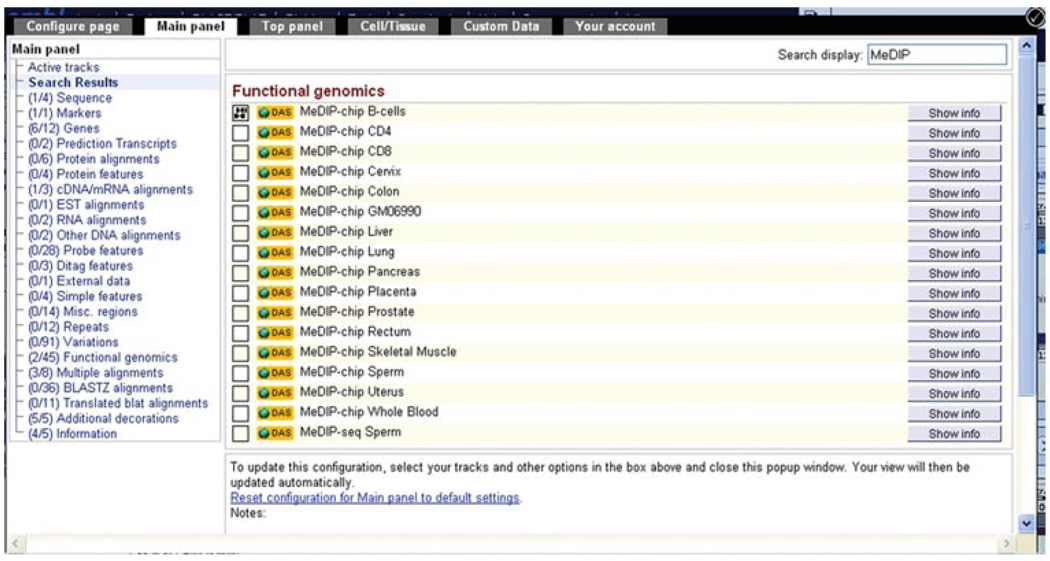
17.Turn on the MeDIP-chip B-cells track. Search for this track by typing MeDIP into the search box within the configuration dialog.As discussed in step 9 of Basic Protocol 1, this information is shown using DAS. In this case, regions of methylated DNA are immunoprecipitated using an antibody versus methylated cytosines (Deng et al., 2009).Different cell and tissue types are listed. These reflect methylation sites studied on a genome-wide level using microarray analysis (Rakyan et al., 2008). Click on the empty box at the left of “MeDIP-chip B-cells” and select “normal” (Fig. 6.11.11).
-
18.
Search the display again, this time for variant. Alternatively, you can click on Germline Variations to see the options (Fig. 6.11.10, circled).
-
19.
Select “Sequence variants (all sources),” turning the track on with the “normal” setting.
-
20.
Now, click the check mark at the upper right corner of this configuration dialog (Fig. 6.11.10, labeled “3”).
-
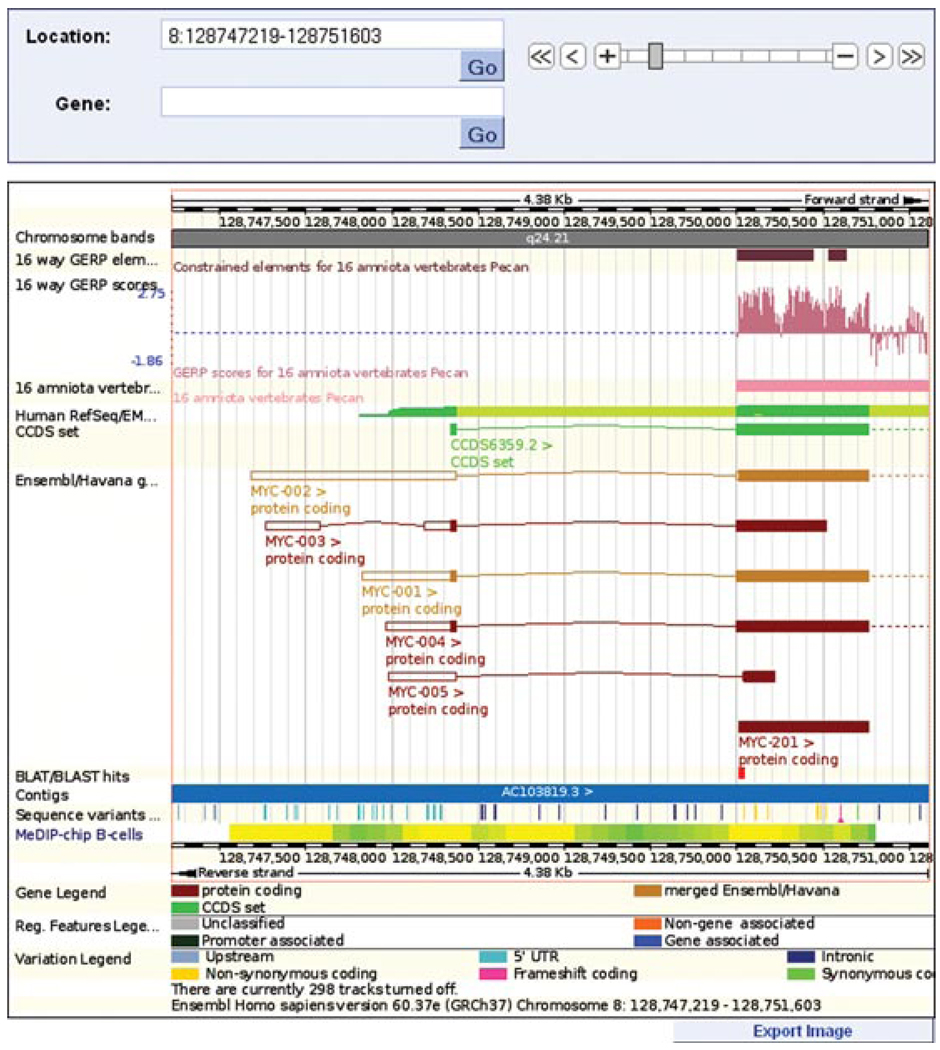
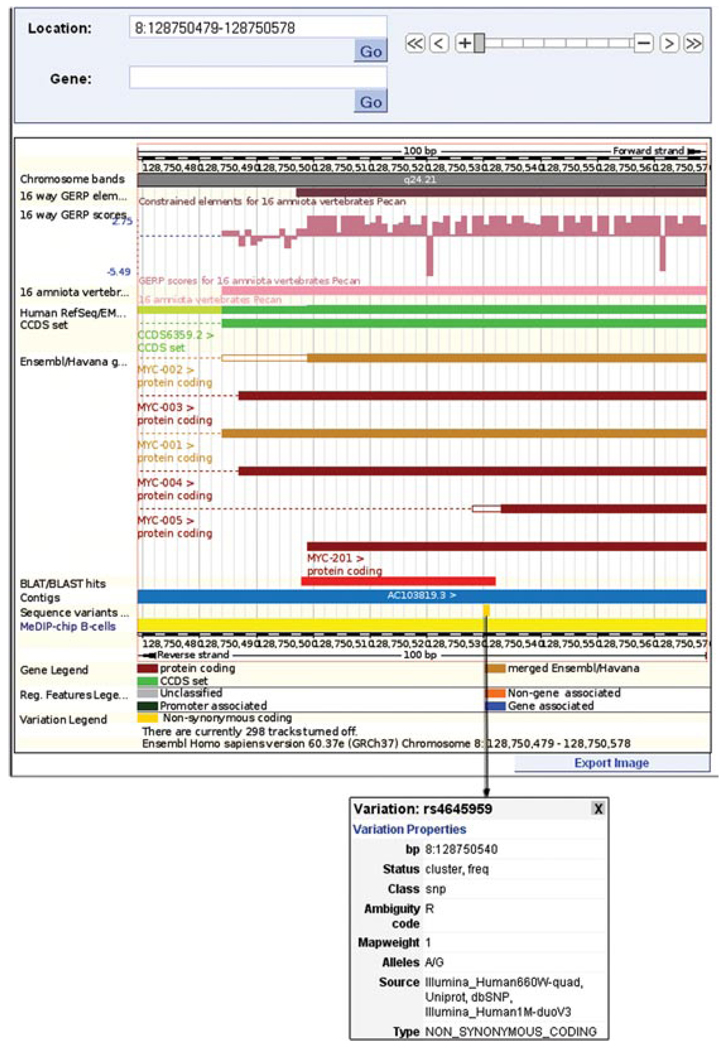
21.View the main panel showing sequence variations and MeDIP-chip B-cell information (Fig. 6.11.12).This region is rich in annotation. Sequence variants are drawn along the contig, indicating their position in the genomic sequence. The colors reflect their position and effect (if any) on the transcripts, according to the variation legend at the bottom of the view.Note that our BLAT hit aligns to the same genomic position as a yellow (nonsynonymous coding) variation. We will come back to this in step 24.Finally, we see annotation from the MeDIP-chip study done using B cells.
-
22.Click on the MeDIP-chip track, focusing on the yellow bar that aligns to the same region as our BLAT hit.A pop-up box indicates the type, the start, the end, and the score of this methylated region.
-
23.To zoom in to the BLAT hit, click and drag your mouse to draw a box around the red, filled rectangle corresponding to the BLAT hit. Follow the link to “Jump to region.”After zooming in, you should see the yellow nonsynonymous coding variant aligning to the 3′end of the BLAT hit (look at the “Sequence variants” track).
-
24.Click on the yellow box and view the pop-up information box (Fig. 6.11.13).The pop-up box reveals the rs ID (dbSNP reference SNP ID) for this variant (rs4645959). The genomic position of the SNP is 128750540. This corresponds to the mismatched allele seen in step 5 of this protocol. The alleles in the box are given as A/G. The “A” is listed first, indicating that is the allele in the reference sequence. Our starting sequence has a “G” at position 128750540.
-
25.Follow the link to “Variation properties.”The Variation tab has opened, described in Basic Protocol 1, steps 5 to 10.
-
26.Click on “Population genetics” at the left of the view (see Fig. 6.11.2).Looking through different population data focusing on populations from the HapMap project (International HapMap Consortium et al., 2007), it is clear that “G” is the minor allele. The “G” allele is seen at a low frequency in Japanese, Chinese, Yoruba, and European populations. Heterozygotes for the G allele (A|G) exist in 0% to 11% of the different populations; however, no individual has been found to be homozygous for the G allele. The “Individual genotypes” link reveals the alleles for each individual in these studies.No Phenotype Data are available in Ensembl for this variation in release 60, therefore the Phenotype Data link at the left is disabled.
-
27.
Click on Gene/Transcript (see Fig. 6.11.2; labeled “1”). Follow the link to the Ensembl gene identifier ENSG00000136997.
Figure 6.11.11.
Searching with the term MeDIP in the configuration dialog reveals multiple tracks showing DNA methylation across different tissue types. These tracks can be found in the “Functional genomics” menu.
Figure 6.11.12.
The location tab: “region in detail” view displaying the “MeDIP-chip B-cell,” “CTCF peaks” (CTCF binding sites), and “Sequence variants” tracks. A CTCF binding site corresponds to the 5′ end and upstream region of MYC-201. DNA methylation sites are found in the region shown in B-cells, indicated by the “MeDIP-chip B-cells” track. Variations are drawn as vertical lines, and are color-coded according to the legend below. For color version of this figure go to http://www.currentprotocols.com/protocol/hg0611.
Figure 6.11.13.
A zoomed-in view of the main panel shown in Figure 6.11.12. The filled, yellow box in the “sequence variants” track represents a nonsynonymous SNP at nucleotide position 128,750,540 on chromosome 8. This location, along with the dbSNP ID (rs4645959) and possible alleles (A and G), is revealed by clicking on the yellow box, which opens the pop-up box shown in the figure. For color version of this figure go to http://www.currentprotocols.com/protocol/hg0611.
View sequence variants for a gene
-
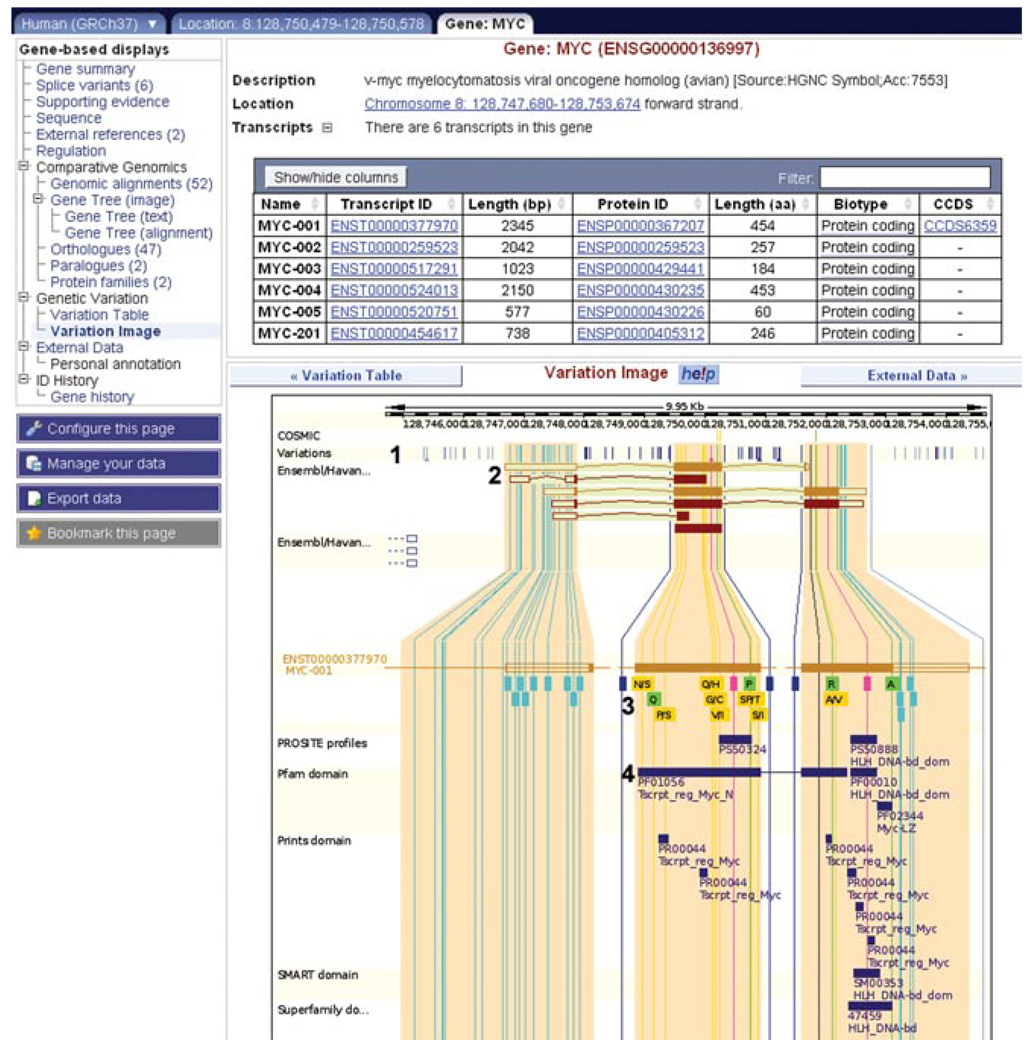
28.Click on Variation Image at the left of the Gene page.The six possible transcripts for the MYC gene are listed in the table at the top of the page. They are drawn in the image below a track displaying all sequence variants in this region as vertical lines (Fig. 6.11.14, labeled “1” and “2”).Each transcript is expanded, and variations in the transcript are drawn as colored boxes underneath each exon. The colors reflect the position of the variant in the transcript (i.e., intronic, coding, UTR,…). A legend describing these colors is found at the bottom of the view. In the case of coding variants, nonsynonymous SNPs are colored in yellow, and synonymous SNPs are colored in green.In addition, the amino acid(s) are written within the box according to the single-letter code. Intronic variations within 100 bp of an exon/intron junction are drawn, but this may be changed (fewer, or more intronic variations can be shown) using the Intron Context menu in the configuration dialog.
-
29.Click on the first and left-most yellow SNP in the view, marked with a yellow box (N/S) (Fig. 6.11.14, labeled “3”).Clicking on the SNP should cause a pop-up box to open with an ID of rs4645959. The link to Variation Properties opens the variation tab for this SNP. The potential alleles shown are A/G, in the nucleotide sequence, and N/S in the protein sequence. In the SNP information boxes, the first allele is the one in the reference sequence, in this caseGRCh37 from the International Human Genome Sequencing Consortium (see Internet Resources).
-
30.Either close this box (by clicking on the “X” in the upper right-hand corner) or move it out of the way by clicking and dragging, to observe the Pfam domain track (Fig. 6.11.14, labeled “4”).Protein signatures from various databases [in this case, PROSITE (Sigrist et al., 2010), Pfam (Finn et al., 2010), PRINTS (Attwood et al., 2003), SMART (Letunic et al., 2009), and SUPERFAMILY (Wilson et al., 2009) are drawn as purple boxes underneath the transcript. The variation rs4645959 falls within the Pfam domain PF01056, named Tscrpt reg Myc N (Fig. 6.11.14, labeled “4”). Click on the domain for more information, including links to the original database and InterPro (McDowall and Hunter, 2011). This domain is involved in regulation of transcription of the MYC gene. We might hypothesize that the sequence variant we find in diseased cells (leading to an amino acid substitution from asparagine to serine) causes a disruption in transcription, due to its presence in this transcriptional regulation domain. Though the change from asparagine to serine is relatively conservative (they are both hydrophilic), a loss of size and/or a loss of an NH2 group might disrupt specific interactions with a binding partner. Experiments would have to be done to verify any functional effect of this variation on the domain.We can compare the variation directly with the domain by following the yellow line. In fact, following the line through all three transcripts shows that this variation (and the Pfam domain) is present in five of the six transcripts.
-
31.Click on the Variation Table link at the left.The variation table lists all the consequent types of variations shown in the variation image. Click on “show” in front of any variation type to reveal a table of this type of variation in the transcript. For example, click on “show” in front of “Non-synonymous coding.” Variation IDs are listed in the first column, and a link is provided to the variation page for each ID. The location in the transcript, along with any consequence on the protein sequence, are shown in the “type” column. The genomic positions of variations are listed, along with ambiguity codes. Positions in the protein are listed (if any), along with protein alleles. Finally, the source(s) of the variation is (are) shown, and the validation status.
-
32.To view this variant within the transcript sequence, click on the first transcript ID in the table (ENST00000377970).The transcript tab should open. By selecting a particular transcript, via the table or a context menu, a new page with transcript-specific information opens. This new Transcript tab indicates the name of the selected transcript, the number of exons, the transcript length in base pairs, and the protein length in amino acids. Furthermore, we can see the source of this transcript, whether it be the Ensembl annotation pipeline or the VEGA/HAVANA project. In this case, the transcript is colored gold, which indicates that both HAVANA and Ensembl agree upon the transcript. This is written at the bottom of the view.Links at the left are now specific for this splice variant (ENST00000377970). Note that the Location, Gene, and Variation tabs are still available for quick navigation to those pages.
-
33.Click the cDNA link at the left of the view.Three different types of sequence are shown in this view (Fig. 6.11.15). The first line corresponds to the cDNA sequence, starting with UTR (highlighted sequence in yellow). The second line shows the coding sequence, and the third line shows protein sequence. The numbering scheme is specific to each sequence type. (i.e., the first line numbering begins at “1” at the start of the transcript, the second line numbering begins at “1” at the start of the coding sequence, and the third line numbering begins at “1” at the start of the protein sequence).Variations are drawn within the coding sequence. Nonsynonymous variations are highlighted in yellow, and synonymous variations are highlighted in green. The ambiguity code is positioned on top of the nucleotide to which the variation maps. Clicking on the ambiguity code opens the variation tab for that specific variant.If a variant is nonsynonymous, the amino acid in the protein sequence is highlighted in red. Hover with the mouse over the first red “N” in the protein sequence. This reveals the protein alleles to be N and S. The ambiguity code above the variant is R, representing the A and G alleles. The codon in the reference sequence is AAC. The G allele changes this codon to AGC.
Figure 6.11.14.
The “variation image” in the gene tab. (1) All variations in MYC transcripts are displayed as vertical lines, color-coded according to the legend at the bottom of the view (not shown in the figure). (2) The six MYC transcripts are drawn. (3) The MYC-001 transcript is drawn, along with variations. Synonymous and nonsynonymous SNPs show encoded amino acid(s) in single letter code. For example, the yellow box showing “N/S” reveals that asparagine or serine can be coded for at that position. Clicking on a variation will open an information box, and a link to the variation tab. (4) Protein domains from various sources are drawn along the transcripts. For example, a transcript regulation domain in Pfam maps to the second and third exons of MYC-001. For color version of this figure go to http://www.currentprotocols.com/protocol/hg0611.
Figure 6.11.15.
A selection of sequence from the transcript tab: cDNA view. Sequence and line numbering in the top line corresponds to the transcript, including UTR, highlighted in bright yellow. The second line corresponds to the coding sequence only. Codons in the first two lines are revealed by light yellow highlighting, alternating with no highlighting. The third line shows the amino acid sequence. The “N” at position 26 in the amino acid sequence is shown in red, indicating another amino acid is possible, depending on the nucleotide allele. The “R” above the highlighted nucleotide is the IUPAC code for purine (A or G), and can be clicked to open the variation tab. For color version of this figure go to http://www.currentprotocols.com/protocol/hg0611.
View multi-species whole-genome alignments
-
34.View the allele across multiple species by clicking on the Location tab, and following the link at the left to “Alignments (text).”This view allows the sequence of multiple species to be compared. Precalculated alignments include multi-species whole-genome alignments of 12 eutherian mammals, 34 eutherian mammals (including low coverage genomes), 16 amniota vertebrates, 6 catarrhini primates, and 5 fish. These alignments are performed using EPO or Pecan. Pairwise alignments between two species are also available, calculated using BLASTZ-Net or TBLAT (Kent, 2002).By default only the sequence for the gene of interest is shown (in this case, human MYC). Exons are shown in red letters, and introns and flanking sequence are shown in black.
-
35.Choose the 12 eutherian mammals EPO by selecting this alignment in the roll-down menu at the top of the sequence. Click the Go button.Ensembl-calculated alignments of the high-coverage genomes for 11 eutherian mammals are shown, aligned with the EPO pipeline (Paten et al., 2008).
-
36.To display variations and conserved regions across 12 eutherian mammals:
- Click on “Configure this page” at the left.
- Select “Yes and show links” in the “Show variations” option.
- Select “Relative to coordinate system” in the “Line numbering” menu.
- Select “All conserved regions” under “Conservation regions.”
- Click the check mark to save these changes.
Variations should be highlighted within the sequence. SNPs are demonstrated by replacing the nucleotide in the reference sequence with an ambiguity code. Chromosome and base pair coordinates are shown (for example, 8:128748330 means chromosome 8, base pair 128,748,330). Variation IDs and coordinates are shown at the right. Blue shading indicates identical nucleotides across species. -
37.Find our variation of interest, rs4645959, in the sequence by scanning the links at the right of the sequence for this ID.It should be at position 128750540 (we learned this in step 24 of this protocol).Viewing the sequence in this position shows us an “R” in the human sequence (which is the ambiguity code marking this SNP). The other species in the alignment have an “A” at this position. The “A” is a highly conserved nucleotide across these 11 eutherian mammals.
BASIC PROTOCOL 3
SEQUENCE MATCHES AND INDIVIDUAL GENOMES
Views: Transcript (General Identifiers, GO Terms, Population Comparison), Variation (LD view, Export).
Starting with the human HRAS gene, an oncogene in the RAS subfamily of GTPases, we will look at sequence matches between Ensembl and other databases such as UniProt. Gene ontology terms will be examined for an overview of what is known or predicted about the function of the HRAS protein. Variations are compared between human individuals. Finally, we will view linkage disequilibrium plots for a synonymous SNP in the HRAS coding sequence, and export linkage disequilibrium (LD) values from the browser.
Materials
A computer with a connection to the Internet
An up-to-date Web browser that supports JavaScript, such as Firefox, Safari, or the most recent version of Internet Explorer (at the time of writing, IE7 and IE8)
Getting started
-
1.
Go to http://www.ensembl.org, the Ensembl home page (Fig. 6.11.1). Search for the human HRAS gene by selecting “Human” from the pull-down menu and typing HRAS in the search box.
-
2.
Click through the search results (see Basic Protocol 1) and open the Gene summary page for ENSG00000174775 (HRAS).
-
3.
Follow the link for the transcript ENST00000388730 in the table.
ID matches
-
4.Click on the “General identifiers” link at the left, under the External References section.155 matches of the Ensembl transcript (or encoded protein) to sequences in public, scientific databases are shown in this section. Matches include two antibodies in the human protein atlas (Ponten et al., 2008), the RASH Human gene in UniProt KB/Swiss-Prot (UniProt Consortium, 2010), and, scrolling down, four diseases in the OMIM database. Click the Align link next to the RASH Human hit from UniProtKB/SwissProt. Note the sequence matches completely. Go back once with the browser controls to the “General identifiers” view.
Gene ontology
-
5.Click on the “Ontology table” in the Gene Ontology section at the left of the view.The Gene Ontology project provides a hierarchical set of standardized terms describing protein functional classes, cellular locations, and biological processes (Gene Ontology Consortium, 2010). Evidence codes (three-letter codes) reflect how the term was assigned to the protein.For example, in this case, “nucleotide binding” is IEA, or “inferred through electronic annotation.” “Cytoplasm” has the term TAS, or “traceable author statement,” signifying that a publication exists showing the association of ENSP00000373382 to the cytoplasm. The meaning of the evidence codes can be found by clicking on the Help button in this view, or by going to the gene ontology Web site (http://www.geneontology.org).
Individual genomes
-
6.Click on the “Population comparison” link at the left.Variations are mapped to the individual genomes of James Watson and Craig Venter. Genomes can be selected in the “configure this page” dialog. If the variation shows the same allele as the reference sequence, “SARA” appears under the “type” column, for “Same As Reference Assembly.” Most of the alleles in this transcript are the same between Watson, Venter, and the reference sequence. However, rs12628 is a synonymous SNP in the HRAS coding sequence in Watson’s genome (Fig. 6.11.16).
-
7.Click on rs12628, the synonymous SNP inWatson’s genome, to jump to the variation tab.In the variation summary page for rs12628, linkage disequilibrium (LD) data are shown in the form of plots. Twelve plots demonstrating LD values for specific populations are shown above the flanking sequence. LD values are from the HapMap project in this example.
Figure 6.11.16.
The transcript tab: population comparison view. Variations are shown in Jim Watson’s genome. One synonymous coding SNP (rs12628) and one intronic SNP (rs61877782) differ in allele, when compared to the reference genome.
Linkage disequilibrium
-
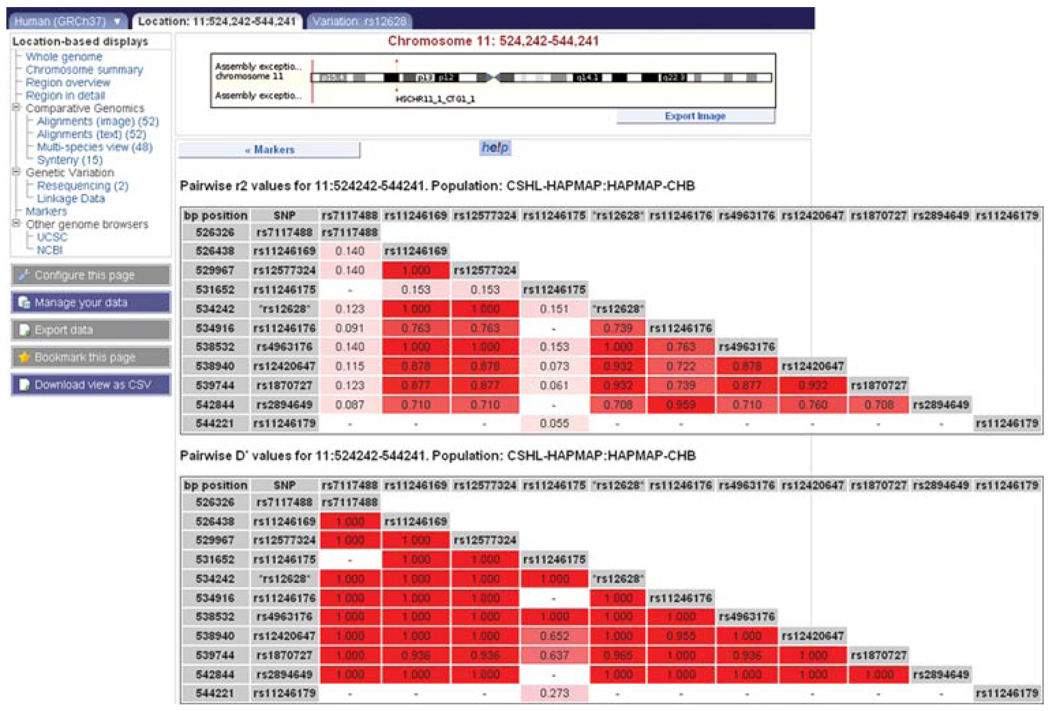
8.Click on the link to the LD plot calculated from the population: CSHL-HAPMAP: HAPMAP-CHB.LD plots are drawn underneath the transcript diagrams for theHRAS gene, and variations in this region. The two plots represent LD values measured as r2 or D’. Red regions show variations in high LD, while white regions indicate no LD. Click on the plot for the variations measured in that region, and the variation IDs. To export a table of LD values, click on the blue “Export data” button at the left. Follow the link to “HTML” to view the values in table format (Fig. 6.11.17).
Figure 6.11.17.
The location tab: Linkage Data view. This view is reachable from the variation tab: summary view, if linkage disequilibrium (LD) values have been calculated for the specific variant. Clicking on the LD plot for the population “CSHL-HAPMAP:CHB” in the variation summary view for rs12628 will open the “Linkage Data” view. Click “Export data” at the left of the view to export the table of LD values shown in this figure.
BASIC PROTOCOL 4
A CYTOGENETICIST’S VIEW
Views: Location (“Region in Detail,” “Region Overview”), Gene (Regulation), Feature (Summary, Context).
We begin with a region encompassing a highly conserved sequence that Ensembl predicts to be a regulatory region. The underlying evidence for this predicted regulatory region is examined. Other motifs associated with gene regulation are discussed, specifically from the CisRED (Hillier et al., 2004), miRanda (Betel et al., 2008), and VISTA (Visel et al., 2007) projects. Markers and clones are viewed along the chromosome, and tilepath clones (the clones used to determine the genome sequence) are exported.
Necessary Resources
A computer with a connection to the Internet
An up-to-date Web browser that supports JavaScript, such as Firefox, Safari, or the most recent version of Internet Explorer (at the time of writing, IE7 and IE8)
Getting started
-
1.
Go to http://www.ensembl.org, the Ensembl home page (Fig. 6.11.1). Search for a region in the human genome by typing human 11:747329-765024 into the search box (signifying human chromosome 11, base pairs 747,329 to 765,024).
Sequence conservation
-
2.Turn on the constrained elements using the configuration dialog.
- Click on “configure this page.”
- Click the “Multiple alignments” menu.
- Deselect the tracks for the 16 amniota vertebrates alignment, if they are turned on.
- Select the three tracks for the 34 eutherian mammals alignment.
- Click the check mark to save and close the configuration dialog.
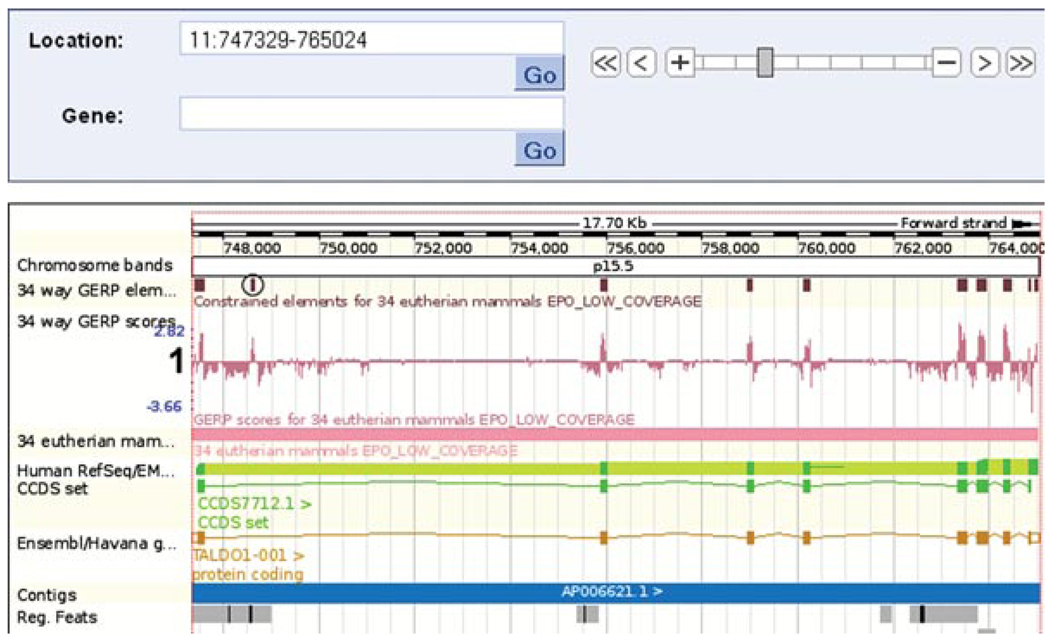
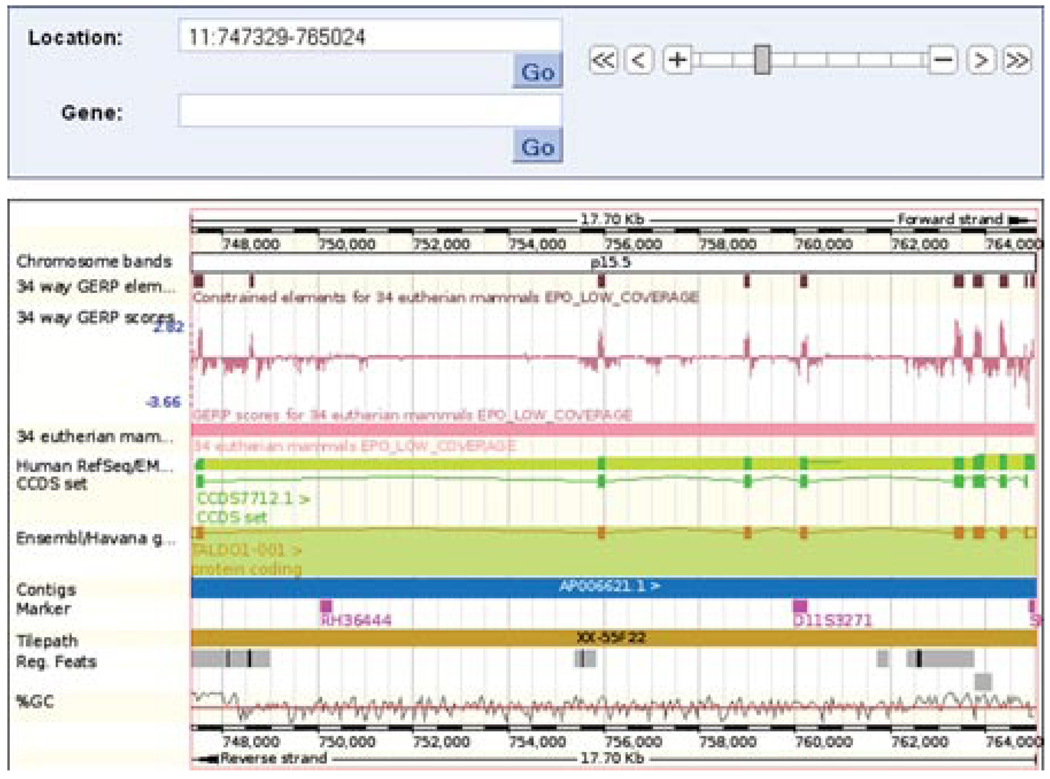
Most constrained elements correspond with exons. However, in this case we see one element calculated from the 34 eutherian mammals alignment that lies outside an exon. (Fig. 6.11.18, circled).
Figure 6.11.18.
Location tab: “region in detail” view. The main panel is shown. Constrained elements (circled) and GERP scoring (labeled “1”) of each nucleotide in the 34 species alignment are shown. The circled constrained element falls in the first intron of the TALD01 transcript.
Gene regulation
-
3.Zoom into the first two constrained elements circled in Figure 6.11.18. Click and drag a box around these blocks with your mouse, to do so.A regulatory feature maps to the highly conserved sequence discussed in Basic Protocol 2, step 12.
-
4.Click on the regulatory feature.A pop-up box should appear, showing this sequence has transcription factor binding sites, along with DNase I hypersensitivity.
-
5.Click on ENSR00000684596 to jump to the Regulation page.A new tab opens, the regulation tab, which focuses on one regulatory region. This highly conserved regulatory feature is based on DNase I hypersensitive sites from various cell types, along with transcription factor binding sites. These make up the “core feature.” Histone modification sites extend the feature, and these extensions are drawn as error bars. Certain histone modification patterns are associated with promoters. If the feature contains these patterns, it is termed “promoter-associated.” ENSR00000684596 exhibits these patterns in various cell types and covers the 5′ end of the TALDO1 gene.
-
6.
Click on the Feature Context link at the left.
-
7.
Click on the golden transcript shown in the view. A pop-up window should appear. Click on ENSG00000177156 to open the Gene tab.
-
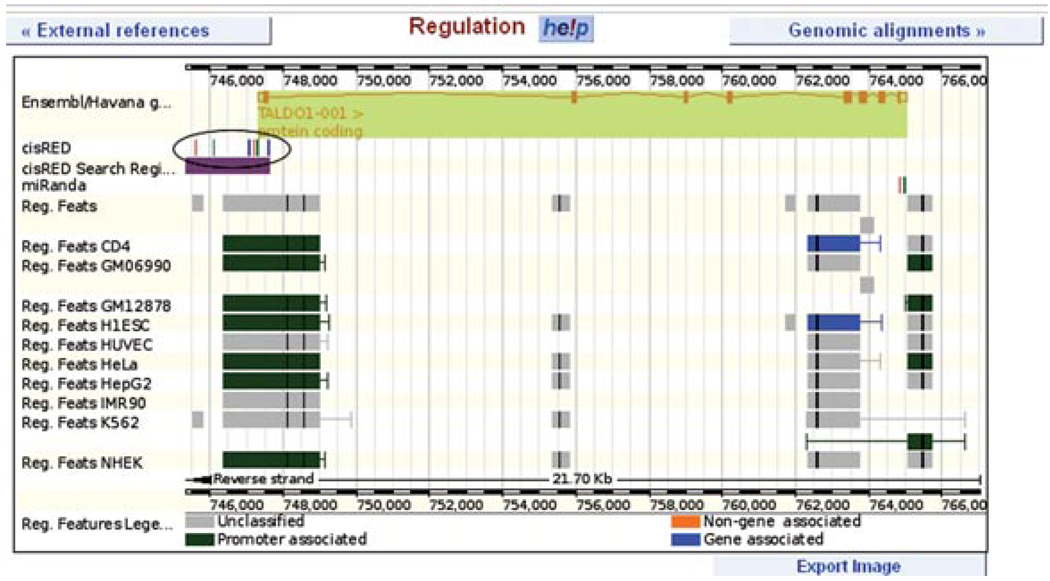
8.Click on the “regulation” link at the left.This view diagrams potential regulatory features in the region of the TALDO1 gene. In addition to the features from the regulatory build that are associated with the 5′ end of the gene (Fig. 6.11.19, green and gray boxes), two regulatory regions map to the 3′ terminus (Fig. 6.11.19, blue boxes). Furthermore, a track shows regulatory regions from the CisRED, miRanda, and VISTA projects (Fig. 6.11.19, circled). CisRED features are only searched for in specific regions of the gene (5′ ′end and upstream), indicated by the light purple “CisRed search regions” track. Clicking on any of these features (Fig. 6.11.19, circled) will yield a pop-up box with more information.Scrolling down, the genomic sequence corresponding to each regulatory feature is shown. The feature we investigated in steps 5 to 9 of this protocol is ENSR00000684596. The sequence for this promoter-associated feature is shown. Clicking on the ID (ENSR00000684596) brings us back to the regulation tab.
-
9.Click the Location tab to open the Region in Detail view.The region for the TALDO1 gene is shown.
Figure 6.11.19.
Gene tab: regulation view. A graphical display of predicted and known sequences associated with gene regulation is shown for ENSG00000177156. Features from the Ensembl Regulatory Build are shown, along with sequences from cisRED (circled). Click on any feature for an information box. For color version of this figure go to http://www.currentprotocols.com/protocol/hg0611.
Display markers and clones
-
10.Configure the Region in Detail viewso thatmarkers and tilepath clones are displayed.Make sure you are viewing the full TALDO1 gene model. Add these tracks by searching for each one in the configuration dialog and selecting it. Save and close the configuration dialog to refresh the Region in Detail view with the new tracks. The view should now show two markers (pink boxes named RH36444 and D11S327) and a clone (gold rectangle named XX-55F22; Fig. 6.11.20). Click on one of the markers and follow the link to “Marker info.” The resulting view shows IDs for this marker in other databases (“synonyms”) and two primer sequences, along with expected product size.Markers can also be turned on in the Top panel of “Region in Detail,” using the configuration dialog. To restore tracks to the default configuration, click on “configure this page” at the left, and choose the option “Reset configuration for Main panel to default settings” at the bottom of the configuration dialog.
-
11.
Using the configuration dialog, turn on the “sequence” and “translated sequence” tracks in the Region in Detail page.
-
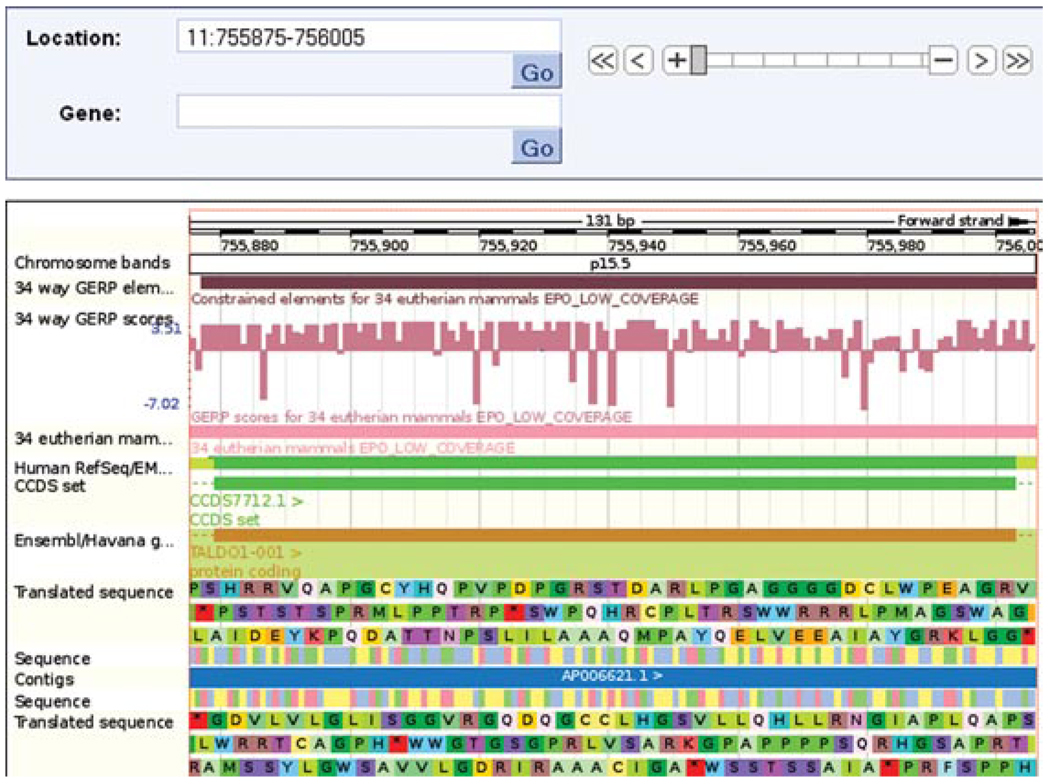
12.Zoom in to the second exon of the TALDO1 gene by clicking and dragging a box around it, then clicking “Jump to region” in the pop-up box.You might have to do this twice, in order to achieve a region of less than 200 nucleotides. Once the range is small enough, the sequence will appear (Fig. 6.11.21).
-
13.Click on Region Overview at the left.This view is similar to “Region in Detail,” but allows over 1 Mb of sequence to be viewed. Syntenic regions, or long regions of conserved sequence and gene order between species, may be drawn in this view.
-
14.
Use the configuration dialog to turn on Contigs.
-
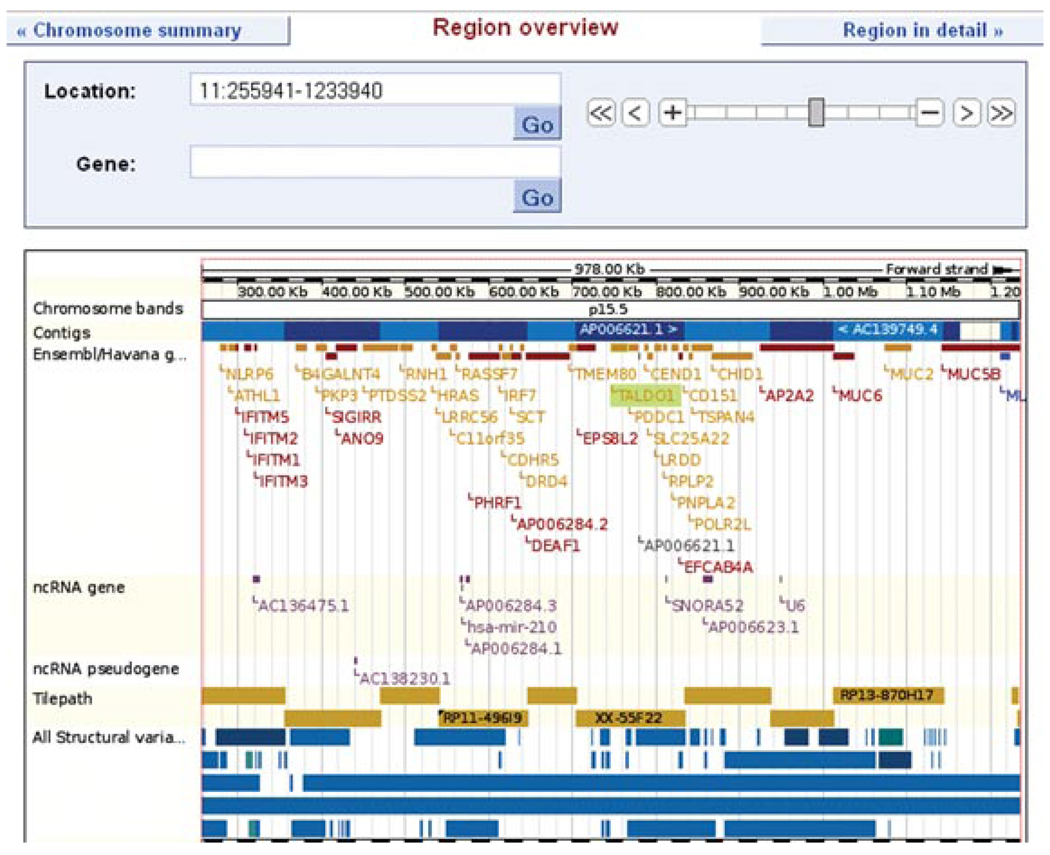
15.Zoom out by sliding to the fourth position (1 Mb) on the zoom.The resulting view (Fig. 6.11.22), should show the genomic assembly (blue rectangles) and clones.
-
16.Export the clones shown in this view. Click on the blue “Export data” button.The export dialog allows export of sequence and annotation in various formats.
-
17.Change Output from “FASTA sequence” to CSV. Scroll down.All options are selected for CSV.
-
18.
Deselect these options, leaving “Tilepath clones” selected.
-
19.Click the blue Next button (you may have to scroll up to see it). Click HTML in the next window.Clones for the regions selected are listed.For other ways to export sequence and annotation, see Support Protocol 1.
Figure 6.11.20.
Location tab: “region in detail” view. The main panel is centered on the TALDO1 transcript. Markers are displayed as pink blocks. Clicking on either RH36444 or D11S3271 will reveal more information about the marker. For color version of this figure go to http://www.currentprotocols.com/protocol/hg0611.
Figure 6.11.21.
Location tab: “region in detail” view. The main panel has been zoomed in to chromosome 11, base pairs 755,875 to 756,005. Sequence and translated sequence are selected in the configuration dialog. Sequence is only displayed if the base pair range is small enough.
Figure 6.11.22.
Location tab: region overview. Contigs, genes, and tilepath clones are displayed. Gold clones indicate finished sequence, and a black triangle at the upper left-hand corner of a gold rectangle indicates the clone was mapped using fluorescence in situ hybridization. For regions of over 1 Mb, the region overview should be used rather than “region in detail.” For color version of this figure go to http://www.currentprotocols.com/protocol/hg0611.
SUPPORT PROTOCOL 1
SEQUENCE EXPORT
Views: Transcript (cDNA, Export) BioMart.
The browser can be used to export gene, transcript, or protein sequence in FASTA format. While this is useful for one or two genes, it becomes tedious for a set of genes. BioMart (Haider et al., 2009) is a quick export tool that retrieves information from a “martified” Ensembl database according to the user’s request. Both BioMart and export from the browser will be explored in this protocol.
Necessary Resources
A computer with a connection to the Internet
An up-to-date Web browser that supports JavaScript, such as Firefox, Safari, or the most recent version of Internet Explorer (at the time of writing, IE7 and IE8)
Go to the transcript tab, cDNA link for the MYC transcript ENST00000377970 as outlined in step 33 of Basic Protocol 2.
The option to download this view as RTF (Rich Text Format) is available as a blue button on the left of the page. Click on the blue Export Data link above this option.
- Scroll down the export dialog to deselect all options under “Options for FASTA sequence,” leaving “cDNA” selected (don’t forget to change “genomic” to “none”). Click the blue Next button, then click on HTML.The cDNA sequence will appear in FASTA format.
- Now click the blue BioMart button at the top right of the view.An alternative to export from the browser is found in the BioMart data mining tool. BioMart is also accessible from an alternate location: http://www.biomart.org.
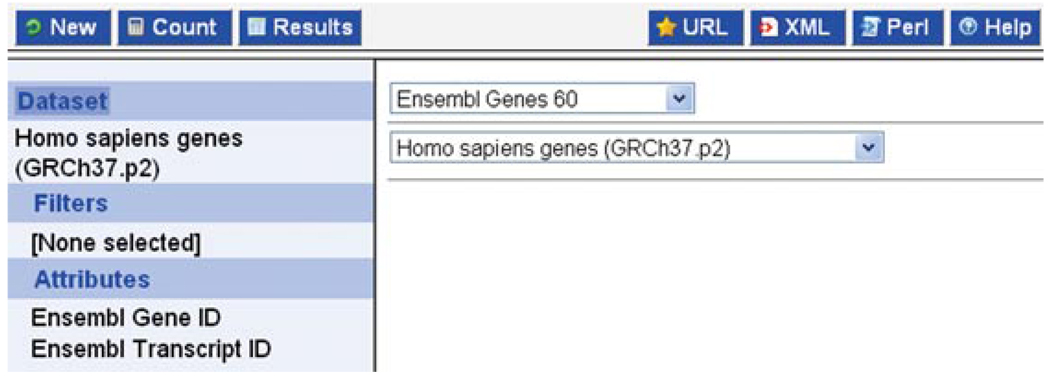
Choose “Ensembl Genes 60” as the database, and “Homo sapiens genes” as the dataset (Fig. 6.11.23).
Click Filters at the left, and expand the GENE panel at the right.
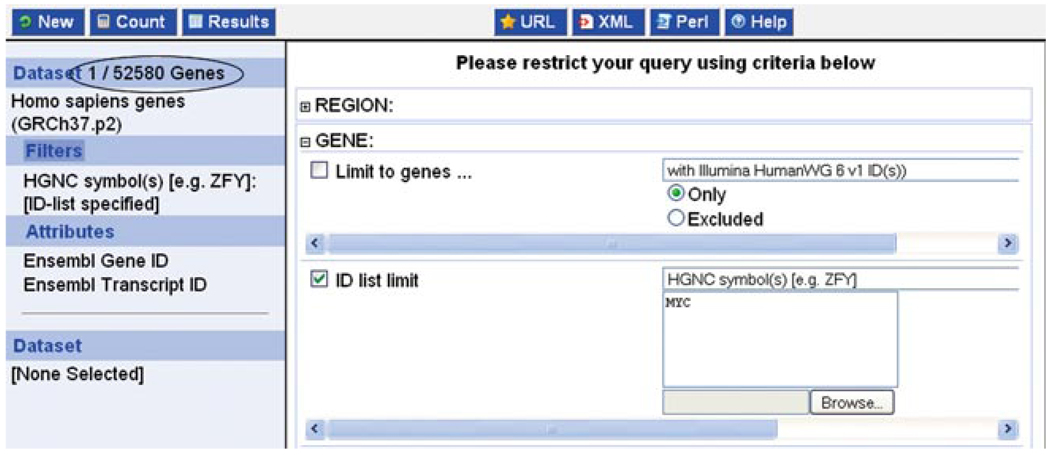
- Enter the gene symbol, MYC, into the ID list limit box, and change the header from “Ensembl genes” to “HGNC symbol” (Fig. 6.11.24).More than one gene symbol may be entered. Alternatively, gene IDs or accession numbers can be used.Click the blue Count button at the top left to make sure the gene ID is accepted. The result should be 1/52,580 (1 out of a possible 52,580 human genes; Fig. 6.11.24, circled).
- Click Attributes, and choose the Sequences page. Expand the SEQUENCES panel and select “cDNA.”The header may be customized in the “Header information” options. Ensembl gene ID and Ensembl transcript ID are automatically in the header, but may be deselected. Gene name, chromosome, and position in base pairs are all options.
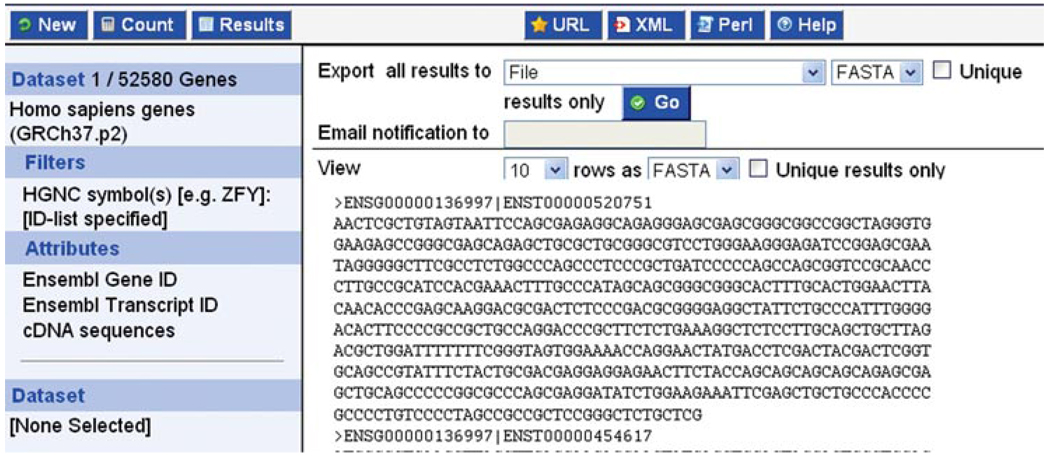
- Click the blue Results button at the top left. Either click GO to export results to a file, or View “ALL” rows as HTML (Fig. 6.11.25).Sequences may be exported as FASTA. In the Support Protocol 2, we export variations for a gene. Other file formats will be explored.For a BioMart tutorial video, see the Ensembl tutorials page: http://www.ensembl.org/info/website/tutorials/index.html (Introduction to BioMart). These videos are hosted at YouTube.
Figure 6.11.23.
BioMart: the database and dataset have been selected to be Ensembl Genes 60 and Homo sapiens genes.
Figure 6.11.24.
BioMart: the HGNC symbol MYC has been entered in the “ID list limit” filter, and the “count” button reveals that 1 gene out of 52,580 potential human noncoding and coding genes passes the filter (circled).
Figure 6.11.25.
BioMart: the “results” button shows a preview window.
SUPPORT PROTOCOL 2
VARIATION EXPORT
View: BioMart.
The browser can be used to view all variations for a gene, as shown in Basic Protocol 1, steps 28 to 33. To quickly obtain a table of variations for one, or several, genes, BioMart can be used, as outlined in this protocol.
Necessary Resources
A computer with a connection to the Internet
An up-to-date Web browser that supports JavaScript, such as Firefox, Safari, or the most recent version of Internet Explorer (at the time of writing, IE7 and IE8)
Getting started
Go to the Ensembl home page (Fig. 6.11.1) at http://www.ensembl.org. Click on the BioMart link at the top.
- Choose “Ensembl Genes 60” and “Homo sapiens” as the database and dataset, as in Support Protocol 1, step 5.Instead of choosing Ensembl genes 60 as the database, it is possible to choose Ensembl variations. This would be relevant if a list of variation IDs were to be used in the Filters. Choosing Ensembl genes 60 allows filters to apply to the genes. Choosing the variation database means filters apply to variations. For example, intergenic variations may be seen when choosing the variation database.
Enter BRCA2 in the ID list limit box, following a procedure similar to Support Protocol 1, steps 6 and 7.
- Click on Attributes at the left, and choose the Variations page.By default, Gene ID, Transcript ID, and Variation ID are selected. Choices such as validation status, variation source, and consequence type can be selected.
- Click the Results button at the top left. Choose “compressed web file, notify by email,” and type in your e-mail address. Choose the file type and click GO.Supported file types include HTML, CSV, TSV, and XLS. The “compressed web file, notify by email” option is especially useful in cases of large export files.
COMMENTARY
Background Information
With the vast number of databases in life sciences today, it becomes necessary to provide one access point to a comprehensive set of annotation on a gene or genome. Ensembl meets this goal by coordinating with other projects such as UniProt, InterPro, and Gene Ontology in order to show multiple types of information on a genome-wide level.
The complete gene and transcript set for human is not yet known. Ensembl bases all automatically annotated transcripts on protein and cDNA sequences from public sequence sets (NCBI RefSeq, UniProt). As the sequences in underlying databases (European Nucleotide Archive, GenBank, and DDBJ) have been submitted by wet lab biologists, each Ensembl transcript goes back to experimental evidence. In addition, the Ensembl/HAVANA merged transcripts obtain a higher degree of confidence, as manual annotation confirms Ensembl determinations.
Variation resources providing disease and phenotype information, such as NHGRI’s GWAS catalog, are now developing. Understanding the effect of sequence variation on human disease will allow deleterious polymorphisms to be spotted, making for quicker diagnosis, and potentially, disease treatment. Genome browsers allow these types of annotations to be easily compared with genes and other genomic features, such as conserved regions across species, and/or protein domains, providing a bigger picture of any locus.
Like life sciences in general, the bioinformatics resources supporting the field are not static entities, but changing and improving over time. Although data updates and changes in the user interface may be challenging for biologists, the aim of database resources is always to provide a better integrated view of current biology.
The upshot of the fluidity of biological data is that data searches and analysis should be repeated from time to time. New supporting evidence, a better genome sequence assembly, or a refined algorithm all help to improve annotation quality significantly over time. Therefore, the answers given by a more current version than Ensembl 60 (November 2010), which is the basis of this unit, are also subject to improvement.
To allow looking up older references (e.g., in lab journals or research articles) in their original context, Ensembl has implemented an archive site (http://archive.ensembl.org/). We aim to provide a back-catalog of earlier releases for at least two years. Access to this particular release (Ensembl 60, November 2010) is made available via http://Nov2010.archive.ensembl.org/. The Ensembl project is open source; all data shown in the browser and underlying databases are freely available, along with the Web code.
For further support, view video tutorials for the project at http://www.ensembl.org/info/website/tutorials/index.html. Help pages are available for each Ensembl view, accessible via a blue Help button to the right of the page title. The help also provides links to a glossary, and to a “contact helpdesk” form. The helpdesk may also be reached by e-mail (helpdesk@ensembl.org). Finally, the “Help” and “Documentation” link at the top right of each Ensembl view provides basic documentation and protocols used in the project, along with frequently asked questions.
Acknowledgements
The Ensembl genome server is the result of the work of the Ensembl team at the Wellcome Trust Sanger Institute (WTSI) and the European Bioinformatics Institute (EMBLEBI), an outstation of the European Molecular Biology Laboratory. The Ensembl project is principally funded by the Wellcome Trust with additional support from the European Molecular Laboratory (EMBL), the National Human Genome Research Institute (NHGRI), the U.S. National Institute of Allergy and Infectious Diseases (NIAID), the Biotechnology and Biological Sciences Research Council (BBSRC), theMedical Research Council (MRC), and the European Union.
Footnotes
Internet Resources
Ensembl project home page.
http://www.ensembl.org/info/website/tutorials/index.html
Support videos and other tutorials for Ensembl.
BioMart Project.
Distributed Annotation System (DAS) and BioDAS.
http://www.ncbi.nlm.nih.gov/projects/SNP/
dbSNP: a repository of polymorphisms.
Gene Ontology Consortium.
http://www.ncbi.nlm.nih.gov/projects/genome/assembly/grc/index.shtml
Genome Reference Consortium: houses the reference human genome.
http://www.genome.gov/26525384#1
NCBI GWAS catalog.
An international organization working towards a haplotype map of the human genome.
HUGO Gene Nomenclature Committee (HGNC).
http://www.ebi.ac.uk/interpro/
InterPro, a collection of protein signatures.
http://www.ncbi.nlm.nih.gov/omim
Online Mendelian Inheritance in Man, a set of human genes and phenotypes.
http://www.ncbi.nih.gov/RefSeq/
A multi-organism, nonredundant database of sequences.
UniProtKB, a catalog of information on proteins.
http://www.ncbi.nlm.nih.gov/entrez/query.fcgi?db=unists
UniSTS, databank for chromosomal markers.
Vertebrate Genome Annotation (VEGA) at Sanger Institute.
http://www.ncbi.nlm.nih.gov/projects/genome/assembly/grc/index.shtml
International Human Genome Sequencing Consortium.
Literature Cited
- Ashburner M, Ball CA, Blake JA, Botstein D, Butler H, Cherry JM, Davis AP, Dolinski K, Dwight SS, Eppig JT, Harris MA, Hill DP, Issel-Tarver L, Kasarskis A, Lewis S, Matese JC, Richardson JE, Ringwald M, Rubin GM, Sherlock G. Gene ontology: Tool for the unification of biology. The Gene Ontology Consortium. Nat. Genet. 2000;25:25–29. doi: 10.1038/75556. [DOI] [PMC free article] [PubMed] [Google Scholar]
- Attwood TK, Bradley P, Flower DR, Gaulton A, Maudling N, Mitchell AL, Moulton G, Nordle A, Paine K, Taylor P, Uddin A, Zygouri C. PRINTS and its automatic supplement, preprints. Nucleic Acids Res. 2003;31:400–402. doi: 10.1093/nar/gkg030. [DOI] [PMC free article] [PubMed] [Google Scholar]
- Benyamin B, McRae AF, Zhu G, Gordon S, Henders AK, Palotie A, Peltonen L, Martin NG, Montgomery GW, Whitfield JB, Visscher PM. Variants in TF and HFE explain approximately 40% of genetic variation in serum-transferrin levels. Am. J. Hum. Genet. 2009;84:60–65. doi: 10.1016/j.ajhg.2008.11.011. [DOI] [PMC free article] [PubMed] [Google Scholar]
- Betel D, Wilson M, Gabow A, Marks DS, Sander C. The microRNA.org resource: Targets and expression. Nucleic Acids Res. 2008;36:D149–D153. doi: 10.1093/nar/gkm995. [DOI] [PMC free article] [PubMed] [Google Scholar]
- Borate B, Baxevanis AD. Searching Online Mendelian Inheritance in Man (OMIM) for information on genetic loci involved in human disease. Curr. Protoc. Bioinform. 2009;27:1.2.1–1.2.13. doi: 10.1002/0471250953.bi0102s27. [DOI] [PubMed] [Google Scholar]
- Chen Y, Cunningham F, Rios D, McLaren W, Smith J, Pritchard B, Spudich GM, Brent S, Kulesha E, Marin-Garcia P, Smedley D, Birney E, Flicek P. Ensembl variation resources. BMC Genomics. 2010;11:293. doi: 10.1186/1471-2164-11-293. [DOI] [PMC free article] [PubMed] [Google Scholar]
- Cooper GM, Stone EA, Asimenos G, Green ED, Batzoglou S, Sidow A NISC Comparative Sequencing Program. Distribution and intensity of constraint in mammalian genomic sequence. Genome Res. 2005;15:901–913. doi: 10.1101/gr.3577405. [DOI] [PMC free article] [PubMed] [Google Scholar]
- Cullen LM, Anderson GJ, Ramm GA, Jazwinska EC, Powell LW. Genetics of hemochromatosis. Annu. Rev. Med. 1999;50:87–98. doi: 10.1146/annurev.med.50.1.87. [DOI] [PubMed] [Google Scholar]
- Curwen V, Eyras E, Andrews TD, Clarke L, Mongin E, Searle SM, Clamp M. The Ensembl automatic gene annotation system. Genome Res. 2004;14:942–950. doi: 10.1101/gr.1858004. [DOI] [PMC free article] [PubMed] [Google Scholar]
- Dalgleish R, Flicek P, Cunningham F, Astashyn A, Tully RE, Proctor G, Chen Y, McLaren WM, Larsson P, Vaughan BW, Broud C, Dobson G, Lehvslaiho H, Taschner PE, den Dunnen JT, Devereau A, Birney E, Brookes AJ, Maglott DR. Locus reference genomic sequences: An improved basis for describing human DNA variants. Genome Med. 2010;2:24. doi: 10.1186/gm145. [DOI] [PMC free article] [PubMed] [Google Scholar]
- Deng J, Shoemaker R, Xie B, Gore A, LeProust EM, Antosiewicz-Bourget J, Egli D, Maherali N, Park IH, Yu J, Daley GQ, Eggan K, Hochedlinger K, Thomson J, Wang W, Gao Y, Zhang K. Targeted bisulfite sequencing reveals changes in DNAmethylation associated with nuclear reprogramming. Nat. Biotechnol. 2009;27:353–360. doi: 10.1038/nbt.1530. [DOI] [PMC free article] [PubMed] [Google Scholar]
- ENCODE Project Consortium. Identification and analysis of functional elements in 1% of the human genome by the ENCODE pilot project. Nature. 2007;447:799–816. doi: 10.1038/nature05874. [DOI] [PMC free article] [PubMed] [Google Scholar]
- Fernández-Suárez XM, Schuster MK. Using the Ensembl genome server to browse genomic sequence data. Curr. Protoc. Bioinformatics. 2010;30:1.15.1–1.15.48. doi: 10.1002/0471250953.bi0115s30. [DOI] [PubMed] [Google Scholar]
- Finn RD, Mistry J, Tate J, Coggill P, Heger A, Pollington JE, Gavin OL, Gunasekaran P, Ceric G, Forslund K, Holm L, Sonnhammer EL, Eddy SR, Bateman A. The Pfam protein families database. Nucleic Acids Res. 2010;38:D211–D222. doi: 10.1093/nar/gkp985. [DOI] [PMC free article] [PubMed] [Google Scholar]
- Galperin MT, Cochrane GR. The 2011 Nucleic Acids Research Database Issue and the online Molecular Biology Database Collection. Nucleic Acids Res. 2011;39:D1–D6. doi: 10.1093/nar/gkq1243. [DOI] [PMC free article] [PubMed] [Google Scholar]
- Gene Ontology Consortium. The Gene Ontology in 2010: Extensions and refinements. Nucleic Acids Res. 2010;38:D331–D335. doi: 10.1093/nar/gkp1018. [DOI] [PMC free article] [PubMed] [Google Scholar]
- Gross DS, Garrard WT. Nuclease hypersensitive sites in chromatin. Annu. Rev. Biochem. 1988;57:159–197. doi: 10.1146/annurev.bi.57.070188.001111. [DOI] [PubMed] [Google Scholar]
- Haider S, Ballester B, Smedley D, Zhang J, Rice P, Kasprzyk A. BioMart central portal: Unified access to biological data. Nucleic Acids Res. 2009;37:W23–W27. doi: 10.1093/nar/gkp265. [DOI] [PMC free article] [PubMed] [Google Scholar]
- Hillier LW, Miller W, Birney E, Warren W, Hardison RC, Ponting CP, Bork P, Burt DW, Groenen MA, Delany ME, Dodgson JB, Chinwalla AT, Cliften PF, Clifton SW, Delehaunty KD, Fronick C, Fulton RS, Graves TA, Kremitzki C, Layman D, Magrini V, McPherson JD, Miner TL, Minx P, Nash WE, Nhan MN, Nelson JO, Oddy LG, Pohl CS, Randall-Maher J, Smith SM, Wallis JW, Yang SP, Romanov MN, Rondelli CM, Paton B, Smith J, Morrice D, Daniels L, Tempest HG, Robertson L, Masabanda JS, Griffin DK, Vignal A, Fillon V, Jacobbson L, Kerje S, Andersson L, Crooijmans RP, Aerts J, van der Poel JJ, Ellegren H, Caldwell RB, Hubbard SJ, Grafham DV, Kierzek AM, McLaren SR, Overton IM, Arakawa H, Beattie KJ, Bezzubov Y, Boardman PE, Bonfield JK, Croning MD, Davies RM, Francis MD, Humphray SJ, Scott CE, Taylor RG, Tickle C, Brown WR, Rogers J, Buerstedde JM, Wilson SA, Stubbs L, Ovcharenko I, Gordon L, Lucas S, Miller MM, Inoko H, Shiina T, Kaufman J, Salomonsen J, Skjoedt K, Wong GK, Wang J, Liu B, Wang J, Yu J, Yang H, Nefedov M, Koriabine M, Dejong PJ, Goodstadt L, Webber C, Dickens NJ, Letunic I, Suyama M, Torrents D, von Mering C, Zdobnov EM, Makova K, Nekrutenko A, Elnitski L, Eswara P, King DC, Yang S, Tyekucheva S, Radakrishnan A, Harris RS, Chiaromonte F, Taylor J, He J, Rijnkels M, Griffiths-Jones S, Ureta-Vidal A, Hoffman MM, Severin J, Searle SM, Law AS, Speed D, Waddington D, Cheng Z, Tuzun E, Eichler E, Bao Z, Flicek P, Shteynberg DD, Brent MR, Bye JM, Huckle EJ, Chatterji S, Dewey C, Pachter L, Kouranov A, Mourelatos Z, Hatzigeorgiou AG, Paterson AH, Ivarie R, Brandstrom M, Axelsson E, Backstrom N, Berlin S, Webster MT, Pourquie O, Reymond A, Ucla C, Antonarakis SE, Long M, Emerson JJ, Betran E, Dupanloup I, Kaessmann H, Hinrichs AS, Bejerano G, Furey TS, Harte RA, Raney B, Siepel A, Kent WJ, Haussler D, Eyras E, Castelo R, Abril JF, Castellano S, Camara F, Parra G, Guigo R, Bourque G, Tesler G, Pevzner PA. Sequence and comparative analysis of the chicken genome provide unique perspectives on vertebrate evolution. Nature. 2004;432:695–716. doi: 10.1038/nature03154. [DOI] [PubMed] [Google Scholar]
- Hindorff LA, Sethupathy P, Junkins HA, Ramos EM, Mehta JP, Collins FS, Manolio TA. Potential etiologic and functional implications of genome-wide association loci for human diseases and traits. Proc. Natl. Acad. Sci. U.S.A. 2009;106:9362–9367. doi: 10.1073/pnas.0903103106. [DOI] [PMC free article] [PubMed] [Google Scholar]
- Horaitis O, Cotton RG. Human mutation databases. Curr. Protoc. Hum. Genet. 2005;44:7.11.1–7.11.13. doi: 10.1002/0471142905.hg0711s44. [DOI] [PubMed] [Google Scholar]
- International HapMap Consortium. Frazer KA, Ballinger DG, Cox DR, Hinds DA, Stuve LL, Gibbs RA, Belmont JW, Boudreau A, Hardenbol P, Leal SM, Pasternak S, Wheeler DA, Willis TD, Yu F, Yang H, Zeng C, Gao Y, Hu H, Hu W, Li C, Lin W, Liu S, Pan H, Tang X, Wang J, Wang W, Yu J, Zhang B, Zhang Q, Zhao H, Zhao H, Zhou J, Gabriel SB, Barry R, Blumenstiel B, Camargo A, Defelice M, Faggart M, Goyette M, Gupta S, Moore J, Nguyen H, Onofrio RC, Parkin M, Roy J, Stahl E, Winchester E, Ziaugra L, Altshuler D, Shen Y, Yao Z, Huang W, Chu X, He Y, Jin L, Liu Y, Shen Y, Sun W, Wang H, Wang Y, Wang Y, Xiong X, Xu L, Waye MM, Tsui SK, Xue H, Wong JT, Galver LM, Fan JB, Gunderson K, Murray SS, Oliphant AR, Chee MS, Montpetit A, Chagnon F, Ferretti V, Leboeuf M, Olivier JF, Phillips MS, Roumy S, Sallee C, Verner A, Hudson TJ, Kwok PY, Cai D, Koboldt DC, Miller RD, Pawlikowska L, Taillon-Miller P, Xiao M, Tsui LC, Mak W, Song YQ, Tam PK, Nakamura Y, Kawaguchi T, Kitamoto T, Morizono T, Nagashima A, Ohnishi Y, Sekine A, Tanaka T, Tsunoda T, Deloukas P, Bird CP, Delgado M, Dermitzakis ET, Gwilliam R, Hunt S, Morrison J, Powell D, Stranger BE, Whittaker P, Bentley DR, Daly MJ, de Bakker PI, Barrett J, Chretien YR, Maller J, McCarroll S, Patterson N, Pe’er I, Price A, Purcell S, Richter DJ, Sabeti P, Saxena R, Schaffner SF, Sham PC, Varilly P, Altshuler D, Stein LD, Krishnan L, Smith AV, Tello-Ruiz MK, Thorisson GA, Chakravarti A, Chen PE, Cutler DJ, Kashuk CS, Lin S, Abecasis GR, Guan W, Li Y, Munro HM, Qin ZS, Thomas DJ, McVean G, Auton A, Bottolo L, Cardin N, Eyheramendy S, Freeman C, Marchini J, Myers S, Spencer C, Stephens M, Donnelly P, Cardon LR, Clarke G, Evans DM, Morris AP, Weir BS, Tsunoda T, Mullikin JC, Sherry ST, Feolo M, Skol A, Zhang H, Zeng C, Zhao H, Matsuda I, Fukushima Y, Macer DR, Suda E, Rotimi CN, Adebamowo CA, Ajayi I, Aniagwu T, Marshall PA, Nkwodimmah C, Royal CD, Leppert MF, Dixon M, Peiffer A, Qiu R, Kent A, Kato K, Niikawa N, Adewole IF, Knoppers BM, Foster MW, Clayton EW, Watkin J, Gibbs RA, Belmont JW, Muzny D, Nazareth L, Sodergren E, Weinstock GM, Wheeler DA, Yakub I, Gabriel SB, Onofrio RC, Richter DJ, Ziaugra L, Birren BW, Daly MJ, Altshuler D, Wilson RK, Fulton LL, Rogers J, Burton J, Carter NP, Clee CM, Griffiths M, Jones MC, McLay K, Plumb RW, Ross MT, Sims SK, Willey DL, Chen Z, Han H, Kang L, Godbout M, Wallenburg JC, L’Archeveque P, Bellemare G, Saeki K, Wang H, An D, Fu H, Li Q, Wang Z, Wang R, Holden AL, Brooks LD, McEwen JE, Guyer MS, Wang VO, Peterson JL, Shi M, Spiegel J, Sung LM, Zacharia LF, Collins FS, Kennedy K, Jamieson R, Stewart J. A second generation human haplotype map of over 3.1 million SNPs. Nature. 2007;449:851–861. doi: 10.1038/nature06258. [DOI] [PMC free article] [PubMed] [Google Scholar]
- Kapushesky M, Emam I, Holloway E, Kurnosov P, Zorin A, Malone J, Rustici G, Williams E, Parkinson H, Brazma A. Gene expression atlas at the European bioinformatics. institute. Nucleic Acids Res. 2010;38:D690–D698. doi: 10.1093/nar/gkp936. [DOI] [PMC free article] [PubMed] [Google Scholar]
- Karolchik D, Hinrichs AS, Kent WJ. The UCSC genome browser. Curr. Protoc. Bioinform. 2009;28:1.4.1–1.4.26. doi: 10.1002/0471250953.bi0104s40. [DOI] [PubMed] [Google Scholar]
- Kent WJ. BLAT: The BLAST-like alignment tool. Genome Res. 2002;12:656–664. doi: 10.1101/gr.229202. [DOI] [PMC free article] [PubMed] [Google Scholar]
- Letunic I, Doerks T, Bork P. SMART 6: Recent updates and new developments. Nucleic Acids Res. 2009;37:D229–D232. doi: 10.1093/nar/gkn808. [DOI] [PMC free article] [PubMed] [Google Scholar]
- Levy S, Sutton G, Ng PC, Feuk L, Halpern AL, Walenz BP, Axelrod N, Huang J, Kirkness EF, Denisov G, Lin Y, MacDonald JR, Pang AW, Shago M, Stockwell TB, Tsiamouri A, Bafna V, Bansal V, Kravitz SA, Busam DA, Beeson KY, McIntosh TC, Remington KA, Abril JF, Gill J, Borman J, Rogers YH, Frazier ME, Scherer SW, Strausberg RL, Venter JC. The diploid genome sequence of an individual human. PLoS Biol. 2007;5:e254. doi: 10.1371/journal.pbio.0050254. [DOI] [PMC free article] [PubMed] [Google Scholar]
- Lucotte G, Dieterlen F. A European allele map of the C282Y mutation of hemochromatosis: Celtic versus viking origin of the mutation? Blood Cells Mol. Dis. 2003;31:262–267. doi: 10.1016/s1079-9796(03)00133-5. [DOI] [PubMed] [Google Scholar]
- McDowall J, Hunter S. InterPro protein classification. Methods Mol. Biol. 2011;694:37–47. doi: 10.1007/978-1-60761-977-2_3. [DOI] [PubMed] [Google Scholar]
- Nikolaev LG, Akopov SB, Didych DA, Sverdlov ED. Vertebrate protein CTCF and its multiple roles in a large-scale regulation of genome activity. Cur. Genomics. 2009;10:294–302. doi: 10.2174/138920209788921038. [DOI] [PMC free article] [PubMed] [Google Scholar]
- Parkinson H, Kapushesky M, Kolesnikov N, Rustici G, Shojatalab M, Abeygunawardena N, Berube H, Dylag M, Emam I, Farne A, Holloway E, Lukk M, Malone J, Mani R, Pilicheva E, Rayner TF, Rezwan F, Sharma A, Williams E, Bradley XZ, Adamusiak T, Brandizi M, Burdett T, Coulson R, Krestyaninova M, Kurnosov P, Maguire E, Neogi SG, Rocca-Serra P, Sansone SA, Sklyar N, Zhao M, Sarkans U, Brazma A. ArrayExpress update: From an archive of functional genomics experiments to the atlas of gene expression. Nucleic Acids Res. 2009;37:D868–D872. doi: 10.1093/nar/gkn889. [DOI] [PMC free article] [PubMed] [Google Scholar]
- Paten B, Herrero J, Beal K, Fitzgerald S, Birney E. Enredo and Pecan: Genome-wide mammalian consistency-based multiple alignment with paralogs. Genome Res. 2008;18:1814–1828. doi: 10.1101/gr.076554.108. [DOI] [PMC free article] [PubMed] [Google Scholar]
- Ponten F, Jirstrom K, Uhlen M. The Human Protein Atlas: A tool for pathology. J. Pathol. 2008;216:387–393. doi: 10.1002/path.2440. [DOI] [PubMed] [Google Scholar]
- Pruitt KD, Harrow J, Harte RA, Wallin C, Diekhans M, Maglott DR, Searle S, Farrell CM, Loveland JE, Ruef BJ, Hart E, Suner MM, Landrum MJ, Aken B, Ayling S, Baertsch R, Fernandez-Banet J, Cherry JL, Curwen V, Dicuccio M, Kellis M, Lee J, Lin MF, Schuster M, Shkeda A, Amid C, Brown G, Dukhanina O, Frankish A, Hart J, Maidak BL, Mudge J, Murphy MR, Murphy T, Rajan J, Rajput B, Riddick LD, Snow C, Steward C, Webb D, Weber JA, Wilming L, Wu W, Birney E, Haussler D, Hubbard T, Ostell J, Durbin R, Lipman D. The consensus coding sequence (CCDS) project: Identifying a common protein-coding gene set for the human and mouse genomes. Genome Res. 2009a;19:1316–1323. doi: 10.1101/gr.080531.108. [DOI] [PMC free article] [PubMed] [Google Scholar]
- Pruitt KD, Tatusova T, Klimke W, Maglott DR. NCBI reference sequences: Current status, policy and new initiatives. Nucleic Acids Res. 2009b;37:D32–D36. doi: 10.1093/nar/gkn721. [DOI] [PMC free article] [PubMed] [Google Scholar]
- Rakyan VK, Down TA, Thorne NP, Flicek P, Kulesha E, Graf S, Tomazou EM, Backdahl L, Johnson N, Herberth M, Howe KL, Jackson DK, Miretti MM, Fiegler H, Marioni JC, Birney E, Hubbard TJ, Carter NP, Tavare S, Beck S. An integrated resource for genome-wide identification and analysis of human tissue-specific differentially methylated regions (tDMRs) Genome Res. 2008;18:1518–1529. doi: 10.1101/gr.077479.108. [DOI] [PMC free article] [PubMed] [Google Scholar]
- Sayers EW, Barrett T, Benson DA, Bolton E, Bryant SH, Canese K, Chetvernin V, Church DM, Dicuccio M, Federhen S, Feolo M, Geer LY, Helmberg W, Kapustin Y, Landsman D, Lipman DJ, Lu Z, Madden TL, Madej T, Maglott DR, Marchler-Bauer A, Miller V, Mizrachi I, Ostell J, Panchenko A, Pruitt KD, Schuler GD, Sequeira E, Sherry ST, Shumway M, Sirotkin K, Slotta D, Souvorov A, Starchenko G, Tatusova TA, Wagner L, Wang Y, John Wilbur W, Yaschenko E, Ye J. Database resources of the National Center for Biotechnology Information. Nucleic Acids Res. 2009;38:D5–D16. doi: 10.1093/nar/gkp967. [DOI] [PMC free article] [PubMed] [Google Scholar]
- Searle S, Frankish A, Bignell A, Aken B, Derrien T, Diekhans M, Harte R, Howald C, Kokocinski F, Lin M, Tress M, Van Baren M, Barnes I, Hunt T, Carvalho-Silva D, Davidson C, Donaldson S, Gilbert J, Kay M, Lloyd D, Loveland J, Mudge J, Snow C, Vamathevan J, Wilming L, Brent M, Gerstein M, Guigó R, Kellis M, Reymond A, Zadissa A, Valencia A, Harrow J, Hubbard T. The GENCODE human gene set. Genome Biol. 2010;11:P36. [Google Scholar]
- Sigrist CJ, Cerutti L, de Castro E, Langendijk-Genevaux PS, Bulliard V, Bairoch A, Hulo N. PROSITE, a protein domain database for functional characterization and annotation. Nucleic Acids Res. 2010;38:D161–D166. doi: 10.1093/nar/gkp885. [DOI] [PMC free article] [PubMed] [Google Scholar]
- Sterk P, Kulikova T, Kersey P, Apweiler R. The EMBL nucleotide sequence and genome reviews databases. Methods Mol. Biol. 2007;406:1–21. doi: 10.1007/978-1-59745-535-0_1. [DOI] [PubMed] [Google Scholar]
- UniProt Consortium. The Universal Protein Resource (UniProt) in 2010. Nucleic Acids Res. 2010;38:D142–D148. doi: 10.1093/nar/gkp846. [DOI] [PMC free article] [PubMed] [Google Scholar]
- Visel A, Minovitsky S, Dubchak I, Pennacchio LA. VISTA enhancer browser: A database of tissue-specific human enhancers. Nucleic Acids Res. 2007;35:D88–D92. doi: 10.1093/nar/gkl822. [DOI] [PMC free article] [PubMed] [Google Scholar]
- Wheeler DA, Srinivasan M, Egholm M, Shen Y, Chen L, McGuire A, He W, Chen YJ, Makhijani V, Roth GT, Gomes X, Tartaro K, Niazi F, Turcotte CL, Irzyk GP, Lupski JR, Chinault C, Song XZ, Liu Y, Yuan Y, Nazareth L, Qin X, Muzny DM, Margulies M, Weinstock GM, Gibbs RA, Rothberg JM. The complete genome of an individual by massively parallel DNA sequencing. Nature. 2008;452:872–876. doi: 10.1038/nature06884. [DOI] [PubMed] [Google Scholar]
- Wilming LG, Gilbert JG, Howe K, Trevanion S, Hubbard T, Harrow JL. The vertebrate genome annotation (Vega) database. Nucleic Acids Res. 2008;36:D753–D760. doi: 10.1093/nar/gkm987. [DOI] [PMC free article] [PubMed] [Google Scholar]
- Wilson D, Pethica R, Zhou Y, Talbot C, Vogel C, Madera M, Chothia C, Gough J. SUPERFAMILY: Sophisticated comparative genomics, data mining, visualization and phylogeny. Nucleic Acids Res. 2009;37:D380–D386. doi: 10.1093/nar/gkn762. [DOI] [PMC free article] [PubMed] [Google Scholar]


