

Abstract
AIMS
To describe pain intensity (PI) measured on a visual analogue scale (VAS) and dropout due to request for rescue medication after administration of naproxcinod, naproxen or placebo in 242 patients after wisdom tooth removal.
METHODS
Non-linear mixed effects modelling was used to describe the plasma concentrations of naproxen, either formed from naproxcinod or from naproxen itself, and their relationship to PI and dropout. Goodness of fit was assessed by simultaneous simulations of PI and dropout.
RESULTS
Baseline PI for the typical patient was 52.7 mm. The PI was influenced by placebo effects, using an exponential model, and by naproxen concentrations using a sigmoid Emax model. Typical maximal placebo effect was a decrease in PI by 20.2%, with an onset rate constant of 0.237 h−1. EC50 was 0.135 µmol l−1. A Weibull time-to-event model was used for the dropout, where the hazard was dependent on the predicted PI and by the PI at baseline. Since the dropout was not at random, it was necessary to include the simulated dropout in visual predictive checks (VPC) of PI.
CONCLUSIONS
This model describes the relationship between drug effects, PI and the likelihood of dropout after naproxcinod, naproxen and placebo administration. The model provides an opportunity to describe the effects of other doses or formulations, after dental extraction. VPC created by simultaneous simulations of PI and dropout provides a good way of assessing the goodness of fit when there is informative dropout.
Keywords: dropout, naproxcinod, naproxen, NONMEM, time to event
WHAT IS ALREADY KNOWN ABOUT THIS SUBJECT
Modelling has been used to describe the pain relief and dropout for a few non-steroidal anti-inflammatory drugs.
WHAT THIS STUDY ADDS
This study shows the relationship between dose, plasma concentration, pain intensity and dropout for naproxen and naproxcinod. It also extends previous models by using a visual analogue scale for pain intensity instead of modelling pain relief on a categorical scale, and shows the value of including informative dropout in the simulations for visual predictive checks.
Introduction
The removal of a wisdom tooth is a painful procedure that is commonly used to study the effects of new investigational compounds intended for the treatment of pain. Modelling of the pain intensity (PI) or pain relief is complicated by informative dropout due to intake of rescue medication. The observed PI at different times after administration of study drug is dependent on dropout due to intake of rescue medication, and at the same time the probability of requesting rescue medication is dependent on the PI. Therefore, at the end of the treatment period, the difference in observed PI is small between patients on placebo or different treatments, since the patients remaining in the study are those who are no longer in pain, regardless of treatment. When modelling the course of PI during a study it is therefore important to take the dropout into consideration.
Naproxcinod (AZD3582, HCT 3012) is a cyclo-oxygenase-inhibiting nitric oxide (NO) donor that is rapidly metabolized to naproxen and an NO-donating moiety. Its efficacy in acute and chronic pain has been shown in several studies [1–4]. In this analysis the pharmacokinetics (PK) of naproxen, either formed after administration of naproxcinod or given as naproxen itself, were used as an input to the pharmacodynamic (PD) model.
Pain relief, measured on a categorical scale, and the intake of rescue medication has previously been modelled for other cyclo-oxygenase inhibitors [5–7], and joint modelling of longitudinal data with informative dropout has also been performed in other therapeutic areas [8, 9]. The objective of this analysis was to model PI on a 100 mm VAS, which could be regarded as a continuous scale, together with the probability of requesting rescue medication, and to use visual predictive checks (VPC) based on simultaneous simulations of both PI and dropout to assess the goodness of fit.
Methods
Study design
In a randomized, double-blind dose-finding study, mandibular wisdom teeth were removed during local anaesthesia using a standard surgical procedure. Patients requesting pain relief within 6 h after administration of local anaesthetic, and who had a PI of at least 40 mm on a 100 mm VAS, were randomized to either of six treatments; naproxcinod 375, 750, 1500 or 2250 mg (n = 41, 37, 42 and 41, respectively), naproxen 500 mg (n = 39) or placebo (n = 42). A total of 242 patients, 48% male and 52% female, age ranging from 19 to 38 years and body mass index ranging from 18 to 31 kg m−2 were included in the study (Table 1). All treatments were formulated as hard gelatine capsules of identical appearance to ensure blinding. Patients needing additional pain relief could request rescue medication, ibuprofen 400 mg, and the time of requesting rescue medication was recorded. The patients were asked to refrain from rescue medication until 1.5 h after administration of study drug, but were allowed to take rescue medication if they could not wait. PI was measured on a 100 mm VAS immediately prior to drug administration (baseline) and at 0.5, 1, 1.5, 2, 2.5, 3, 4, 5, 6, 7 and 8 h after administration of study drug, and immediately before administration of rescue medication. After intake of rescue medication no more measurements of PI were made. Venous plasma was collected in 15, 12, 18, 15, and 16 patients in the naproxcinod 375, 750, 1500 or 2250 mg and naproxen groups, respectively, at randomization and at 0.5, 1, 1.5, 2, 2.5, 3, 4, 5, 6, 7 and 8 h after administration of study drug, and at time of first meaningful pain relief. The plasma was analyzed at Quintiles AB, Uppsala, Sweden, for total concentrations of naproxen by reversed-phase liquid chromatography with fluorescence detection, with direct injection of diluted plasma. The limit of quantification was 0.5 µmol l−1 and the accuracy varied between 98.2 and 101.7% in the concentration range 1.5–400 µmol l−1. In addition, unbound concentrations of naproxen were measured at 1, 3 and 8 h post-dose, using ultrafiltration. After dilution the protein free fraction was directly injected into a reversed-phase liquid chromatograph with fluorescence detection. For unbound naproxen concentration the limit of quantification was 5 nmol l−1 and accuracy varied between 97.5% and 102.5% in the concentration range 12.5–3200 nmol l−1. The study was sponsored by AstraZeneca and performed at the Eastman International Centre for Excellence in Dentistry, London, United Kingdom, in accordance with International Conference on Harmonisation (ICH) Good Clinical Practice (GCP). The study was approved by Quorn Research Review Committee, Leicestershire, United Kingdom, and written informed consent was collected from all patients before inclusion in the study. More details of the study design, as well as the primary efficacy and safety results of the study, were presented by Hill et al. [1].
Table 1.
Demographic and baseline characteristics. Mean (range)
| Naproxcinod | Naproxen | |||||
|---|---|---|---|---|---|---|
| 375 mg | 750 mg | 1500 mg | 2250 mg | 500 mg | Placebo | |
| N | 41 | 37 | 42 | 41 | 39 | 42 |
| Sex % M : F | 41:59 | 54:46 | 45:55 | 41:59 | 49:51 | 57:43 |
| Age (years) | 25.3 (20–33) | 25.1 (19–32) | 25.0 (20–33) | 24.0 (19–32) | 25.4 (19–38) | 25.6 (19–34) |
| BMI (kg m–2) | 23.3 (19–30) | 23.7 (20–30) | 23.6 (19–29) | 23.9 (18–31) | 23.8 (18–29) | 23.9 (19–30) |
| Baseline pain intensity (mm) | 59 (29–100) | 55 (19–88) | 55 (7–100) | 55 (24–100) | 58 (18–82) | 56 (25–91) |
| Duration of surgery (min) | 9.4 (4–20) | 10.1 (3–23) | 8.7 (3–22) | 9.2 (3–34) | 10.2 (1–25) | 9.7 (4–23) |
Data analysis
The modelling analysis of total and unbound plasma concentrations, PI and time to request of rescue medication was performed using the software NONMEM VI (ICON, Hanover, MD, USA) [10]. The Laplace estimation method was used for both the fit of PK data only and the simultaneous fit of PK, PI and dropout.
A non-linear mixed effects model was developed, to describe simultaneously the PK, PI and dropout. In a first step, the PK of total and unbound concentrations of naproxen were analyzed. The typical and random effect parameter estimates from the final PK model were then fixed in the subsequent PK/PD analysis, but still keeping the observed concentration data in the PK/PD data set. This sequential PK/PD approach conditions on both population PK parameter estimates and PK data, and estimates PD parameters and their standard errors about as well as a simultaneous fit [11]. For the PK/PD analysis a placebo sub-model for PI was first developed on placebo data only, and the placebo parameters were then fixed in the development of the drug effect sub-model for PI and request of rescue medication. When the drug effect sub-model was established, the final model was run without fixing the placebo parameters.
Pharmacokinetic model
One- and two-compartment disposition models were evaluated for the PK, as well as several different absorption models, including first order, zero order, sequential zero and first order absorption, with and without lag-time, and a transit compartment model [12]. Unbound oral clearance and volume of distribution were assumed to be the same regardless of treatment, while the absorption properties were different for naproxcinod and naproxen. The bioavailability of naproxen after naproxcinod administration, relative to that after naproxen administration, was estimated. Exponential interindividual variability was assumed.
Naproxen is highly bound to plasma proteins and the unbound fraction increases with increasing concentrations [13]. To assess the relationship between unbound and total concentrations a binding model was used:
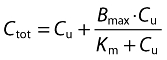 |
where Ctot is the total concentration of naproxen, Cu is the unbound concentration of naproxen, Bmax is the maximum binding of naproxen to plasma proteins and Km is the unbound concentrations needed to achieve half of the maximum binding. The model therefore assumed linear PK for unbound concentrations, while the total concentrations were increasing less than in proportion to the dose. Additive, proportional and combined additive-proportional residual error models were investigated for both total and unbound concentrations.
Model for PI
The model describing the relationship between PK and PI consisted of two sub-models, one describing the placebo response and one describing the drug effects. The two sub-models were combined according to:
where PIbaseline is the PI at baseline, and Placebo and Drug are the placebo and drug effects, respectively.
For the placebo response exponential, inverse Bateman and Weibull functions were explored.
Exponential:
where Pmax is the maximum placebo effect and kpl is the rate constant for onset of placebo effect.
Inverse Bateman:
where Pmax is the maximum placebo effect and kon and koff are the rate constants for onset and offset of placebo effect, respectively.
Weibull:
where Pmax is the maximum placebo effect and λ and k are the scale and shape parameters of the Weibull function.
For the placebo response exponential interindividual variability was assumed, except for Pmax where an additive model was used, allowing for PI to either increase or decrease from the baseline value. In addition, a mixture model of Pmax and Box-Cox transformation of kpl were assessed. In the drug effect model the unbound concentrations of naproxen were related to the effect using an Emax or sigmoid Emax model according to:
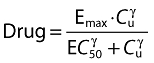 |
where Emax is the maximum effect, EC50 is the concentration needed to achieve half of the maximum effect, Cu is the unbound naproxen concentration and γ is a shape factor. An additive residual error model for PI was used. Boundaries on PI were set so that any prediction of PI above 100 or below 0 were set to 100 or 0, respectively.
Model for request of rescue medication
The time to request of rescue medication was described using a time-to-event model where the hazard of requesting rescue medication was modelled as:
where h(t) is the hazard at time t, h0 is the hazard without influence of covariates, and COV is the influence of covariates on the hazard. h0 was described using different hazard distributions like exponential, Weibull and Gompertz:
Exponential:
where k describes a constant hazard.
Gompertz:
where k is the hazard at time 0, a is a shape parameter, and t is time.
Weibull:
where λ and α are the scale and shape parameters of the Weibull distribution, respectively, and t is time.
The influence of PI and baseline PI on the hazard were explored with linear and exponential models for the effect of PI or PI difference from baseline on the hazard. PIbaseline was also investigated as a covariate on the effect of PI on the hazard. Since the patients were asked to refrain from rescue medication until 1.5 h after administration of study drug, the hazard during the first 1.5 h was set to zero, and time in the hazard models was counted with start at 1.5 h. Three subjects took rescue medication before 1.5 h and were excluded from the analysis.
The likelihood of not having requested rescue medication at time t, S(t), was described as a function of the hazard:
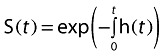 |
The probability density of requesting rescue medication at time t, f(t), was described by:
The models for PI and request for rescue medication were developed simultaneously, using the F_FLAG option in NONMEM. NONMEM allows simultaneous modelling of continuous and categorical data, where PI is continuous and dropout is treated as categorical data. The data type of each record is indicated by different values for F_FLAG in NONMEM.
Model selection and evaluation
Models were selected based on goodness of fit plots [14], precision in parameter estimates, and statistically using the Objective Function Value (OFV). A drop in OFV by 6.63 (P < 0.01) was required for a parameter to be included in the model. Conditional weighted residuals were derived using PsN [15] and Xpose [14]. The models were evaluated using VPC in PsN and R (http://www.r-project.org). PI and request for rescue medication were simulated simultaneously, and once a patient was simulated to request rescue medication no further PI measurements were simulated in that patient. Each VPC for the PK model was based on 2000 simulations, and the VPCs for PI and rescue medication were based on 100 simulations. Standard errors of the PK parameters were calculated by NONMEM, and standard errors of the PD parameters were calculated by bootstrap using PsN.
Results
Pharmacokinetic model
The PK of naproxen after administration of naproxcinod or naproxen was best described by a one-compartment model with transit compartment absorption. Mean transit times were 1.8 and 0.5 h for naproxcinod and naproxen, respectively. Oral clearance of unbound naproxen was 515 l h−1 and the unbound volume of distribution was 4290 l. A saturable protein binding was found, with a Km of 0.549 µmol l−1. Parameter estimates of the final PK model are shown in Table 2, and VPCs for total and unbound concentrations are found in Figure 1.
Table 2.
Parameter estimates for the final PK model of total and unbound naproxen
| Parameter | Estimate (RSE%) | IIV (RSE%) | Description |
|---|---|---|---|
| CLu/F (l h–1) | 515 (12.1) | 25 (37) | Oral unbound clearance |
| Vu/F (l) | 4290 (13.6) | 44 (29) | Oral unbound volume of distribution |
| MTTnaproxcinod (h) | 1.77 (10.8) | 58 (24) | Mean transit time for naproxcinod |
| NNnaproxcinod | 3.58 (9.9) | 58 (26) | Number of transit compartments for naproxcinod |
| MTTnaproxen (h) | 0.500 (23.8) | 100 (60) | Mean transit time for naproxen |
| NNnaproxen | 4.23 (24.8) | 64 (68) | Number of transit compartments for naproxen |
| Bmax (µmol l–1) | 643 (7.1) | 17 (44) | Maximum binding of naproxen to plasma proteins |
| Km (µmol l–1) | 0.549 (10.2) | – | Naproxen concentration at half maximum binding |
| Frel (%) | 59.7 (14.6) | – | Relative naproxen bioavailability compared with naproxen dosing |
| σT,add (µmol l–1) | 6.19 (22.3) | – | Additive residual variability for total naproxen concentrations |
| σT,prop (%) | 8.43 (8.0) | – | Proportional residual variability for total naproxen concentrations |
| σU,prop (%) | 18.6 (11.0) | – | Proportional residual variability for unbound naproxen concentrations |
| Corr. MTT-NN (%) | –52 (38) | – | Correlation between MTTnaproxcinod and NNnaproxcinod |
RSE% relative standard error calculated as the ratio between the standard error and the estimate, and multiplied by 100, IIV inter-individual variability in % of the parameter estimate.
Figure 1.
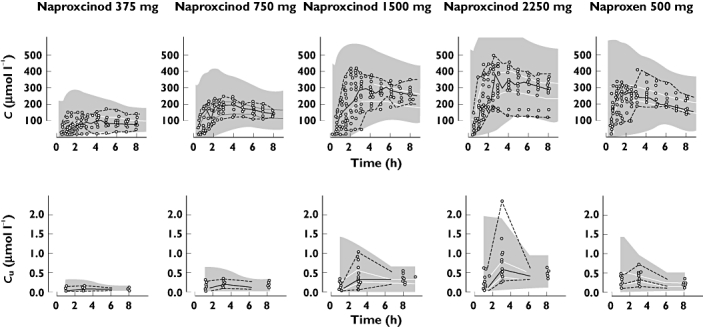
Visual predictive check of total (top row) and unbound (bottom row) concentrations of naproxen vs. time after administration of naproxcinod 375 mg, 750 mg, 1500 mg and 2250 mg or naproxen 500 mg, based on the final PK model. Open circles represent the observations and the lines represent the median, 2.5th and 97.5th percentile of the observations. The shaded areas represent the 95% CI for the simulated median and 2.5th and 97.5th percentiles
Pain intensity model
The placebo effect was described by an exponential model, where Pmax was a decrease in VAS by 20.2%. A sigmoid Emax model was used to describe the drug effect on PI. Emax was estimated close to 1, the upper boundary, and was therefore fixed to 1. EC50 was 0.135 µmol l−1. Parameter estimates for the PK-PI model is found in Table 3. VPCs of PI with and without simulating the request for rescue medication are found in Figure 2.
Table 3.
Parameter estimates for the final PK/PD model
| Parameter | Estimate (RSE%) | IIV (RSE%) | Description |
|---|---|---|---|
| PIbaseline (mm) | 52.7 (13.4) | 32 (27) | Baseline pain intensity |
| Pmax (%) | 20.2 (12.2) | 120 (16) | Maximum placebo response |
| kpl (h−1) | 0.237 (68.8) | 43 (39) | Rate constant for placebo effect |
| EC50 (µmol l–1) | 0.135 (10.4) | 120 (21) | Unbound concentration needed for half maximum effect |
| γ | 1.61 (12.4) | – | Shape factor |
| σPI (mm) | 7.82 (13.3) | – | Residual variability for pain intensity |
| λ | 0.00999 (15.6) | – | Scale parameter in the Weibull distribution |
| α | 0.729 (9.9) | – | Shape parameter in the Weibull distribution |
| θPI | 0.0782 (9.2) | – | Influence of current PI on the hazard |
| θbaseline | –0.00261 (19.2) | – | Influence of baseline PI on the hazard |
RSE% relative standard error calculated as the ratio between the standard error and the estimate, and multiplied by 100, IIV inter-individual variability in % of the parameter estimate.
Figure 2.
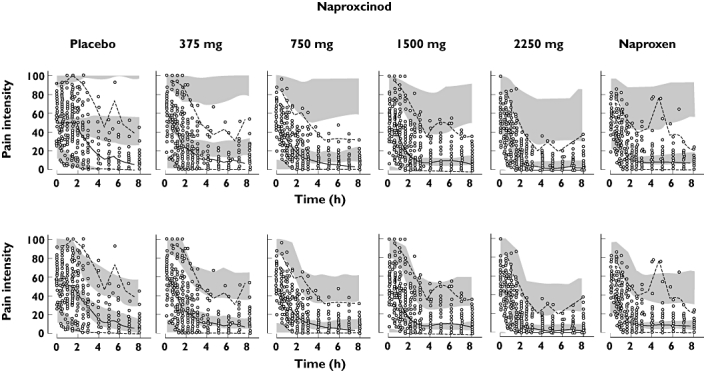
Visual predictive check of pain intensity (PI) vs. time after administration of naproxcinod 375 mg, 750 mg, 1500 mg and 2250 mg, naproxen 500 mg or placebo, based on the final PK/PD model. The top row is simulated without dropout and the bottom row is simulated with dropout. Open circles represent the observations and the lines represent the median, 2.5th and 97.5th percentile of the observations. The shaded areas represent the 95% CI for the simulated median and 2.5th and 97.5th percentiles
Dropout model
A Weibull time-to-event model was used in order to describe the time to request for rescue medication. PI was found to have a large impact on the hazard, the higher the PI the larger the dropout hazard. The PI at baseline was also found to impact the hazard. Subjects entering the study with a high PI had a lower hazard at a given PI than those entering the study with low PI. The final model for the influence of covariates on the hazard was described as:
where θPI describes the contribution of PI at time t, PIt, to the hazard, and θbaseline describes the influence of the difference of PIbaseline from the median, 55, on θPI. The parameter estimates for the rescue medication model are found in Table 3 and VPCs of the request for rescue medication are found in Figure 3.
Figure 3.
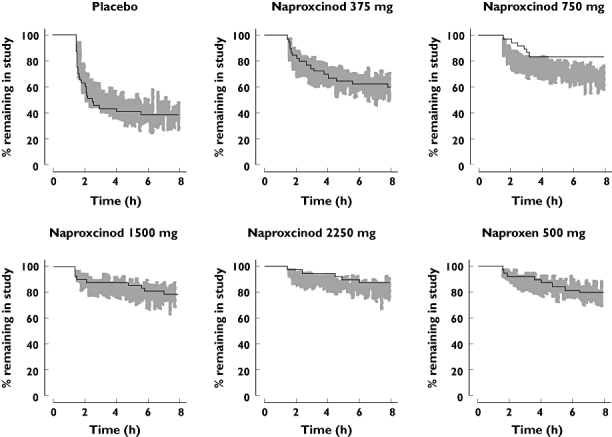
Visual predictive check of time to request of rescue medication after administration of naproxcinod 375 mg, 750 mg, 1500 mg and 2250 mg, naproxen 500 mg or placebo, based on the final PK/PD model. Solid line represents the observed Kaplan-Meier curve and the shaded area represents the 90% prediction interval for the simulated Kaplan-Meier curve
Discussion
This analysis describes a model for PI on a 100 mm VAS together with informative dropout, as well as goodness of fit graphics based on simulations that take the dropout into consideration. Parts of the model, including the baseline and placebo effect and the effect of PI on the risk of dropout, are independent of the drug and can be expected to be similar in other studies, while the drug effect model may change with different drugs. The intended use of the model was to predict the effects of new formulations with different absorption properties, but the model could also be used to assess the effects of different doses, and potentially other drugs.
These data show that the risk of requesting rescue medication increases with increasing PI, and since the drug reduces the PI it also reduces the risk of requesting rescue medication. This is taken into account in the combined model for PI and rescue medication. The shape parameter of the Weibull model for request for rescue medication was below 1, which indicates that the hazard at a given level of PI decreases with time. This means that the longer a patient has been able to tolerate a certain level of pain, the less likely is the patient to request rescue medication during the next interval of time. The influence of PI on the hazard was dependent on the PIbaseline. Patients with a high baseline PI had a lower hazard at a given PI compared with patients with a low baseline hazard.
This analysis assumes that the effects of naproxcinod and naproxen on PI and dropout are due to the exposure to naproxen. Plasma concentrations of naproxen were only measured in approximately one third of the patients. The rest of the patients could still be included in the PD model, since the PK parameters were included, but fixed, in the PD model. The patients without any PK samples had predictions of their PK based on both the PK and the PD model.
Since naproxcinod was rapidly hydrolyzed to naproxen during the absorption, the transit-compartment model for naproxcinod described both the formation and the absorption of naproxen, and different number of transit-compartments and mean transit times were therefore used for naproxcinod and naproxen. The transit compartment absorption model describes drug absorption as a multiple step process represented by a chain of presystemic compartments, without assigning a physical correlate to each transit compartment [12, 16]. The absorption transit model describes the concentration–time profile as a gradually increasing continuous function. Hence, the nature of the transit model is more descriptive of the physiological conditions than a lag-time model, although the number of estimated transit compartments is not related to physical compartments. The analytical solution also allows for a non-integer number of transit compartments. The variability in observed plasma concentrations of naproxen was to a large extent due to variability in the absorption parameters. The concentration data was collected mainly during the early phase, up to 8 h compared with the approximately 14 h half-life of naproxen [17], which may have led to slight differences in the parameter estimates compared with repeated dosing [18]. Even though the one-compartment model used in this analysis showed a good prediction of the observed plasma concentrations, one should be cautious to extrapolate longer than the 8 h studied, as a second phase might be present at later time points. This study was performed using single doses in acute pain, while naproxcinod was developed and submitted to regulatory authorities for the treatment of osteoarthritis using repeated dosing.
For the model discrimination, simulation based graphical goodness of fit plots were used. Friberg et al. [19] have previously shown the value of including dropout in simulations and VPCs. The need for taking the informative dropout into account is in this study clearly shown in the VPCs for PI. When dropout is ignored the simulations show high PI at the end of the study for the placebo group, while the actual observed PI is much lower. The prediction intervals are also large. When dropout is included in the simulations the simulated and observed PI are similar, reflecting the fact that those with the highest PI have dropped out at the end of the study.
In conclusion, the effects of naproxcinod and naproxen on PI and dropout after dental extraction could be described by a simultaneous model of PK, PI and dropout due to request for rescue medication. The request for rescue medication was shown to be dependent on the current PI and the PI at baseline, and the observed PI was dependent on naproxen concentrations and the dropout. VPCs created by simultaneous simulations of a continuous variable and time to event provide a good way of assessing the goodness of fit when there is informative dropout.
Acknowledgments
We thank Klas Petersson, Department of Pharmaceutical Biosciences, Uppsala University, Sweden, for valuable help with the R script for VPC of PI including dropout.
Competing Interests
M. B. is an employee of AstraZeneca and U. S. was employed by AstraZeneca from 2006–2008. M. B. holds stocks in Astra Zeneca. U.S. has received funds for research from Astra Zeneca.
REFERENCES
- 1.Hill CM, Sindet-Pederson S, Seymour RA, Hawkesford JE, III, Coulthard P, Lamey P-J, Cowan CG, Wickens M, Jeppsson L, Dean ADP, Svensson O. Analgesic efficacy of the cyclooxygenase-inhibiting nitric oxide donor AZD3582 in postoperative dental pain: comparison with naproxen and rofecoxib in two randomized, double-blind, placebo-controlled studies. Clin Ther. 2006;28:1279–95. doi: 10.1016/j.clinthera.2006.09.015. [DOI] [PubMed] [Google Scholar]
- 2.Lohmander LS, McKeith D, Svensson O, Malmenäs M, Bolin L, Kalla A, Genti G, Szechinski J, Ramos-Remos C. A randomised, placebo controlled, comparative trial of the gastrointestinal safety and efficacy of AZD3582 versus naproxen in osteoarthritis. Ann Rheum Dis. 2005;64:449–56. doi: 10.1136/ard.2004.023572. [DOI] [PMC free article] [PubMed] [Google Scholar]
- 3.Schnitzer TJ, Kivitz AJ, Lipetz RS, Sanders N, Hee A. Comparison of the COX-inhibiting nitric oxide donator AZD3582 and rofecoxib in treating the signs and symptoms of osteoarthritis of the knee. Arthritis Rheum. 2005;53:827–37. doi: 10.1002/art.21586. [DOI] [PubMed] [Google Scholar]
- 4.Karlsson J, Pivodic A, Aguirre D, Schnitzer TJ. Efficacy, safety, and tolerability of the cyclooxygenase-inhibiting nitric oxide donator naproxcinod in treating osteoarthritis of the hip or knee. J Rheumatol. 2009;36:1290–7. doi: 10.3899/jrheum.081011. [DOI] [PubMed] [Google Scholar]
- 5.Sheiner LB. A new approach to the analysis of analgesic drug trials, illustrated with bromfenac data. Clin Pharmacol Ther. 1994;56:309–22. doi: 10.1038/clpt.1994.142. [DOI] [PubMed] [Google Scholar]
- 6.Mandema JW, Stanski DR. Population pharmacodynamic model for ketorolac analgesia. Clin Pharmacol Ther. 1996;60:619–35. doi: 10.1016/S0009-9236(96)90210-6. [DOI] [PubMed] [Google Scholar]
- 7.Rohatagi S, Kastrissios H, Sasahara K, Truitt K, Moberly JB, Wada R, Salazar DE. Pain relief model for a COX-2 inhibitor in patients with postoperative dental pain. Br J Clin Pharmacol. 2008;66:60–70. doi: 10.1111/j.1365-2125.2008.03175.x. [DOI] [PMC free article] [PubMed] [Google Scholar]
- 8.Hu C, Sale ME. A joint model for nonlinear longitudinal data with informative dropout. J Pharmacokinet Pharmacodyn. 2003;30:83–103. doi: 10.1023/a:1023249510224. [DOI] [PubMed] [Google Scholar]
- 9.Frame B, Miller R, Hutmacher MM. Joint modeling of dizziness, drowsiness, and dropout associated with pregabalin and placebo treatment of generalized anxiety disorder. J Pharmacokinet Pharmacodyn. 2009;36:565–84. doi: 10.1007/s10928-009-9137-5. [DOI] [PubMed] [Google Scholar]
- 10.Beal SL, Sheiner LB, Boeckmann AJ. NONMEM Users Guides. Ellicott City, MD: ICON Development Solutions; 1989. –2006. [Google Scholar]
- 11.Zhang L, Beal SL, Sheiner LB. Simultaneous vs. sequential analysis for population PK/PD data I: best-case performance. J Pharmacokinet Pharmacodyn. 2003;30:387–404. doi: 10.1023/b:jopa.0000012998.04442.1f. [DOI] [PubMed] [Google Scholar]
- 12.Savic RM, Jonker DM, Kerbusch T, Karlsson MO. Implementation of a transit compartment model for describing drug absorption in pharmacokinetic studies. J Pharmacokinet Pharmacodyn. 2007;34:711–26. doi: 10.1007/s10928-007-9066-0. [DOI] [PubMed] [Google Scholar]
- 13.Runkel R, Forchielli E, Sevelius H, Chaplin M, Segre E. Nonlinear plasma level response to high doses of naproxen. Clin Pharmacol Ther. 1974;15:261–6. doi: 10.1002/cpt1974153261. [DOI] [PubMed] [Google Scholar]
- 14.Jonsson EN, Karlsson MO. Xpose – an S PLUS population pharmacokinetic/pharmacodynamic model building aid for NONMEM. Comput Methods Programs Biomed. 1999;58:51–64. doi: 10.1016/s0169-2607(98)00067-4. [DOI] [PubMed] [Google Scholar]
- 15.Lindbom L, Pihlgren P, Jonsson EN. PsN-Toolkit – a collection of computer intensive statistical methods for non-linear mixed effect modeling using NONMEM. Comput Methods Programs Biomed. 2005;79:241–57. doi: 10.1016/j.cmpb.2005.04.005. [DOI] [PubMed] [Google Scholar]
- 16.Wilkins JJ, Langdon G, McIlleron H, Pillai GC, Smith PJ, Simonsson US. Variability in the population pharmacokinetics of pyrazinamide in South African tuberculosis patients. Eur J Clin Pharmacol. 2006;62:727–35. doi: 10.1007/s00228-006-0141-z. [DOI] [PubMed] [Google Scholar]
- 17.Runkel R, Chaplin M, Boost G, Segre E, Forchielli E. Absorption, distribution, metabolism, and excretion of naproxen in various laboratory animals and human subjects. J Pharm Sci. 1972;61:703–8. doi: 10.1002/jps.2600610507. [DOI] [PubMed] [Google Scholar]
- 18.Fagerholm U, Björnsson MA. Clinical pharmacokinetics of the cyclooxygenase inhibiting nitric oxide donator (CINOD) AZD3582. J Pharm Pharmacol. 2005;57:1539–54. doi: 10.1211/jpp.57.12.0004. [DOI] [PubMed] [Google Scholar]
- 19.Friberg LE, de Greef R, Kerbusch T, Karlsson MO. Modeling and simulation of the time course of asenapine exposure response and dropout patterns in acute schizophrenia. Clin Pharmacol Ther. 2009;86:84–91. doi: 10.1038/clpt.2009.44. [DOI] [PubMed] [Google Scholar]