Abstract
The reproducibility of electromyographic (EMG) activity in relation to static bite-force from masticatory muscles for a given biting situation is largely unknown. Our aim was to evaluate the reliability of EMG activity in relation to static bite-force in humans. Eighty-four subjects produced 5 unilateral static bites of different forces at different biting positions on molars and incisors, at two separate sessions, while surface EMG activities were recorded from temporalis, masseter, and suprahyoid muscles bilaterally. Intraclass Correlation Coefficients (ICCs) were used, where an ICC of ≥ 0.60 indicated good reliability of these slopes. ICCs for jaw closing muscles during molar biting were: temporalis ipsilateral 0.58 to 0.93 and contralateral 0.88 to 0.91, masseter ipsilateral 0.75 to 0.86 and contralateral 0.69 to 0.88; while during incisor biting were: temporalis ipsilateral 0.56 to 0.81 and contralateral 0.34 to 0.86, masseter ipsilateral 0.65 to 0.78 and contralateral 0.59 to 0.80. For the suprahyoid muscles the confidence intervals were mostly wide and most included zero. Slopes of the EMG activity versus bite-force for a given biting situation were reliable for temporalis and masseter muscles. These results support the use of these outcome measurements for the estimation and validation of mechanical models of the masticatory system.
Keywords: reliability, masticatory muscles, human, EMG
A linear relationship between electromyographic (EMG) activity and bite-force has been reported by several investigators (1–9). However, data on the reliability of this relationship are limited due to methodological flaws such as small sample sizes, lack of confidence intervals, indeterminant directions of bite-force, and improper data analysis (10, 11). Nevertheless, it has been suggested that by controlling bite-force position and direction, reproducibility of the slope of an EMG-force curve can be achieved (6). The linearity of EMG activity versus bite-force has been evaluated in asymptomatic and symptomatic individuals (1, 13) and the observed slope depends on the biting location and direction (6).
Jaw biomechanics are difficult to study directly (13) so mathematical models have been used (14, 15). More specifically, the slopes of the relationship between EMG and bite-force have been used to prescribe muscle forces used in mathematical modeling approaches to study the human jaw (16–18). The accuracy of these modeling approaches, however, depends on the reliability of the EMG activity versus bite-force relationship of the masticatory muscles. Establishing and monitoring data collection methods that are valid and reliable prevents and controls for biases that may under or over estimate the actual phenomena under investigation. Further to this, we have used a different approach where numerical models have been used to predict subject-specific TMJ loads and muscle activation patterns in healthy individuals and subjects with temporomandibular disorders. The numerical models were based on objective functions such as minimization of joint loads and/or muscle effort, and were validated by comparison of predicted and measured muscle activities for prescribe bite-force position and direction (19).
Although the reproducibility of bite force and EMG as two separate parameters has been assessed (20), the contribution of this paper is to investigate the reproducibility of the relation of bite force to EMG as the fundamental data that can be used in the mathematical modeling of jaw mechanics. An additional contribution of this paper is to provide a firm foundation for ongoing and productive research on mandibular mechanics (19, 21–23). Therefore, the aim of this study was to test the reliability of the slope of the EMG activity versus bite-force relationships for both ipsilateral and contralateral masseter, temporalis, and suprahyoid muscles at different biting positions on molars and incisors.
Materials and Methods
Eighty-four medically healthy adults, 41 females and 43 males, of mean age 31 ± 11 yr voluntarily agreed to participate in this study. Subjects were excluded if their molars or incisors were missing or had large restorations. Based on the Angle classification 61% of the participants were Class I, 22% class II and 17% class III. Additionally, 3.7% presented with either anterior or posterior cross-bite or both. The study was approved by the appropriate Institutional Review Boards, and each subject gave informed consent.
Equipment
Electrical muscle activities were measured with bipolar surface electrodes on masseter, temporalis, and suprahyoid group muscles during unilateral static biting tasks on first molars and incisors using techniques and equipment that have been previously described (24).
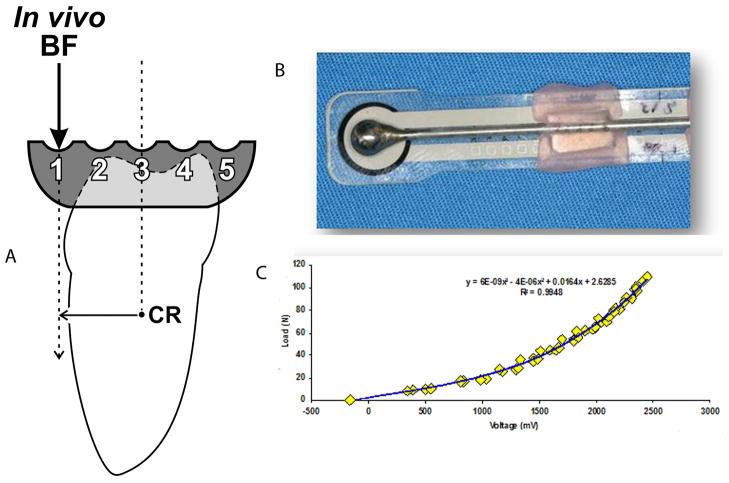
Thin acrylic copings were used to control the location of the bite-forces during these in vivo tasks. These copings were custom-made for the maxillary and mandibular right and left first molars and central incisors and affixed using temporary dental cement (Transbond, 3M Unitek, St. Paul, MN, USA). The maxillary copings had smooth flat biting surfaces parallel to the occlusal plane, while the mandibular copings had a series of milled and polished spherical indentations, 5 mm from center-to-center of each indentation, to receive a sterilized stainless steel sphere of 5 mm diameter (Fig. 1A, B). Five indentations were arranged in a vestibulo-lingual linear array over the biting surface of each mandibular coping and numbered 1 through 5, from vestibular to lingual. The metal sphere was soldered to a thin metal wire in order to handle the sphere and prevent aspiration (Fig. 1B).
Figure 1.
A. Mesial view of a right mandibular molar and custom coping (modified from Iwasaki et al. (30)). The extreme vestibular indentation is labeled #1, whereas the extreme lingual indentation is labeled #5. Bite-force (BF) is indicated by the vertical arrow. Position #3 was located over the estimated center of resistance (CR) of the tooth. Depending on the position of the bite-force, the mechanical moments generated about the CR varied in sign and magnitude.
B. Bite-force transducer from mandibular prespective. Magnitudes of the bite-forces were measured using preconditioned and calibrated sensor film (Tekscan Flexiforce; see Materials and Methods). A standardized sphere with a flattened side of approximately 4 mm diameter was centered on the loading area of the sensor film and the film was attached to the wire handle of the sphere using light-cured acrylic.
C. Calibration curve for a bite-force transducer after pre-conditioning, where known loads were applied to the sphere on the film ex vivo while simultaneously recording voltage output (mV). The relationship between loading force and voltage output was non-linear so a third-order polynomial regression was calculated for each bite-force transducer. Accuracy of the preconditioned transducer was +/− 1.5 N
Magnitudes of the bite-forces were measured using preconditioned and calibrated sensor film (Tekscan Flexiforce, Tekscan, South Boston, MA, USA). As previously reported (6, 19), a standardized sphere with a flattened side of approximately 4 mm diameter was centered on the loading area of the sensor film and the film was attached to the wire handle of the sphere using light-cured acrylic. The film was pre-conditioned and calibrated ex vivo by applying known loads to the sphere on the film while simultaneously recording voltage output (V; Fig. 1C). To accommodate the transducer and acrylic coping, subjects had to produce approximately 8 mm of opening between the first molars. The relationship between loading force and voltage output was non-linear so a third-order polynomial regression was calculated for each bite-force transducer. Accuracy of the preconditioned transducer was +/− 1.5 N. The transducer was wrapped in disposable plastic film to reduce exposure to moisture. The continuous electrical output of the transducer was monitored using an oscilloscope, thus providing real-time information of biting force.
Self-adhesive silver/silver chloride surface electrodes with a sensor area of 25 mm2 were positioned bilaterally on the anterior temporalis, superficial masseter, and suprahyoid muscles. The locations of electrodes over masseter and temporalis muscles were determined by palpation during maximum voluntary muscle activation. Electrodes over the suprahyoid muscles were positioned approximately 2 cm dorsal and 1 cm lateral of the midline of the mandible. The skin over the muscles and one ear lobe was prepared by scrubbing the surface with alcohol-soaked gauze pad. Paired surface electrodes each containing a small amount of conducting paste (Neurology 720 00-S, Ambu, Sphereerup, Denmark) were aligned, 23 mm apart (center-to-center) along the main direction of the muscle fibers and attached to the skin over each muscle using self-adhering pads. A single ground electrode containing conducting paste was attached to the ear lobe of the subject. Signal-to-noise ratios over 10:1 for the range of muscle activations produced during comfortable biting at light force intensities were verified. If signal-to-noise ratios were below the threshold, the skin at the site was prepared again and new electrodes were applied. The signal from each muscle was amplified (10 P511 AC Grass Preamplifiers, Astro-Med, West Warwick, RI, USA), sampled at 2000 samples/s/channel, and viewed and stored using customized software (TestPoint, Measurement Computing, Norton, MA, USA). High and low pass filters were set at 0.03 and 3.0 kHz respectively
Protocol
Subjects were first trained to produce non-strenuous unilateral static bites over a range of magnitudes on the metal sphere positioned between copings on the maxillary and mandibular teeth. A series of 5 bites at light but different force intensities were made at each of the 5 indentations. The order of positioning was indentation #3, 2, 4, 1, and 5. Each bite was about 5 seconds duration, with rest periods of 5–20 s between bites. Molar biting tasks were followed by incisor biting tasks. At the first session the order of biting was right then left quadrant, while at the second session this order was reversed.
During the biting tasks, an investigator positioned the metal sphere on the corresponding indentation. Another investigator verbally instructed the subject when to start and stop biting as well as if the bite should be “higher” or ‘lower”. The investigator observed the oscilloscope in order to assure that a range of bite force magnitudes was obtained. The subjects did not have visual or other auditory feedback to aid in the control of jaw or sphere position or force magnitude during the biting task in order to avoid cognitive control of muscle activity (5, 25, 26).
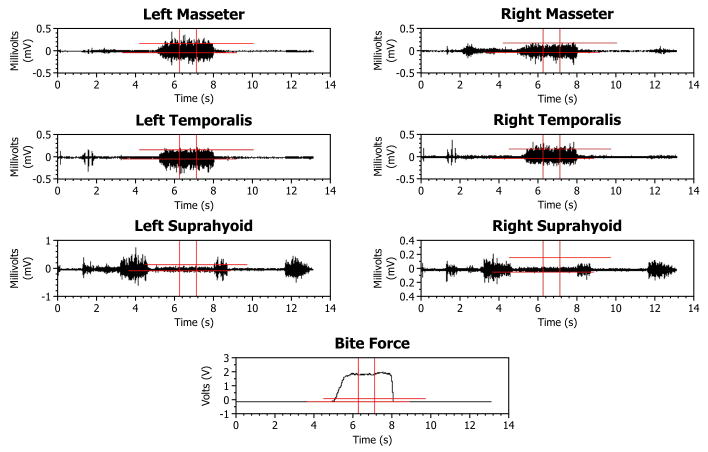
Subjects were able to bite comfortably with the sphere set in an indentation without significant eccentric posturing of the mandible. Subjects were monitored by an investigator to ensure that the mandible was within ±2 mm of a centered posture, and loaded the curved surface of the sphere while maintaining static equilibrium. Electrical output (V) from the film was simultaneously recorded digitally during the biting tasks (Fig. 2, bottom). Later, these data and the force-resistance polynomial were used to calculate magnitudes of the bite-forces.
Figure 2.
Typical raw data are shown, before, during, and after a single static bite-force. The top six traces show EMG activity from each of the six muscles (mV), and the bottom trace shows bite-force (V). The units of the horizontal scale are seconds (s). A segment of data over a period of 0.8 s was selected (see vertical markers) where the bite-force was the steadiest, and that same segment was used in all channels to compute the root mean square (RMS) amplitudes for the EMG channels and the average force for the bite-force channel.
Statistical Analysis
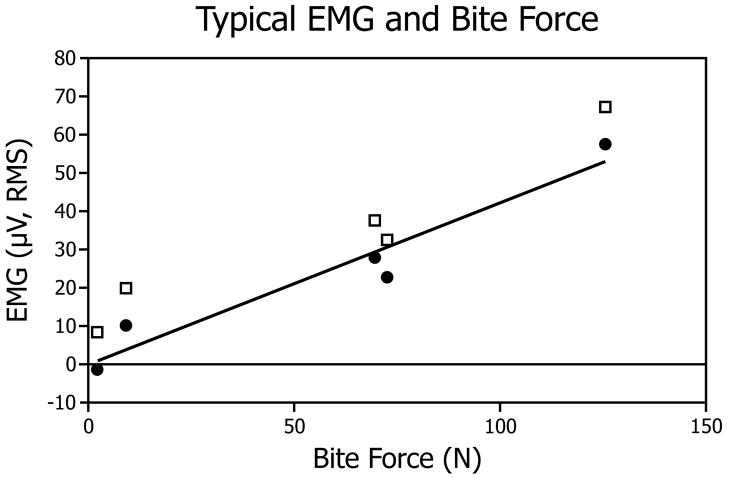
The dependent variable in this study was the slope of the EMG activity versus bite-force. This slope was obtained as follows. Firstly, EMG data were replayed and analyzed using custom-written computer programs and commercial software (TestPoint, Measurement Computing). EMG activities during a biting task (Fig. 2) over a 0.5 to 1 s period were selected. A criterion for selection was a section where the bite-force was the steadiest. Secondly, data were sampled at 2000 samples/second/channel and expressed as root-mean-square (RMS, mV) values. Signal analysis showed less than a 3% decrease of RMS magnitude when frequency of sampling was decreased from 6000 to 600 samples/s. Thirdly, these RMS EMG data were plotted versus the average magnitude of the bite-force (N) over the same sampling period for each muscle and each biting task for each subject (Fig. 3). Finally, the slope (constant of proportionality) of RMS EMG versus bite-force regression for each indentation was calculated and normalized by dividing by peak slope (RMS/N) for the given tooth (molar, incisor) in each subject.
Figure 3.
Typical data leading to slope calculations are shown. The horizontal axis gives the force (N) of the five bites and the vertical axis gives the corresponding RMS EMG amplitude in microvolts. Raw EMG values (open squares) were “zeroed” so that the regression line passed through the origin (circles). The slope (constant of proportionality) was computed using a least-squares (linear) regression and plotted as a solid line. For each tooth, a regression was developed for each of the 5 indentations in the custom coping. Normalization of the data was accomplished by dividing each regression slope by the peak slope (RMS/N) for the given tooth (molar, incisor).
Data from each participant were obtained in two experimental sessions. Sessions were performed at least 1 day apart. The normalized slopes for EMG activity versus bite-force relationships from the two sessions were compared to determine the reliability. Reliability was expressed as Intraclass Correlation Coefficients (ICCs) (27, 28, 29) based on absolute agreement measures of Session 1 and Session 2 normalized slopes. Analysis by Intraclass Correlation is a prominent application used in the assessment of consistency or repeatability of quantitative measures. Incorporation of intra- and inter-assessor variability is a strength of this analysis. An ICC of ≥ 0.60, with a confidence interval that does not include zero, and a significant F-test with alpha level of 0.05, are considered to reflect an acceptable level of reliability (29).
Results
The largest bite forces used in this study for a sub-sample of 14 subjects was evaluated to confirm that these forces did not approach maximal physiological effort. The mean of the maximum force for visit 1 and visit 2 at each indentation was calculated. Mean maximum bite-force during incisor biting was 27.15 ± 15.88 N and during molar biting was 62.23 ± 43.13 N.
Temporalis muscles
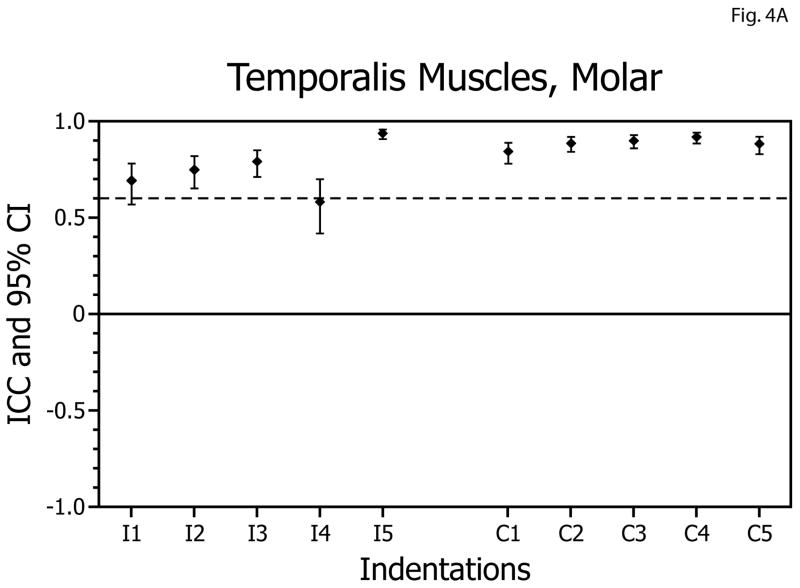
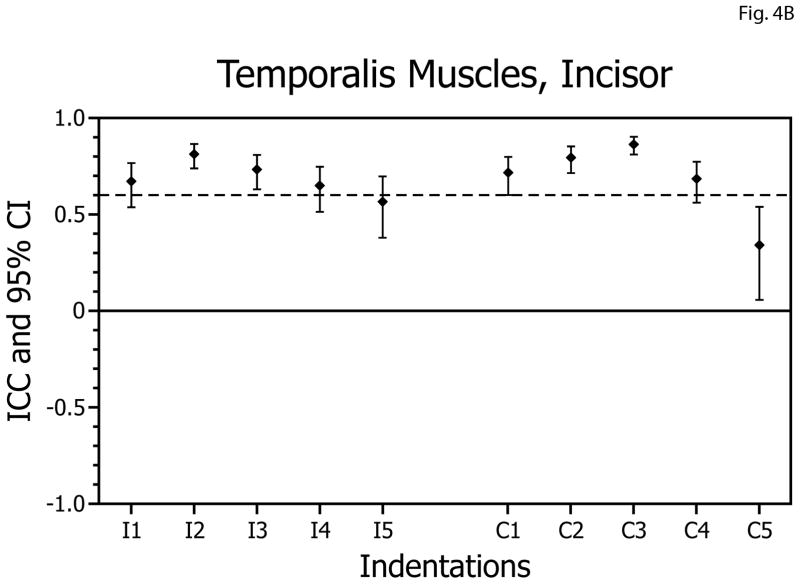
For molar biting tasks, overall, the ICCs obtained for the temporalis muscles ranged from 0.58 to 0.91 (Table 1, Fig. 4A). Thus, reliabilities of the EMG versus bite-force slopes for the temporalis muscles during biting on the molars were above the acceptable level bilaterally for 8 of 10 biting positions. All ICC values were statistically significantly different from zero (p<0.005) and none of the confidence intervals included zero. For incisor biting tasks, the ICCs ranged from 0.34 to 0.86 (Table 1, Fig. 4B, and were above the acceptable level bilaterally for 5 of 10 biting positions. All ICC values were statistically significantly different from zero (p<0.005) and none of the confidence intervals included zero.
Table 1.
Overview of upper and lower confidence intervals of Intraclass Correlation Coefficients (ICCs) for EMG activities recorded from muscles during biting on molar and incisor teeth. Ipsilateral or Contralateral indicates the position of the muscle relative to the side of biting.
| Tooth | Muscle | Position | ICC 95% Confidence Interval | See Figure | |
|---|---|---|---|---|---|
| Lower | Upper | ||||
| Molar | Temporalis | Ipsilateral | 0.58 | 0.93 | 4A |
| Molar | Temporalis | Contralateral | 0.88 | 0.91 | |
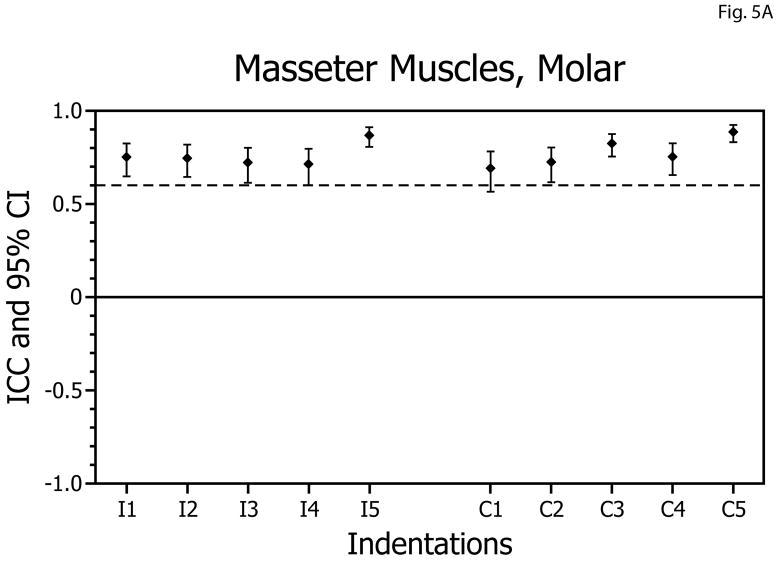
| Molar | Masseter | Ipsilateral | 0.75 | 0.86 | 5A |
| Molar | Masseter | Contralateral | 0.69 | 0.88 | |
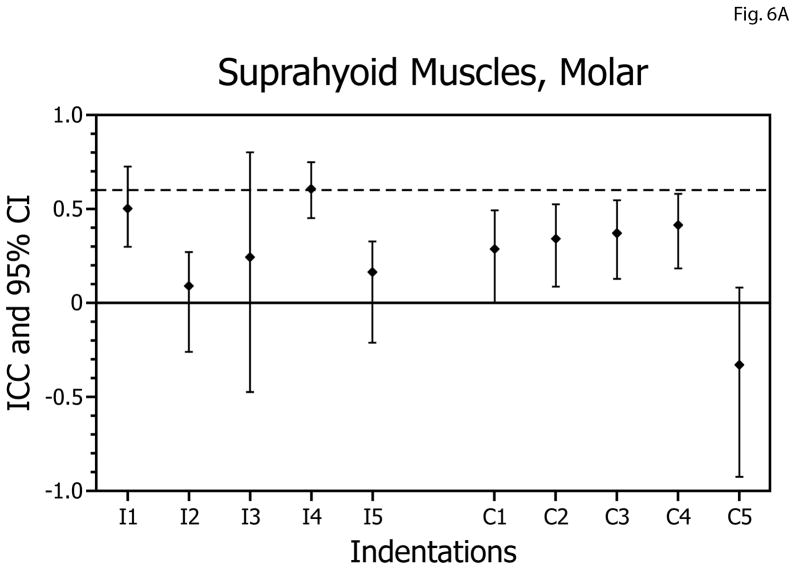
| Molar | Suprahyoid | Ipsilateral | 0.09 | 0.49 | 6A |
| Molar | Suprahyoid | Contralateral | −0.33 | 0.41 | |
| Incisor | Temporalis | Ipsilateral | 0.56 | 0.81 | 4B |
| Incisor | Temporalis | Contralateral | 0.34 | 0.86 | |
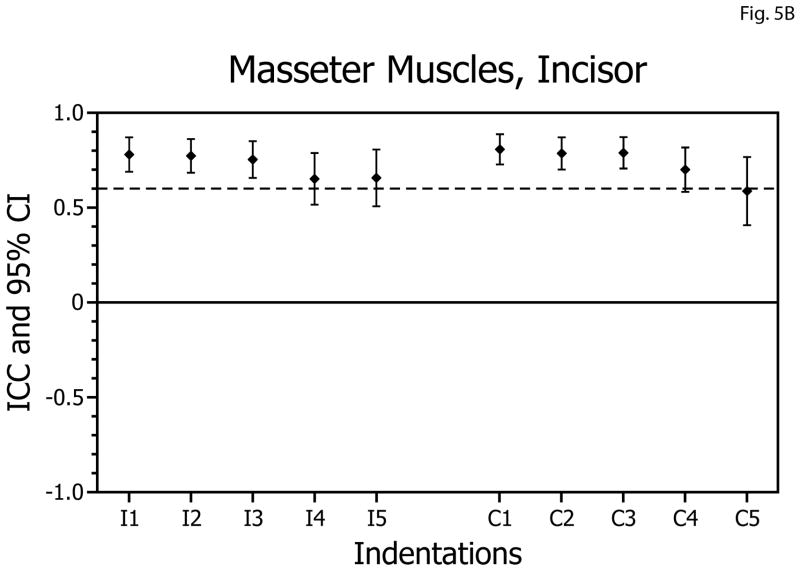
| Incisor | Masseter | Ipsilateral | 0.65 | 0.78 | 5B |
| Incisor | Masseter | Contralateral | 0.59 | 0.80 | |
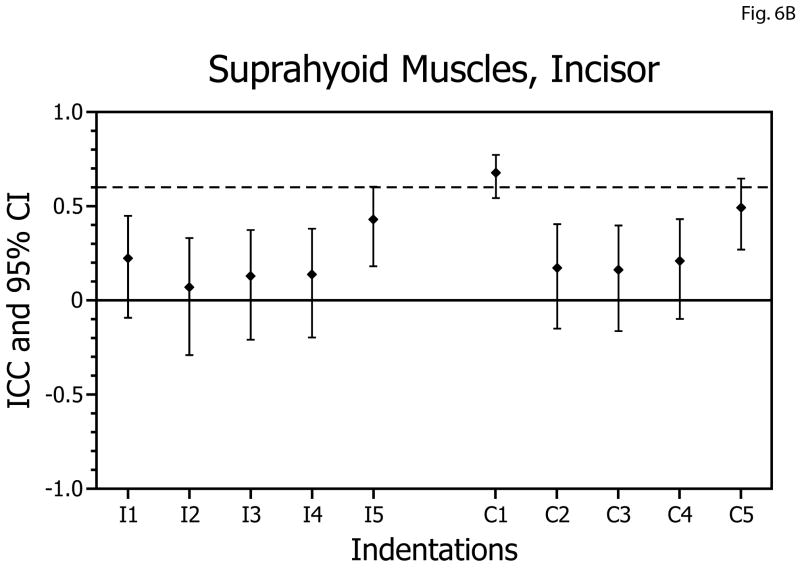
| Incisor | Suprahyoid | Ipsilateral | 0.07 | 0.42 | 6B |
| Incisor | Suprahyoid | Contralateral | 0.16 | 0.67 | |
Figure 4.
Intra-class correlation coefficients (ICCs) and confidence intervals (vertical bars) for test-retest of temporalis muscle activity versus bite-force slopes during molar biting (A) and incisor biting (B). ICCs are plotted on the vertical axis; ipsilateral (I; left-side) and contralateral (C; right-side) muscle data are plotted on the horizontal axis with results for indentations 1 to 5 presented in left-to-right sequence.
Masseter muscles
For molar biting tasks, the ICCs obtained for the masseter muscles ranged from 0.69 to 0.88 (Table 1, Fig. 5A) and were above the acceptable level bilaterally for 10 of 10 biting positions. All ICC values were statistically significantly different from zero (p<0.005) and none of the confidence intervals included zero. During incisor biting tasks ICCs ranged from 0.59 to 0.80 (Table 1, Fig. 5B), with reliability above the acceptable level bilaterally for 7 of 10 biting positions. All ICC values were statistically significantly different from zero (p<0.005) and none of the confidence intervals included zero.
Figure 5.
Intra-class correlation coefficients (ICCs) and confidence intervals (vertical bars) for test-retest of masseter muscle activity versus bite-force slopes during molar biting (A) and incisor biting (B). ICCs are plotted on the vertical axis; ipsilateral (I; left-side) and contralateral (C; right-side) muscle data are plotted on the horizontal axis with results for indentations 1 to 5 presented in left-to-right sequence.
Suprahyoid muscles
In contrast to the temporalis and masseter muscles, reliabilities of the EMG versus bite-force slopes for the suprahyoid muscles during biting on the molars and incisors were always below the acceptable level, and 11 of 20 of the confidence intervals included zero (Table 1, Figs. 6A,B).
Figure 6.
Intra-class correlation coefficients (ICCs) and confidence intervals (vertical bars) for test-retest of suprahyoid muscle activity: bite-force slopes during molar biting (A) and incisor biting (B). ICCs are plotted on the vertical axis; ipsilateral (I; left-side) and contralateral (C; right-side) muscle data are plotted on the horizontal axis with results for indentations 1 to 5 presented in left-to-right sequence.
Discussion
The main finding of this research was that the test-retest reliabilities of the slopes describing these relationships for the masseter and temporalis muscles were generally above acceptable levels, and more reliable for molar biting than incisor biting tasks. For the suprahyoid muscles the results were more variable for both molar and incisor biting and often failed to achieve the criteria for reliability.
In those instances, where reliability failed to meet our criteria, several factors may have influenced such results. Among these factors, subjects self-reported at the conclusion of the experiments that biting at positions 1 and 5 commonly felt unusual, especially while biting on the incisors. Different sets of acrylic copings were used for each experimental session because they were often broken during removal. Also, it is possible that the greater repeatability of data seen for molar biting may reflect the greater likelihood of producing nearly the same geometrical relationships between the indentations in each of the mandibular copings and the center of resistance of the teeth for the molars compared to the incisors. There was more challenge for the fabrication of incisor copings due to the variable buccal-lingual inclination of the incisors. Therefore, the position of the center of resistance of the teeth relative to the incisal edges was more difficult to estimate. In addition, subjects may have used more variable positioning of the mandible (especially antero-posteriorly) during the incisor biting tasks compared to the molar biting tasks. In spite of these issues the test-retest results for the masseter and temporalis muscles were excellent for biting on molars and ranged from acceptable to excellent for biting on incisors. Future use of a template to control the position of the electrodes may further improve the reliability of the data.
The less reliable data obtained from the suprahyoid muscles may reflect the relatively small slopes for the EMG activity versus bite-force relationships for these muscles during static biting and the higher potential for contamination of the EMG signal with output from other infra-mandibular muscles.
Our results provide support for use of such position-specific in vivo EMG versus bite-force information to characterize masticatory muscle behavior for clinical tools, such as modeling approaches, in the study of the human jaw system. These results extend the linearity reports (1–9) by showing that such data can be reliably reproduced from day to day. However, it should be emphasized that the same biting conditions (position and direction of force) are requisite for this linearity (6–8) and reproducibility. Given well-characterized conditions and subject specificity of the EMG activity versus bite-force relationship, results such as those herein provide a foundation for using slopes in mathematical models of jaw mechanics (23, 24, 30)
In conclusion, the results of the current study demonstrated that the EMG activity versus bite-force relationships were reliable for temporalis and masseter muscles during biting on molars and incisors. Therefore, these results support the use of these outcome measurements for the masseter and temporalis muscle, as well as measures of TMJ eminence morphology (30), for the estimation and validation of mechanical models of the masticatory system.
Acknowledgments
The authors sincerely thank the subjects who volunteered to participate in this study. This investigation was supported in part by a grant (7R01DE016417) from the National Institute of Dental and Craniofacial Research, National Institutes of Health, Bethesda, MD 20892.
References
- 1.Bakke M, Michler L, Han K, Moller E. Clinical significance of isometric bite force versus electrical activity in temporal and masseter muscles. Scand J Dent Res. 1989;97:539–551. doi: 10.1111/j.1600-0722.1989.tb00929.x. [DOI] [PubMed] [Google Scholar]
- 2.Blanksma NG, Van Eijden TM. Electromyographic heterogeneity in the human temporalis muscle. J Dent Res. 1990;69:1686–1690. doi: 10.1177/00220345900690101101. [DOI] [PubMed] [Google Scholar]
- 3.Blanksma NG, Van Eijden TM, Weijs WA. Electromyographic heterogeneity in the human masseter muscle. J Dent Res. 1992;71:47–52. doi: 10.1177/00220345920710010801. [DOI] [PubMed] [Google Scholar]
- 4.Koolstra JH, van Eijden TM. Combined finite-element and rigid-body analysis of human jaw joint dynamics. J Biomech. 2005;38:2431–2439. doi: 10.1016/j.jbiomech.2004.10.014. [DOI] [PubMed] [Google Scholar]
- 5.Lobbezoo F, van der Glas HW, van Kampen FM, Bosman F. The effect of an occlusal stabilization splint and the mode of visual feedback on the activity balance between jaw-elevator muscles during isometric contraction. J Dent Res. 1993;72:876–882. doi: 10.1177/00220345930720050801. [DOI] [PubMed] [Google Scholar]
- 6.Uchida S, Iwasaki LR, Marx DB, Yotsui Y, Inoue H, Nickel JC. Variations in activities of human jaw muscles depend on tooth-tipping moments. Arch Oral Biol. 2008;53:199–205. doi: 10.1016/j.archoralbio.2007.10.002. [DOI] [PubMed] [Google Scholar]
- 7.Uchida S, Whittle T, Wanigaratne K, Murray GM. The role of the inferior head of the human lateral pterygoid muscle in the generation and control of horizontal mandibular force. Arch Oral Biol. 2001;46:1127–1140. doi: 10.1016/s0003-9969(01)00077-2. [DOI] [PubMed] [Google Scholar]
- 8.Uchida S, Whittle T, Wanigaratne K, Murray GM. Activity in the inferior head of the human lateral pterygoid muscle with different directions of isometric force. Arch Oral Biol. 2002;47:771–778. doi: 10.1016/s0003-9969(02)00116-4. [DOI] [PubMed] [Google Scholar]
- 9.Van Eijden TM, Brugman P, Weijs WA, Oosting J. Coactivation of jaw muscles: recruitment order and level as a function of bite force direction and magnitude. J Biomech. 1990;23:475–485. doi: 10.1016/0021-9290(90)90303-k. [DOI] [PubMed] [Google Scholar]
- 10.Lindauer SJ, Gay T, Rendell J. Electromyographic-force characteristics in the assessment of oral function. J Dent Res. 1991;70:1417–1421. doi: 10.1177/00220345910700110401. [DOI] [PubMed] [Google Scholar]
- 11.Mao J, Osborn JW. Direction of a bite force determines the pattern of activity in jaw-closing muscles. J Dent Res. 1994;73:1112–1120. doi: 10.1177/00220345940730051401. [DOI] [PubMed] [Google Scholar]
- 12.Ferrario VF, Sforza C, Zanotti G, Tartaglia GM. Maximal bite forces in healthy young adults as predicted by surface electromyography. J Dent. 2004;32:451–457. doi: 10.1016/j.jdent.2004.02.009. [DOI] [PubMed] [Google Scholar]
- 13.Koolstra JH. Dynamics of the human masticatory system. Crit Rev Oral Biol Med. 2002;13:366–376. doi: 10.1177/154411130201300406. [DOI] [PubMed] [Google Scholar]
- 14.Daumas B, Xu W, Bronlund J. Jaw mechanics modeling and simulation. Mech Mach Theory. 2005;40:821–833. [Google Scholar]
- 15.Rohrle O, Pullan AJ. Three-dimensional finite element modelling of muscle forces during mastication. J Biomech. 2007;40:3363–3372. doi: 10.1016/j.jbiomech.2007.05.011. [DOI] [PubMed] [Google Scholar]
- 16.Koolstra JH, van Eijden TM. Application and validation of a three- dimensional mathematical model of the human masticatory system in vivo. J Biomech. 1992;25:175–187. doi: 10.1016/0021-9290(92)90274-5. [DOI] [PubMed] [Google Scholar]
- 17.Koolstra JH, van Eijden TM, Weijs WA, Naeije M. A three-dimensional mathematical model of the human masticatory system predicting maximum possible bite forces. J Biomech. 1988;21:563–576. doi: 10.1016/0021-9290(88)90219-9. [DOI] [PubMed] [Google Scholar]
- 18.Van Eijden TM, Klok EM, Weijs WA, Koolstra JH. Mechanical capabilities of the human jaw muscles studied with a mathematical model. Arch Oral Biol. 1988;33:819–826. doi: 10.1016/0003-9969(88)90106-9. [DOI] [PubMed] [Google Scholar]
- 19.Iwasaki LR, Crosby MJ, Gonzalez Y, McCall WD, Marx DB, Ohrbach R, Nickel JC. Temporomandibular joint loads in subjects with and without disc displacement. Orthop Rev (Pavia) 2009;1:90–93. doi: 10.4081/or.2009.e29. [DOI] [PMC free article] [PubMed] [Google Scholar]
- 20.Castroflorio T, Icardi K, Becchino B, Merlo E, Debernardi C, Bracco P, Farina D. Reproducibility of surface EMG variables in isometric sub-maximal contractions of jaw elevator muscles. J Electromyogr Kinesiol. 2006;16:498–505. doi: 10.1016/j.jelekin.2005.08.007. [DOI] [PubMed] [Google Scholar]
- 21.Nickel JC, Yao P, Spalding PM, Iwasaki LR. Validated numerical modeling of the effects of combined orthodontic and orthognathic surgical treatment on TMJ loads and muscle forces. Am J Orthod Dentofacial Orthop. 2002;121:73–83. doi: 10.1067/mod.2002.120138. [DOI] [PubMed] [Google Scholar]
- 22.Smith DM, McLachlan KR, McCall WD., Jr A numerical model of temporomandibular joint loading. J Dent Res. 1986;65:1046–1052. doi: 10.1177/00220345860650080201. [DOI] [PubMed] [Google Scholar]
- 23.Trainor PG, McLachlan KR, McCall WD. Modelling of forces in the human masticatory system with optimization of the angulations of the joint loads. J Biomech. 1995;28:829–843. doi: 10.1016/0021-9290(94)00128-q. [DOI] [PubMed] [Google Scholar]
- 24.Nickel JC, Iwasaki LR, Walker RD, McLachlan KR, McCall WD., Jr Human masticatory muscle forces during static biting. J Dent Res. 2003;82:212–217. doi: 10.1177/154405910308200312. [DOI] [PubMed] [Google Scholar]
- 25.Blanksma NG, van Eijden TM, van Ruijven LJ, Weijs WA. Electromyographic heterogeneity in the human temporalis and masseter muscles during dynamic tasks guided by visual feedback. J Dent Res. 1997;76:542–551. doi: 10.1177/00220345970760010401. [DOI] [PubMed] [Google Scholar]
- 26.Van Eijden TM, Blanksma NG, Brugman P. Amplitude and timing of EMG activity in the human masseter muscle during selected motor tasks. J Dent Res. 1993;72:599–606. doi: 10.1177/00220345930720030801. [DOI] [PubMed] [Google Scholar]; Bartko JJ, Carpenter WT., Jr On the methods and theory of reliability. J Nerv Ment Dis. 1976;163:307–317. doi: 10.1097/00005053-197611000-00003. [DOI] [PubMed] [Google Scholar]
- 27.Bartko JJ, Carpenter WT., Jr On the methods and theory of reliability. J Nerv Ment Dis. 1976;163:307–317. doi: 10.1097/00005053-197611000-00003. [DOI] [PubMed] [Google Scholar]
- 28.Shrout PE, Fleiss JL. Intraclass correlations: uses in assessing rater reliability. Psychol Bull. 1979;86:420–428. doi: 10.1037//0033-2909.86.2.420. [DOI] [PubMed] [Google Scholar]
- 29.Winer BJ. Statistical principles in experimental design. 2. New York: McGraw-Hill; 1971. pp. 283–289. [Google Scholar]
- 30.Iwasaki LR, Petsche PE, McCall WD, Jr, Marx DB, Nickel JC. Neuromuscular objectives of the human masticatory apparatus during static biting. Arch Oral Biol. 2003;48:767–777. doi: 10.1016/s0003-9969(03)00171-7. [DOI] [PubMed] [Google Scholar]


