

Abstract
The complex structure of soil and the heterogeneity of resources available to microorganisms have implications for sampling regimens when the structure and diversity of microbial communities are analyzed. To assess the heterogeneity in community structure, archaeal communities, which typically contain sequences belonging to the nonthermophilic Crenarchaeota, were examined at two contrasting spatial scales by using PCR-denaturing gradient gel electrophoresis (DGGE) analysis followed by unweighted pair group method with arithmetic mean analysis of 16S rRNA- and ribosomal DNA-derived profiles. A macroscale analysis was carried out with soil cores taken at 2-m intervals along triplicate 8-m transects from both managed (improved) and natural (unimproved) grassland rhizosphere soils. A microscale analysis was carried out with a single soil core by assessing the effects of both sample size (10, 1, and 0.1 g) and distance between samples. The much reduced complexity of archaeal profiles compared to the complexity typical of the bacterial community facilitated visual comparison of profiles based on band presence and revealed different levels of heterogeneity between sets of samples. At the macroscale level, heterogeneity over the transect could not be related to grassland type. Substantial heterogeneity was observed across both improved and unimproved transects, except for one improved transect that exhibited substantial homogeneity, so that profiles for a single core were largely representative of the entire transect. At the smaller scale, the heterogeneity of the archaeal community structure varied with sample size within a single 8- by 8-cm core. The archaeal DGGE profiles for replicate 10-g soil samples were similar, while those for 1-g samples and 0.1-g samples showed greater heterogeneity. In addition, there was no relationship between the archaeal profiles and the distance between 1- or 0.1-g samples, although relationships between community structure and distance of separation may occur at a smaller scale. Our findings demonstrate the care required when workers attempt to obtain a representative picture of microbial community structure in the soil environment.
Soil is characterized by considerable spatial heterogeneities in physical and chemical properties, which, in part, are believed to both result from and be responsible for biological heterogeneity. Microhabitats and microenvironments resulting from heterogeneity are familiar concepts in microbial ecology, and communities and their activities are determined by local environmental conditions at the submillimeter scale. Spatial heterogeneity and the existence of microenvironments are likely to influence the diversity of microbial populations by providing conditions favorable for a wider range of functional groups (25). In practical terms, this has implications for sampling regimens (10). For example, molecular analysis is frequently carried out by using 1- to 10-g samples with little knowledge of the extent to which such samples are representative of the bulk soil. Similarly, little is known about the effects of homogenization of soil when differences in molecular diversity between treatments are assessed or about the extent to which this approach leads to loss of important information.
Macroscale analysis of populations of Bacteria indicates that there is homogeneous distribution of abundant cells (5, 6). For example, similar temperature gradient gel electrophoresis patterns for 16S rRNA- and rDNA-derived PCR products were obtained from 1-g soil samples taken over several hundred square meters (5). Analysis of smaller, discrete taxonomic or functional groups, however, increases the level of resolution and highlights differences between samples not observed when the numerically dominant and stable members of the bacterial community are examined (11).
Microscale analysis indicates heterogeneity within communities. Watts (30) found that there was variation in bacterial community structure between different soil aggregate size classes ranging from ≥250 to <1 μm; the numbers of actinomycetes were greatest in larger aggregates, and pseudomonads were most abundant in smaller aggregates. Sessitsch et al. (23) found that different mineral particle size fractions (sand, silt, and clay) were associated with distinct microbial community structures and that particle size was a more important factor than fertilizer application or the presence of heavy metals in determining microbial community structure. Webster et al. (31) demonstrated that there was reduced heterogeneity of ammonia oxidizers in managed soil compared to the heterogeneity in unimproved soil when they analyzed 0.5-g soil samples, which was not evident when larger samples were analyzed. Grundmann and Debouzie (9) found that there was nonrandom distribution of ammonia and nitrite oxidizers at 1-mm intervals along 10-cm transects, indicating that there was an association between these organisms at the millimeter scale. Investigations have also been carried out to examine the spatial distribution of bacterial populations around plant roots, which can select for a microbial community different from the community in bulk soil (4, 13, 14). In addition, the passage of root tips through the soil results in a moving nutrient source, which generates oscillations in the growth of different microbial groups (24, 27).
Recent molecular studies (1, 2, 12, 26) have demonstrated the ubiquity of Archaea in soil, particularly organisms belonging to the group 1 or nonthermophilic Crenarchaeota lineage, which forms a deeply branching group with no close affiliation with any cultivated member of the Archaea. Estimates indicate that these organisms constitute approximately 1% of the total soil population (2, 22). We demonstrated previously (17) that related archaeal 16S rRNA gene sequences were present in both managed (improved) and natural (unimproved) Scottish upland pasture soils. Sequence analysis of clone libraries indicated that the archaeal community was dominated by two distinct lineages of nonthermophilic Crenarchaeota, and denaturing gradient gel electrophoresis (DGGE) analysis revealed a reproducible shift in community structure associated with grassland management.
Examination of Archaea in soil has also revealed spatial differences in community structure. Pesaro and Widmer (19) observed depth-associated shifts in archaeal community structure in a forest soil profile down to a depth of 1 m, and variability in archaeal methanogenic activity has been observed to be a function of organic matter content (29) and aggregate size in rice field soil (20).
Previous studies have shown that crenarchaeal communities are ubiquitous in grassland soils, where their ecological function is unknown. These communities represent a small but significant component of the total prokaryotic community, but the organisms are present at levels that are readily detectable by molecular methods. DGGE analysis of amplified crenarchaeal 16S rRNA genes distinguishes clearly a number of different sequence types whose distributions vary in soils subjected to different management treatments. The aim of this study was, therefore, to determine scale-associated differences in archaeal communities in managed and unimproved grassland soils. This was achieved by analysis of samples taken from points along 8-m transects and by analysis of samples and subsamples from an individual soil core. Archaeal communities were characterized by DGGE analysis of PCR and reverse transcription (RT)-PCR products targeting 16S rDNA and rRNA, respectively. DGGE banding patterns were compared visually and by constructing dendrograms by using unweighted pair group method with arithmetic mean (UPGMA) analysis of similarity matrices.
MATERIALS AND METHODS
Sampling of soil cores along a transect.
Soil samples were collected from unimproved (U4a) and improved (MG6) (National Vegetation Classification [21]) grassland pasture plots at Fasset Hill, Sourhope Research Station, Borders Region, Scotland (map reference NT 850 205; 55°28′30"N, 2°14′W); details concerning the plots have been described previously (15). Briefly, the unimproved plots were representative of natural grassland and were dominated by Festuca ovina, Agrostis capillaris, and Galium saxatile, were grazed by sheep during summer months, and received no fertilizer. The soil pH is typically less than 5.0. The improved plots represented natural grassland which had been reseeded and fertilized. The vegetation was dominated by Lolium perenne, Cynosurus cristatus, and Trifolium repens, and the plots were grazed by sheep during spring, summer, and autumn months and were fertilized with 50 kg of N ha−1 in March and August and with N-P-K (40:20:20) in May. The soil pH is typically greater than 5.0. Individual soil cores (diameter, 8 cm) were collected at 2-m intervals along an 8-m transect from triplicate improved (MG6) and unimproved (U4a) grassland plots. The vegetation was removed from the top of each core with a sterile knife, and the soil below a depth of 8 cm was removed. Each soil core (the top 8 cm of rhizosphere soil) was then homogenized by sieving it through a 3-mm mesh to remove large stones and plant material. The soil used for molecular analysis was then stored at −20°C. The soil pH was determined by using triplicate 5-g soil samples that were shaken with a flask shaker (Stuart Scientific, Redhill, England) in 10 ml of distilled water and allowed to settle for 30 min. The soil moisture content was determined by determining the weight loss (expressed as a percentage) of triplicate 5-g samples after they were dried for 24 h at 105°C.
Sampling within soil cores.
Heterogeneity within a single soil core was investigated by using one randomly sampled core (from improved plot 2) by placing a circular grid with 19 equally spaced reference points on the upper surface of the core (Fig. 1). Triplicate 10-, 1-, and 0.1-g soil samples were then removed from 9 of the 19 points that were predetermined randomly. Triplicate 1- and 0.1-g samples were also removed from the first 10-g samples, and triplicate 0.1-g samples were removed from the first of the 1-g samples. Corers that were 16 and 6 mm in diameter were used to remove approximately 15 and 2 g of soil, respectively, intact to a depth of 8 cm. Samples were then weighed continuously while soil was removed carefully from the edges of the cores until the required sample weights (10 and 1 g) were obtained; 0.1-g samples were obtained by similarly removing soil from the edges of 6-mm-diameter soil cores. After 10-, 1-, and 0.1-g samples were obtained, the remainder of a core was homogenized by sieving. All soil samples were stored at −20°C prior to analysis.
FIG. 1.

Schematic representation of the protocol used for sampling soil from individual soil cores. The surface vegetation was removed, and a grid was placed on the soil surface, which provided 19 equally distributed points for sampling. Nine randomly selected positions were used for removing intact triplicate 10-g soil samples (samples 1 to 3), 1-g soil samples (samples 4 to 6), and 0.1-g soil samples (samples 7 to 9). Triplicate 1-g random intact samples (samples 1.1 to 1.3) and 0.1-g random intact samples (samples 1.4 to 1.6) were removed from the first 10-g sample (sample 1). Triplicate 0.1-g samples (samples 1.1.1 to 1.1.3) were removed randomly from the first 1-g sample (sample 1.1) taken from the first 10-g sample (sample 1).
Extraction of nucleic acids.
For transect soil samples, nucleic acids were extracted by the method described previously (17). Briefly, cells were lysed by vortexing 1 g of soil with 1 g of sterile acid-washed glass beads (diameter, 150 to 212 μm), 1 ml of 0.1 M phosphate buffer (pH 7.8), and 1 ml of Tris-buffered phenol for three 30-s periods at full speed, with chilling on ice between the vortexing steps. The aqueous phase was extracted with phenol-chloroform-isoamyl alcohol (25:24:1) and then with chloroform-isoamyl alcohol (24:1) before the crude aqueous extract (100 μl) was electrophoresed on a 0.8% agarose gel to separate the genomic DNA, rRNA, and humic acids. DNA and 16S rRNA were purified from the agarose by using a Hybaid II DNA purification kit (Hybaid, Ashford, Middlesex, United Kingdom) and a Bio 101 RNaid kit (Anachem, Luton, Bedfordshire, United Kingdom), respectively, according to the manufacturers' instructions.
Nucleic acids from samples of soil from intact cores were extracted by using modifications designed to reduce the differences in lysis efficiency for different sizes of samples by ensuring that the ratios of reagents to soil mass were maintained. To do this, 1- and 0.1-g soil samples were disrupted in sterile petri dishes by using disposable scalpels and placed in 50- and 2-ml centrifuge tubes, respectively, to increase the accessibility of reagents to cells during lysis. To achieve the same lysis efficiency for larger samples, each 10-g sample was homogenized by sieving, and a representative 1-g subsample was used for lysis. For each soil sample, the ratio of soil to glass beads to buffer to phenol used during extraction was 1:1:1:1 (wt/wt/vol/vol). For the 10- and 1-g samples from which triplicate 1- and 0.1-g subsamples, respectively, were removed, 10 μl of crude extract from each of the triplicate subsamples was mixed with 70 μl of crude extract from the larger sample. This avoided discrepancies due to removal of material from larger samples during the sampling process. RNA was purified from agarose by using a Bio 101 RNaid purification kit (Anachem) according to the manufacturer's instructions.
Molecular characterization of archaeal communities.
Archaeal 16S rRNA genes were amplified from DNA extracted from transect soil samples by using a nested PCR strategy, as described previously (17). For amplification we employed primers Ar3F and Ar9R (7, 12), followed by primers SAf and PARCH519r (17, 18), and preparations were subsequently analyzed by DGGE. For within-core samples, RT-PCR was performed with extracted 16S rRNA to increase the sensitivity compared with the sensitivity of amplification from DNA. To generate archaeal cDNA, primer Ar9R was used during RT as described previously (17) before nested PCR was performed.
SAf-PARCH519r PCR products were analyzed by DGGE as described previously (17) by using a DCode universal mutation detection system (Bio-Rad, Hemel Hempstead, Hertfordshire, United Kingdom) according to the manufacturer's instructions. The gels contained a linear 35 to 60% denaturant gradient and were electrophoresed at a constant temperature of 60°C for 5.5 h at 200 V before silver staining. A marker lane containing PCR products of eight grassland archaeal clones (SUPA2, SUPA5, SUPA6, SUPA7, SUPA8, SUPA9, SUPA10, and SUPA11; accession numbers AF512958 and AF512961 to AF512967), representative of the two dominant phylogenetic groups, was included alongside environmental samples to identify putatively the sequences of some bands present in the profiles. In particular, SUPA2 represented a sequence previously found to be dominant in archaeal profiles of improved pasture soils, and SUPA5 was dominant in both improved and unimproved pasture soils (17). DGGE profiles were compared visually on the basis of the presence and relative density of bands. In addition, similarity matrices, based on band presence, were produced by using the Dice coefficient, from which dendrograms could be constructed by UPGMA (8) by using the Phoretix 1-D gel analysis software (Phoretix International, Newcastle-Upon-Tyne, United Kingdom). Gels were silver stained, scanned, and normalized (for variations in DNA loading) for analysis as previously described (16). Briefly, the gel analysis software determined the intensity of each band, and the total band intensity for each lane was normalized to that of the lane with the lowest DNA load (i.e., the lowest total band intensity). The intensity (expressed as a percentage) of the faintest band in the lane with the lowest load was defined as the limit of detection, and bands with a lower percentage of total band volume in all other lanes were not included in the analysis.
RESULTS
Reproducibility of 16S rRNA- and rDNA-derived archaeal DGGE profiles.
To demonstrate the reproducibility of archaeal DGGE profiles obtained by a nested PCR or RT-PCR strategy, nucleic acids were extracted from triplicate 1-g samples from a homogenized core of unimproved soil. Nested PCR and RT-PCR amplifications were performed with both DNA and RNA before DGGE analysis (Fig. 2). As demonstrated previously (17), this approach produced reproducible profiles, and the differences in the archaeal DNA and RNA profiles were associated mainly with relative band intensity rather that band presence.
FIG. 2.
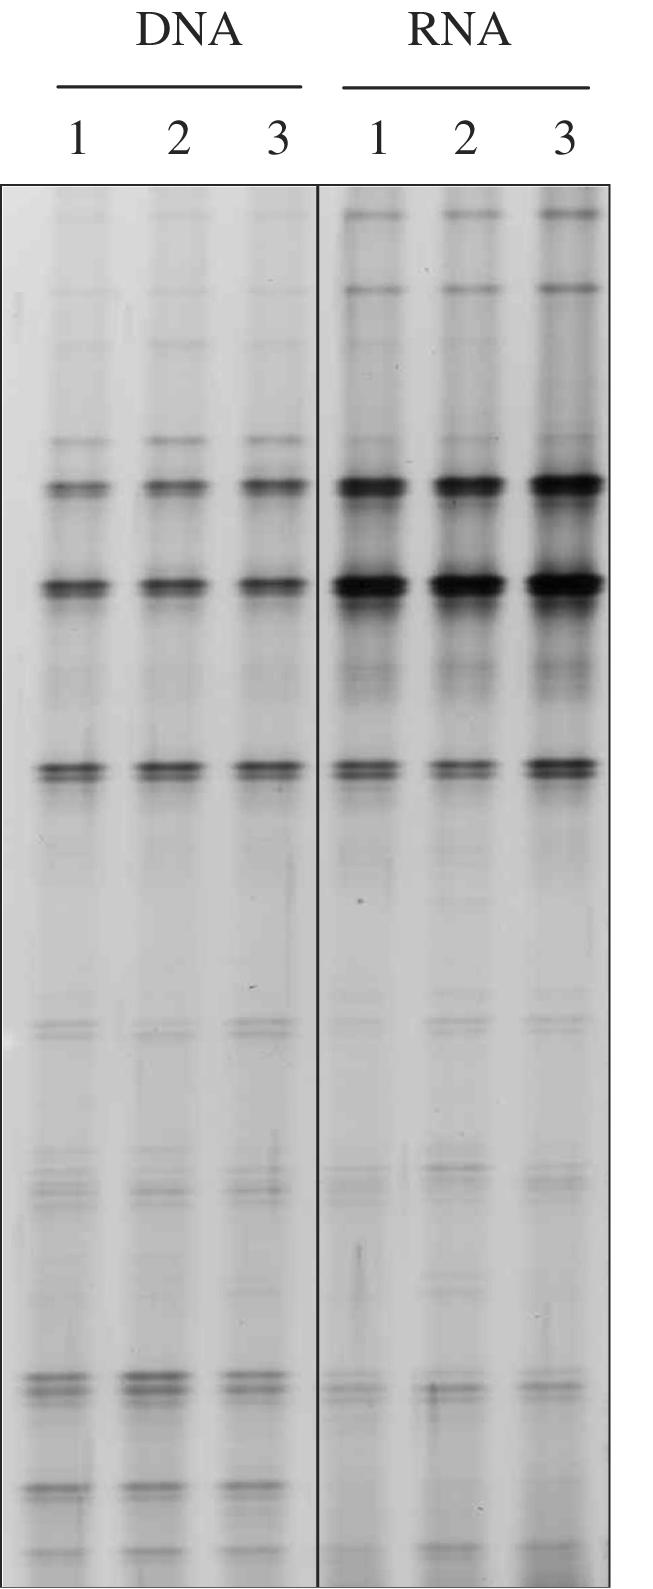
Comparison of 16S rRNA- and rDNA-derived DGGE profiles of triplicate nucleic acid extracts from an unimproved grassland soil core.
Archaeal community structures across transects of improved grassland and unimproved grassland.
The profiles for dominant Archaea in cores obtained from improved plot 1 were relatively consistent across the transect; five lanes were dominated by a band that comigrated with the SUPA2 marker, and the variation was restricted to minor bands (Fig. 3a). A dominant band at the SUPA2 position is consistent with the DGGE profiles of soil samples from this plot (17). The pH of soil from plot 1 was 7.1, as previously observed for this site, but the pH was lower in plots 2 and 3 (pH 6.4 and 6.7, respectively). The variation was much greater for the DGGE profiles for plots 2 and 3, and a band that comigrated with the SUPA5 marker was present in 9 of the 10 cores examined. Again, this was consistent with previous analyses. The dominant band observed in plot 1, which comigrated with SUPA2, was not dominant in all plot 2 and 3 profiles. An UPGMA analysis supported visual indications that there was significant heterogeneity in archaeal community structure across transects 2 and 3 (Fig. 3a). The similarities between adjacent soil cores were no greater than those between distant cores or between cores from the other transect. In contrast, the relatively homogeneous community structure in transect 1 was reflected in the clustering of all five profiles for this transect by UPGMA analysis.
FIG. 3.

DGGE profiles of archaeal 16S rRNA genes amplified by PCR from individual soil cores from improved (a) and unimproved (b) grassland soils and UPGMA dendrograms describing the relatedness of the profiles. Cores were sampled at 2-m intervals along 8-m transects. Transects 1 to 3 were placed in subplots 1 to 3, respectively. Lane M contained a SUPA marker. In the UPGMA dendrograms, the first number indicates the transect and the second number indicates the sampling point along that transect.
The soil pHs and water contents in soil cores were measured as indicators of variability in soil characteristics, and these parameters varied significantly across improved soil transects (Fig. 4). The pHs of all soil samples were greater than 5, and improved plot 1 soil cores had the highest pH values (pH ≥7.0). Although variation in these factors may contribute to heterogeneity in the archaeal community, there was no evidence of a correlation between DGGE profiles and the measured soil properties and there was no evidence of selection for particular archaeal sequences. For example, in transect 3, the pH of soil from cores sampled at 2 and 4 m was 6.7, but the DGGE profiles and UPGMA analysis indicated that there were large differences in community structure. In contrast, the profiles for cores sampled at 2 and 6 m were very similar, while the pH values differed by more than 1 pH unit. Similarly, the water content of transect 2 cores sampled at 0 and 4 m was 49%, but the DGGE profiles were dissimilar.
FIG. 4.

pHs (×) and water contents (▪) of soil cores sampled at 2-m intervals along triplicate 8-m transects across improved and unimproved grassland plots. The error bars indicate standard errors of means for triplicate samples.
DGGE profiles indicated that there was significant spatial variability in the archaeal community across all three transects of the unimproved soil (Fig. 3b). UPGMA dendrograms indicated that the greatest similarity was among the profiles for sampling points across transect 2, which clustered together to the exclusion of transect 1 and 3 soil core profiles. The gel profiles, however, clearly revealed a heterogeneous community structure across transect 2. The DGGE profiles of archaeal communities in samples from transects 1 and 3 did not cluster together; i.e., some profiles for transect 1 samples exhibited the greatest similarity with profiles for transect 3 samples (e.g., core 3, 0 m and core 1, 8 m). The profiles for unimproved transects 1 and 3 were similar to those for improved transects 2 and 3 in that there was no discernible relationship between the distance between samples and community structure. The soil pH and water content varied significantly across the unimproved soil transects, and the pH values were lower than those for improved soils (Fig. 4). Again, however, there was no evidence of a relationship between the environmental factors and archaeal community structure.
Although there was no observed direct relationship between either pH or water content and archaeal community structure, the overall variability in these two factors did reflect the overall variability in archaeal community structure. DGGE and UPGMA analysis indicated that improved transect 1 and unimproved transect 2 exhibited the least variability of the three transects for each grassland type. Both improved transect 1 and unimproved transect 2 also had the smallest differences between the lowest and highest pH values and water contents measured across each transect for each grassland type.
Scale of variability in archaeal community structure within individual soil cores.
A soil core from improved plot 2 was sampled, as illustrated in Fig. 1, and DGGE profiles of the archaeal communities present in different sizes of intact, discrete soil samples were produced. The variability between replicate samples was then examined to determine whether representative community structures at a relatively small scale were related to sample size and/or distance. DGGE profiles of archaeal RT-PCR products obtained from triplicate discrete 10-, 1-, and 0.1-g soil samples and from 10-, 1-, and 0.1-g samples of homogenized soil are illustrated in Fig. 5. An intense band that comigrated with the SUPA5 marker, a sequence widely represented in grassland DGGE profiles, was present in all samples, and, as expected, the DGGE profiles obtained for the homogenized 10-, 1-, and 0.1-g soil samples had similar banding patterns. The profiles obtained for the three replicate 10-g soil samples also appeared to be very similar. Surprisingly, however, the profiles of discrete 10-g samples differed from those of the homogenized soil samples, particularly with respect to the positions and intensities of bands migrating in the region of group 1.1c markers. The variability in profiles was more apparent when replicate 1- and 0.1-g samples were examined, particularly with regard to bands migrating at group 1.1c positions. The profiles for all three discrete 0.1-g samples contained a band with greater intensity that comigrated with the SUPA2 marker. UPGMA analysis of DGGE profiles showed that there was clustering of the three homogenized samples (10, 1, and 0.1 g) with the highest level of similarity (0.91) (Fig. 5). The profiles for the three discrete 10-g samples formed a cluster with a high level of similarity (0.89), but they were distinct from profiles for the homogenized soil samples. UPGMA analysis indicated that there was greater variability between the 1- and 0.1-g sample profiles, with replicates clustering at levels of similarity of 0.62 and 0.59, respectively. These findings are consistent with the hypothesis that decreasing the sample size increases the probability of detecting differences in community structure between samples, as heterogeneity at the 1-g scale should be eliminated in 10-g samples due to homogenization. Thus, the UPGMA analysis results shown in Fig. 5 indicate that there was greater heterogeneity between replicates as the sample size decreased.
FIG. 5.

DGGE profiles of archaeal 16S rRNA amplified by RT-PCR from triplicate 10-g samples (lanes 1 to 3), 1-g samples (lanes 4 to 6), and 0.1-g samples (lanes 7 to 9) taken randomly from within an 8- by 8-cm soil core (indicated schematically) and from 10-, 1-, and 0.1-g samples of the homogenized core and UPGMA dendrogram describing the relatedness of the profiles. Lane M contained a SUPA marker.
Spatial variability in archaeal community structure within individual soil cores.
Two of the three plots of both improved and unimproved soils exhibited heterogeneous archaeal community structure over 8-m transects, and the differences between two samples taken 2 m apart were as great as those between two samples taken >20 m apart from different plots. Comparisons were therefore made between discrete smaller samples to determine whether relationships between DGGE profiles and distance could be detected at a smaller scale.
Archaeal community structure was examined by using two sets of triplicate 1-g samples. One set of samples (samples 4, 5, and 6 [Fig. 1]) was obtained randomly within a 50.2-cm2 area, and one set (samples 1.1, 1.2, and 1.3) was obtained within a 2.1-cm2 area. Three sets of triplicate 0.1-g samples were also obtained from a 50.2-cm2 area (samples 7, 8, and 9), a 2.1-cm2 area (samples 1.4, 1.5, and 1.6), and a 0.3-cm2 area (samples 1.1.1, 1.1.2, and 1.1.3). The variability among random triplicate 1- and 0.1-g samples from a core (50.2 cm2) was demonstrated as described above. This analysis should have revealed whether there was a relationship between the distance between samples and the variability of archaeal community structure at this smaller scale. The DGGE profiles of RT-PCR products obtained from 1-g samples taken within the area of a core (50.2 cm2), from within a 10-g sample (2.1 cm2), and from the homogenized core are shown in Fig. 6. All of the profiles had an intense band that comigrated with the SUPA5 marker, but there were significant differences between the profiles for the 1-g samples obtained within the core and within the smaller 10-g sample. UPGMA analysis (Fig. 6) also indicated that the differences in the profiles between samples taken from the smaller area are as great as those between samples taken from the larger area.
FIG. 6.

DGGE profiles of archaeal 16S rRNA genes amplified by RT-PCR from triplicate 1-g samples taken randomly (indicated schematically) from within an 8- by 8-cm soil core (lanes 4 to 6), from within a 10-g sample (lanes 1.1 to 1.3), and from the homogenized core (lane HC) and UPGMA dendrogram describing the relatedness of the profiles. Lane M contained a SUPA marker.
Similar results were obtained with triplicate 0.1-g samples taken from within a core (area, 50.2 cm2), a 10-g sample (2.1 cm2), and a 1-g sample (0.33 cm2) (Fig. 7). An intense band was again observed comigrating with the SUPA5 marker, and, as previously observed, bands that comigrated with the SUPA2 marker were relatively more intense in the profiles for 0.1-g samples 7, 8, and 9 than in profiles for samples 1 to 6. The DGGE profiles of the archaeal communities in samples 1.4 to 1.6, representing triplicate 0.1-g samples taken from within one 10-g sample, also contained a relatively intense band at this position, but this band was not detected in all three profiles obtained for a single 1-g sample. Again, there were differences between profiles derived from replicate samples from each of the three areas which were different sizes. There was no evidence from the UPGMA analysis of the profiles (Fig. 7) that samples obtained from locations that were closer together were more similar than samples obtained from locations that were separated by larger distances. Although the clustering of the profiles for samples 7 to 9 was apparent compared to the clustering of the profiles for the 10- and 1-g samples (samples 1 to 3 and 4 to 6, respectively) described above, the profiles for samples 7 to 9 did not form a distinct cluster when they analyzed with the other two sets of 0.1-g samples.
FIG. 7.

DGGE profiles of archaeal 16S rRNA genes amplified by RT-PCR from triplicate 0.1-g samples taken randomly (indicated schematically) from within an 8- by 8-cm soil core (lanes 7 to 9), from within a 10-g sample (lanes 1.4 to 1.6), from within a 1-g sample (lanes 1.1.1 to 1.1.3), and from the homogenized core (lane HC) and UPGMA dendrogram describing the relatedness of the profiles. Lane M contained a SUPA marker.
DISCUSSION
Grassland crenarchaeal communities were characterized by DGGE analysis of 16S rDNA and rRNA gene sequences amplified by PCR and RT-PCR with Archaea-specific primers. Previous studies have demonstrated that this approach can be used to distinguish the major proposed phylogenetic groups of nonthermophilic crenarchaeotes detected in grassland soil (17). These groups comprise two clades, groups 1.1b (terrestrial cluster) and 1.1c (FFSB cluster) (2, 3), and each cluster migrates to a different region of a DGGE gel. The banding patterns observed in this study are consistent with the results of previous studies in terms of complexity, which is considerably less than the complexity of bacterial communities, and in the distribution of bands between groups 1.1b and 1.1c. In particular, bands that comigrated with SUPA5, a sequence type previously shown to be abundant in archaeal communities at the sampling site, were present in most samples.
Macroscale variability.
The macroscale variability was assessed by DGGE analysis of homogenized soil taken from cores at 2-m intervals over an 8-m transect. The lowest variability was observed in improved soil transect 1, and the main reason was the high relative abundance of SUPA2-like sequences; all samples from this transect clustered together following UPGMA analysis. The variability was much greater in transects 2 and 3. This was reflected in the increased variability of the soil pH and water content, although a direct correlation was not found, and was possibly a result of greater variation in other parameters that influence the structure of the archaeal community, such as plant diversity or nutrient distribution in the rhizosphere. These results contrast with those of Felske and Akkermans (5), who found little variability in temperature gradient gel electrophoresis profiles of bacterial 16S rDNA amplified from undisturbed 1-g samples taken at 1-m intervals along a 4-m transect in grassland soil at Drentse Aa, The Netherlands. The profiles were similar within transects and for fields that were separated by several hundred meters and received different fertilizer applications. These different findings may have been due to greater homogeneity in the soil and vegetation characteristics of the grassland at Drentse, which potentially reduced the variability in the bacterial community. In addition, Archaea comprises a relatively small component of the prokaryotic community. Although little is known about the physiology or ecological role of these organisms, they may be restricted to fewer niches within the soil and may be more susceptible to heterogeneity in soil characteristics. Analysis of homogenized soil samples provided little evidence of direct links between the archaeal community structure and soil characteristics measured in this study. All improved soil samples had a higher pH than all unimproved samples. In addition, the pH of soil from all cores from improved plot 1 was greater than the pH of the soil from plots 2 and 3. This correlated with dominance by SUPA2-like sequences. A pH of ∼7 for grassland rhizosphere soil may be at the threshold of a pH range limiting the growth and presence of a diverse crenarchaeal community, resulting in the selection of crenarchaeotes represented by SUPA2-like sequences. Dominance by these organisms has previously been associated with improved grasslands, which consistently have higher pH values than natural, unmanaged pastures (17). With this exception, however, archaeal sequence distributions showed no correlation with soil pH, water content, or vegetation cover.
Our results demonstrated the amount of variation in archaeal community structure at the 8-m scale, revealed differences between replicate transects for both grassland types examined, and indicated that variation with distance was not associated with grassland type. For only one improved transect and one unimproved transect, the profiles for the same transect were more closely related to each other than to those for other plots. In the remaining four transects, there was no evidence of any correlation. This information is valuable for sampling regimens, suggesting the number and size of samples required for representative sampling of the natural community (28). Previous analysis (17) showed that there were reproducible differences when samples were obtained within a 5- by 5-m area in each of the subplots in which these transects were located. For analysis of the dominant members of the archaeal community, this sampling regimen therefore appears to be adequate. However, to obtain an inventory of all members of the archaeal community, a much larger number of samples is required, with the data indicating differences in distribution between different sequence types. In particular, SUPA5-like sequences, which have been reported previously to dominate Sourhope grassland archaeal communities, were detected in the majority of samples from both improved and unimproved cores, suggesting that they are able to exist in a wider range of niches in the rhizosphere than other groups.
DGGE profiles were obtained from 1-g samples which were assumed to be representative of the dominant archaeal community in the rhizosphere soil core from which they were obtained. There is a limit of resolution associated with DGGE analysis in that PCR product bands detected in profiles represent the most numerically abundant sequences in a sample. The community structure is heterogeneous, and different organisms are dominant in discrete areas within a sample (either a 0.1-g sample or a soil core). However, organisms that are dominant in microenvironments may be minor components of the total target community and are diluted when samples are homogenized. The absence of a particular band from a DGGE profile does not therefore necessarily indicate that the sequence is completely absent from the community; it merely indicates that the level of the sequence is below the level of detection.
Variability of archaeal community activity in an individual soil core.
Smaller-scale variability was investigated with samples of different sizes taken from a single soil core. As expected, DGGE and UPGMA analyses revealed very similar archaeal community profiles in homogenized samples of different sizes and also demonstrated the reproducibility of the rRNA-based approach. Several bands with similar relative intensities were represented, suggesting that they were ubiquitous in the soil core, while other bands, including those migrating to group 1.1c positions, showed greater variation between profiles. The profiles for 1-g subsamples from the three randomly chosen 10-g samples were also very similar, but the variation among the profiles of triplicate 1-g samples was greater. This indicates that although there may be spatial variation in archaeal communities within a 10-g sample, there is little variation between 10-g samples. It also suggests that the profile of a single 10-g sample should be similar to that of homogenized samples, but the two sets of triplicate samples exhibited clear differences. This may have resulted from differences in processing of the core and individual 10-g samples during homogenization and removal of material during sieving of the bulk sample. Although the 10-g samples were also homogenized, to allow valid comparisons with discrete 1- and 0.1-g samples, care was taken to retain all the soil material which may have included small stones and roots. The variation among triplicate random 1- and 0.1-g samples was greater than the variation among the homogenized or 10-g samples. However, the UPGMA analysis grouped the three 0.1-g samples together, albeit at a relatively low level compared to the level for the homogenized and 10-g samples. Sampling intact 0.1-g samples may have unintentionally introduced bias towards sampling a particular aggregate size, as there is evidence that specific groups within Bacteria are associated with soil aggregates of different sizes (30). This could also explain the increase in the relative intensity of bands that comigrated with SUPA2 in nonhomogenized 0.1-g samples but not in the 0.1-g sample of homogenized soil.
Using two sets of triplicate 1-g samples and three sets of triplicate 0.1-g samples to examine whether samples taken closer together produced increasingly similar profiles of archaeal community activity, we obtained no evidence of such a relationship. For example, 0.1-g samples 1.1.1, 1.1.2, and 1.1.3 did not cluster together, even though their locations were separated by only a few millimeters. Similarly, the profiles obtained for 1-g samples 1.1, 1.2, and 1.3 did not exhibit greater similarity to each other than the profiles obtained for samples 4, 5, and 6 exhibited, as defined by UPGMA analysis. Therefore, there was no evidence that there was a relationship between distance and similarity of discrete samples at the scale examined in these experiments.
RT-PCR was used in the microscale analysis of the archaeal community within an individual core as it was thought that this method would be more sensitive for detecting small differences. A previous analysis of archaeal communities in grassland soil has shown that the dominant bands in rRNA- and rDNA-derived DGGE profiles are the same (17). It is therefore valid to make general comparisons between rRNA- and rDNA-derived DGGE profiles based on variations in the presence of dominant bands. DGGE analysis of the archaeal community structure across 8-m transects demonstrated that sample-to-sample heterogeneity was largely associated with the intense, major bands. All samples from an individual core, however, contained a dominant band that comigrated with SUPA5, and heterogeneity was associated more with bands whose intensity was comparatively minor. It is therefore possible that there is greater variability in the crenarchaeal contribution to particular ecological processes at the macroscale (over a transect) than at the microscale (within a core).
It might be expected that as sample size decreases, a point will be reached at which the archaeal populations are clonal through formation of microcolonies, survival, and limited dispersal. Our findings indicate that this scale is less than 0.1 g. If it is assumed that this mass of soil contains approximately 108 prokaryotic cells, that Archaea accounts for 1% of the prokaryote community, and that the limit of detection on a DGGE gel is 1%, the faintest band on an archaeal DGGE gel is equivalent to approximately 104 archaeal cells. Within such a population, there is potential for substantial diversity. Due to the observed macroscale heterogeneity, these results indicate that to obtain one soil sample representative of the average soil archaeal community of a large area would require homogenization of a large number of individual samples or cores. However, the microscale heterogeneity indicates that if a truly representative sample of a relatively large area could be obtained, those organisms which represent a small component of the archaeal community, present only in microenvironments, would not be observed. An extensive microsampling approach would therefore have to be considered to allow examination of all organisms present.
REFERENCES
- 1.Bintrim, S. B., T. J. Donohue, J. Handelsman, G. P. Roberts, and R. M. Goodman. 1997. Molecular phylogeny of archaea from soil. Proc. Natl. Acad. Sci. 94:277-282. [DOI] [PMC free article] [PubMed] [Google Scholar]
- 2.Buckley, D. H., J. R. Graber, and T. M. Schmidt. 1998. Phylogenetic analysis of nonthermophilic members of the kingdom Crenarchaeota and their diversity and abundance in soil. Appl. Environ. Microbiol. 64:4333-4339. [DOI] [PMC free article] [PubMed] [Google Scholar]
- 3.DeLong, E. F. 1998. Everything in moderation: archaea as ′non-extremophiles.' Curr. Opin. Genet. Dev. 8:649-654. [DOI] [PubMed] [Google Scholar]
- 4.Duineveld, B. M., G. A. Kowalchuk, A. Keijzer, J. D. van Elsas, and J. A. van Veen. 2001. Analysis of bacterial communities in the rhizosphere of chrysanthemum via denaturing gradient gel electrophoresis of PCR-amplified 16S rRNA as well as DNA fragments coding for 16S rRNA. Appl. Environ. Microbiol. 67:172-178. [DOI] [PMC free article] [PubMed] [Google Scholar]
- 5.Felske, A., and A. D. L. Akkermans. 1998. Spatial homogeneity of abundant bacterial 16S rRNA molecules in grassland soil. Microb. Ecol. 36:31-36. [DOI] [PubMed] [Google Scholar]
- 6.Gelsomino, A., A. C. Keijzer-Wolters, G. Cacco, and J. D. van Elsas. 1999. Assessment of bacterial community structure in soil by polymerase chain reaction and denaturing gradient gel electrophoresis. J. Microbiol. Methods 38:1-15. [DOI] [PubMed] [Google Scholar]
- 7.Giovannoni, S. J., E. F. Delong, G. J. Olsen, and N. R. Pace. 1988. Phylogenetic group-specific oligodeoxynucleotide probes for identification of single microbial-cells. J. Bacteriol. 170:720-726. [DOI] [PMC free article] [PubMed] [Google Scholar]
- 8.Griffiths, R. I., A. Whiteley, A. G. O'Donnell, and M. J. Bailey. 2000. Rapid method for coextraction of DNA and RNA from natural environments for analysis of ribosomal DNA- and rRNA-based microbial community composition. Appl. Environ. Microbiol. 66:5488-5491. [DOI] [PMC free article] [PubMed] [Google Scholar]
- 9.Grundmann, G. L., and D. Debouzie. 2000. Geostatistical analysis of the distribution of NH4+ and NO2−-oxidising bacteria and serotypes at the millimeter scale along a soil transect. FEMS Microbiol. Ecol. 34:57-62. [DOI] [PubMed] [Google Scholar]
- 10.Grundmann, G. L., and F. Gourbiere. 1999. A micro-sampling approach to improve the inventory of bacterial diversity in soil. Appl. Soil Ecol. 13:123-126. [Google Scholar]
- 11.Grundmann, G. L., and P. Normand. 2000. Microscale diversity of the genus Nitrobacter in soil on the basis of analysis of genes encoding rRNA. Appl. Environ. Microbiol. 66:4543-4546. [DOI] [PMC free article] [PubMed] [Google Scholar]
- 12.Jurgens, G., K. Linstrom, and A. Saano. 1997. Novel group within the kingdom Crenarchaeota from boreal forest soil. Appl. Environ. Microbiol. 63:803-805. [DOI] [PMC free article] [PubMed] [Google Scholar]
- 13.Marilley, L., and M. Aragno. 1999. Phylogenetic diversity of bacterial communities differing in degree of proximity of Lolium perenne and Trifolium repens roots. Appl. Soil Ecol. 13:127-136. [Google Scholar]
- 14.Marilley, L., G. Vogt, M. Blanc, and M. Aragno. 1998. Bacterial diversity in the bulk soil and rhizosphere fractions of Lolium perenne and Trifolium repens as revealed by PCR restriction analysis of 16S rDNA. Plant Soil 198:219-224. [Google Scholar]
- 15.McCaig, A. E., L. A. Glover, and J. I. Prosser. 1999. Molecular analysis of bacterial community structure and diversity in unimproved and improved upland grass pastures. Appl. Environ. Microbiol. 65:1721-1730. [DOI] [PMC free article] [PubMed] [Google Scholar]
- 16.McCaig, A. E., L. A. Glover, and J. I. Prosser. 2001. Numerical analysis of grassland bacterial community structure under different land management regimens by using 16S ribosomal DNA sequence data and denaturing gradient gel electrophoresis banding patterns. Appl. Environ. Microbiol. 67:4554-4559. [DOI] [PMC free article] [PubMed] [Google Scholar]
- 17.Nicol, G. W., L. A. Glover, and J. I. Prosser. 2003. The impact of grassland management on archaeal community structure in upland pasture rhizosphere soil. Environ. Microbiol. 5:152-162. [DOI] [PubMed] [Google Scholar]
- 18.Øvreås, L., L. Forney, F. L. Daae, and V. L. Torsvik. 1997. Distribution of bacterioplankton in meromictic Lake Saelenvannet, as determined by denaturing gradient gel electrophoresis of PCR-amplified gene fragments coding for 16S rRNA. Appl. Environ. Microbiol. 63:3367-3373. [DOI] [PMC free article] [PubMed] [Google Scholar]
- 19.Pesaro, M., and F. Widmer. 2002. Identification of novel Crenarchaeota and Euryarchaeota clusters associated with different depth layers of a forest soil. FEMS Microbiol. Ecol. 1387:1-10. [DOI] [PubMed] [Google Scholar]
- 20.Ramakrishnan, B., T. Leuders, R. Conrad, and M. Friedrich. 2000. Effect of soil aggregate size on methanogenesis and archaeal community structure in anoxic rice field soil. FEMS Microbiol. Ecol. 32:261-270. [DOI] [PubMed] [Google Scholar]
- 21.Rodwell, J. S. 1992. British plant communities, vol. 3. Cambridge University Press, Cambridge, United Kingdom.
- 22.Sandaa, R.-A., O. Enger, and V. L. Torsvik. 1999. Abundance and diversity of Archaea in heavy-metal-contaminated soils. Appl. Environ. Microbiol. 65:3293-3297. [DOI] [PMC free article] [PubMed] [Google Scholar]
- 23.Semenov, A. M., A. H. C. van Bruggen, and V. V. Zelenev. 1999. Moving waves of bacterial populations and total organic carbon along roots of wheat. Microb. Ecol. 37:116-128. [DOI] [PubMed] [Google Scholar]
- 24.Sessitsch, A., A. Weilharter, M. H. Gerzabek, H. Kirchmann, and E. Kandeler. 2001. Microbial population structures in soil particle size fractions of a long-term fertilizer field experiment. Appl. Environ. Microbiol. 67:4215-4224. [DOI] [PMC free article] [PubMed] [Google Scholar]
- 25.Torsvik, V. L., L. Ovreas, and T. F. Thingstad. 2002. Prokaryotic diversity—magnitude, dynamics, and controlling factors. Science 296:1064-1066. [DOI] [PubMed] [Google Scholar]
- 26.Ueda, T., Y. Suga, and T. Matsuguchi. 1995. Molecular phylogenetic analysis of a soil microbial community in a soybean field. Eur. J. Soil Sci. 46:415-421. [Google Scholar]
- 27.van Bruggen, A. H. C., A. M. Semenov, and V. V. Zelenev. 2000. Wavelike distributions of microbial populations along an artificial root moving through soil. Microb. Ecol. 40:250-259. [DOI] [PubMed] [Google Scholar]
- 28.van Elsas, J. D., K. Smalla, A. K. Lilley, and M. J. Bailey. 2001. Methods for sampling soil microorganisms, p. 505-515. In Manual of environmental microbiology, 2nd ed. ASM Press, Washington, D.C.
- 29.Wachinger, G., S. Fiedler, K. Zepp, A. Gattinger, M. Sommer, and K. Roth. 2000. Variability of soil methane production on the micro-scale: spatial association with hot-spots of organic material and archaeal populations. Soil Biol. Biochem. 32:1121-1130. [Google Scholar]
- 30.Watts, J. E. M. 1999. Analysis of microbial diversity in polluted and nonpolluted soils: a comparison of genetic, functional and cultured based techniques. Ph.D. thesis. University of Warwick, Warwick, United Kingdom.
- 31.Webster, G., T. M. Embley, and J. I. Prosser. 2002. Grassland management regimens reduce small-scale heterogeneity and species diversity of β-proteobacterial ammonia oxidizer populations. Appl. Environ. Microbiol. 68:20-30. [DOI] [PMC free article] [PubMed] [Google Scholar]