Abstract
Background:
The assessment of the severity of aortic valve stenosis is done by either invasive catheterization or non-invasive Doppler Echocardiography in conjunction with the simplified Bernoulli equation. The catheter measurement is generally considered more accurate, but the procedure is also more likely to have dangerous complications.
Objective:
The focus here is on examining computational fluid dynamics as an alternative method for analyzing the echo data and determining whether it can provide results similar to the catheter measurement.
Methods:
An in vitro heart model with a rigid orifice is used as a first step in comparing echocardiographic data, which uses the simplified Bernoulli equation, catheterization, and echocardiographic data, which uses computational fluid dynamics (i.e., the Navier-Stokes equations).
Results:
For a 0.93cm2 orifice, the maximum pressure gradient predicted by either the simplified Bernoulli equation or computational fluid dynamics was not significantly different from the experimental catheter measurement (p > 0.01). For a smaller 0.52cm2 orifice, there was a small but significant difference (p < 0.01) between the simplified Bernoulli equation and the computational fluid dynamics simulation, with the computational fluid dynamics simulation giving better agreement with experimental data for some turbulence models.
Conclusion:
For this simplified, in vitro system, the use of computational fluid dynamics provides an improvement over the simplified Bernoulli equation with the biggest improvement being seen at higher valvular stenosis levels.
Keywords: Valvular stenosis, catheter, Doppler Echocardiography, computational fluid dynamics, turbulence.
INTRODUCTION
Valvular stenosis, specifically, aortic valve stenosis is a common cardiovascular disorder. Prevalence of moderate to severe aortic valve stenosis is 2.8% in patients of age ≥75 years based on US 2000 population and is expected to increase dramatically due to aging of the population [1]. Unoperated symptomatic patients with aortic valve stenosis have dismal prognosis [2]. Assessment of the severity of valvular stenosis can be done by either invasive catheterization or by non-invasive Doppler echocardiography. Parameters generally used to define the severity of aortic valvular stenosis include pressure drop across the valve, aortic valve area (AVA) and aortic velocity [3]. Although catheter measurement is considered the “gold standard”, which provides accurate measure of pressure drop across a stenotic valve, currently non-invasive Doppler echocardiography is mostly used because of risky nature catheterization which includes stroke and death [4].
Doppler echocardiography converts frequency shift of ultrasound due to moving blood cells across the stenotic valve into velocity [5]. This velocity is subsequently converted to a pressure gradient by applying the simplified Bernoulli equation. However, it is not well known whether the Bernoulli equation in general or the simplified Bernoulli equation in particular, result in significant error when compared to the full Navier-Stokes equations for describing the relationship between the flow rate and pressure gradient. In this paper, we examine the potential for using computational fluid dynamics to solve the Navier-Stokes equations, thus avoiding the assumptions of the simplified Bernoulli equation, and improve the analysis of echocardiograph data so that the predicted pressure drop is in better agreement with the catheterization data.
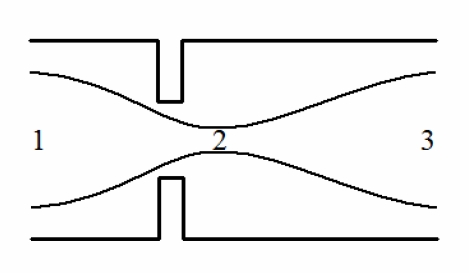
Flow through a simple orifice in a tube is shown in Fig. (1). An energy balance on a particle of fluid traveling on a streamline through this orifice gives [6]:
Fig. (1).
Flow through an orifice in a tube with a vena contracta downstream of the orifice at location 2.
| (1) |
where p is the pressure, ρ is the fluid density, v is the velocity (i.e., speed), z is the height (elevation), g is the gravitational acceleration, and f is the frictional energy loss. The indexes, i and j, refer to two points along the streamline. For the orifice shown in Fig. (1) (or for flow through the aortic valve), the change in height, z , is negligible and that term can be safely discarded. All of the other terms may be significant. For flow between points 1 and 2 in Fig. (1), the energy balance is
| (2) |
and it is common to assume that f is negligible and v2 >> v1, so the energy balance simplifies to:
| (3) |
which is the simplified Bernoulli equation now commonly used to translate the velocity from echocardiography to a pressure drop [7]. Instead of focusing on the flow between points 1 and 2, the energy balance can also be applied between points 1 and 3. For the tube in Fig. (1), the diameter is the same at points 1 and 3 so the velocity must also be identical according to conservation of mass. Therefore, if the energy balance is applied between points 1 and 3 and f is again assumed to be negligible, the energy balance predicts that the pressure at point 1, p1, and point 3, p3, are the same. (This is simply the result of the velocity terms cancelling and the friction term being equal to zero.) The pressure difference between points 1 and 3, in reality, is clearly not zero, and this is because frictional energy loss reduces the pressure recovery between points 2 and 3 so that the pressure at point 3 is not equal to the pressure at point 1. If the assumption of negligible frictional loss fails so badly between points 1 and 3, can the simplified Bernoulli equation be used safely between points 1 and 2? Can computational fluid dynamics be used to solve the Navier-Stokes equations and improve the estimated pressure drop between points 1 and 2 or points 1 and 3 by including friction?
There have been a number of attempts to answer these questions previously (e.g., [7-11]) using both experiments and computational models. Computational models face the extreme complexity of solving the Navier-Stokes equations with flexible vessel walls and a flexible aortic valve [12, 13]. Experimental efforts are limited because it is difficult to get well controlled data in vivo. Our objective is to examine these questions on an in vitro left heart model system where carefully controlled experimental data is available and the rigid vessel walls and valves greatly simplify the mathematical modeling. While these results are not directly applicable to the in vivo problem, we believe they provide a foundation, a starting point, for answering the questions in vivo.
METHODS
In Vitro Pulsatile Left Heart Model
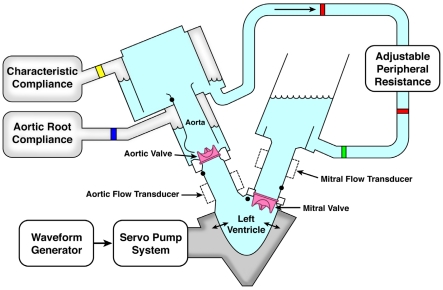
The SuperPump system (ViVitro Systems Inc, Victoria CA) consists of a piston-in-cylinder pump head driven by a low inertia DC electric motor. Attached to this pump is a transparent hydraulic chamber which contains the model left ventricle, left atrium, aorta, mitral and aortic valves (Fig. 2). The SuperPump then translates the programmed stroke volume, heart rate and ejection time. Aortic, ventricular and atrial pressures were monitored using manometer-tipped catheters (Millar Instruments, Inc., Houston, Texas). Flow was measured using an electromagnetic flow probe (Breamar, NC) placed on the aortic position. Flow and pressure waveforms were recorded using the vivitro software, and concomitant pressure tracings were taken using the Gould apparatus. Doppler echocardiography of the aortic valve was performed using a Vivid 7 system (GE Healthcare, Milwaukee, WI) equipped with a 3.5-MHz hand-held transducer. Continuous wave Doppler tracings across the aortic valve were recorded from the apical echocardiographic window. Velocities were then measured offline using the Echo PAC software (GE Healthcare, Milwaukee, WI).
Fig. (2).
Schematic diagram of an in vitro pulsatile left heart model containing echo windows as well as ports for measuring pressure with Millar catheters.
Test Protocol
Stenosed disks with a valve area of 0.5 cm2 and 0.9 cm2 were mounted on the aortic position while a 21mm bileaflet bioprosthetic valve was mounted on the mitral position. Stroke volume was set at 25, 35 and 50ml/min, heart rate at 40 and 70bpm and the ejection time constant at 35% of each cycle. The Millar catheters were placed in 2 positions to measure aortic pressure: 1) at 3 cm upstream of the orifice and at 2) 6.5 cm downstream of the orifice. Doppler images were taken for each hemodynamic set up with simultaneous recording of left heart pressures.
Computational Model
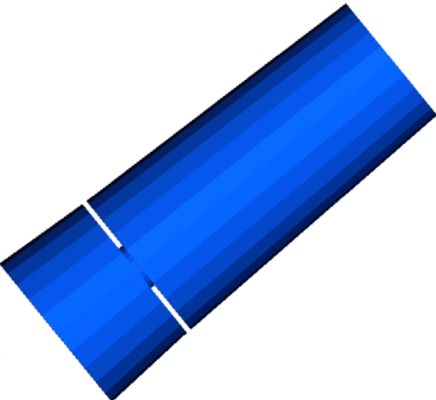
A computational fluid dynamics model (CFD) of flow through the outflow tract of the in vitro pulsatile left heart model was developed. It is important to emphasize that the CFD model is not a model of the outflow tract of the in vivo human heart, but an in vitro left heart model. The in vitro model has a number of advantages for experimental and computational studies. Extensive control and measurement options are possible when conducting in vitro experiments, and, from a CFD perspective, the rigid walls of the outflow tract and precise geometric information greatly simplify the development of an accurate CFD model. The geometry of one computational model is shown in Fig. (3), and the dimensions of the CFD geometry are based on the inside dimensions of the in vitro model. Two different geometries are used for the results presented here, the first geometry has an orifice with an area of 0.93cm2, and the other geometry has an orifice with an area of 0.52cm2. The geometries are identical other than the differences in orifice size.
Fig. (3).
The computational model domain consists of the outflow tract, valve (orifice), and part of the aorta.
The fluid in the in vitro model is a saline solution and the density and viscosity in the model were set equal to that of the saline solution in the in vitro model. The peak velocity measured experimental during a single ejection cycle approached 10m/s, and the diameter of the outflow tract varied between approximately 4cm at the inlet and 1cm through the orifice. Using these values gives a maximum Reynolds number of 1x10⁵ to 4x10⁵; a value large enough to require a turbulence model in the CFD simulation. There are a significant number of turbulence models for different flow regimes and conditions, but the problem of interest here has a relatively low Reynolds number and a unidirectional geometry which combine to allow the use of a relatively simple Reynolds averaging strategy to account for the effects of turbulence. The velocity is decomposed into a mean and fluctuating part, and then the Navier-Stokes equations are rewritten as:
| (4) |
where p is the dynamic pressure, and v is the mean fluid velocity vector, and v' is the velocity fluctuation. To close the system of equations, the k-ε turbulence model is employed because it has been successfully used previously for modeling blood flow [14, 15]. In this model, the turbulent field is characterized in terms of turbulent kinetic energy, k, and the viscous dissipation rate of the turbulent kinetic energy, ε. Additional equations are solved to account for the transport of k and ε through the model domain.
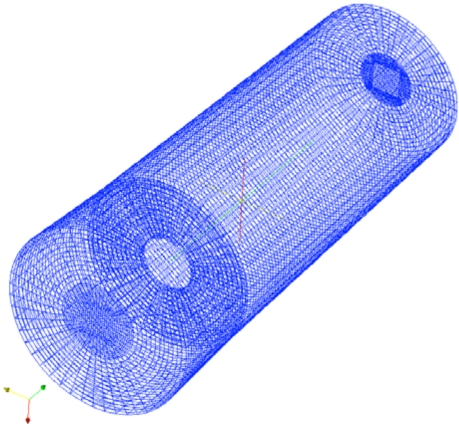
The boundary conditions are similar to those used by others to model blood flow through the aortic valve [9, 10, 15]. No-slip boundary conditions are set along the walls, zero normal gradient boundary conditions are set at the outlet, and the inlet flow rate is set based on the experimentally measured flow rates in the in vitro model. The turbulence model also requires boundary conditions, and k is set to zero along the walls and zero gradient boundary conditions are set on ε. A wireframe image of one mesh is shown in Fig. (4), and this mesh contains 139,680 elements. The highest flow rate simulations were repeated with a mesh containing 433,512 elements, and the pressure gradient differed by less than 1% compared to the coarser mesh, which indicates that the mesh was probably sufficiently refined even with 139,680 elements.
Fig. (4).
Wireframe of the finite volume mesh for the larger orifice geometry.
The model equations with boundary conditions were approximately solved using the OpenFOAM (version 1.5) software (OpenCFD Ltd., UK), which is an open source simulation package written in C++. This software has been used previously to model blood flow [16, 17], and it utilizes a finite volume discretization approach for approximating the solution to the model equations. All visualizations shown here were created using the Paraview software, and mesh generation was performed using algorithms within the OpenFOAM software.
RESULTS AND DISCUSSION
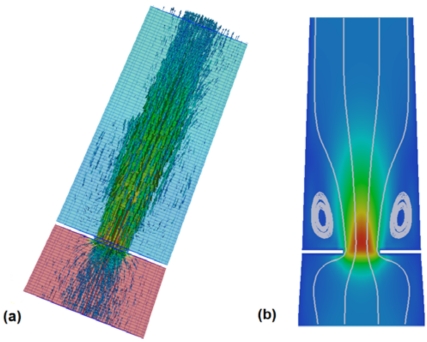
Velocity vectors and the pressure along a single plane for flow through a 0.93cm2 orifice is shown in Fig. (5a). The fluid accelerates significantly as it passes through the orifice, and then decelerates downstream of the orifice. Two interesting features are visible in this figure. First, there is a significant recirculation just downstream of the orifice (Fig. 5b), and, second, the pressure drop is strongly confined to the region near the orifice with little pressure recovery (<20%) downstream of the orifice. The relatively constant pressure downstream of the orifice implies that, for this particular geometry, the frictional energy loss downstream of the orifice is largely balanced by a pressure recovery due to deceleration of the fluid. Another way of saying this is that the decrease in kinetic energy is roughly the same as the frictional energy lost to the walls so there is only a very small increase in pressure.
Fig. (5).
(a) Velocity vectors and pressure drop for flow through a 0.93 cm2 orifice at the peak flow rate, and (b) velocity magnitude and streamlines on a cross section showing the recirculation downstream of the orifice.
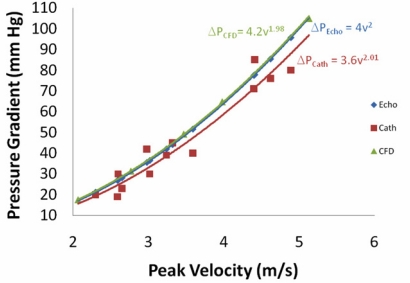
Using different flow rates in the computational model allows for the determination of the maximum pressure drop (sometimes called the maximum pressure gradient) as a function of the maximum velocity. The peak velocity versus peak pressure drop relationship is shown in Fig. (6) along with the experimental catheter pressure drop measurements and the simplified Bernoulli equation at different flow rates. This figure shows excellent agreement between the simplified Bernoulli equation and the full CFD solution of the Navier-Stokes equation. This is truly remarkable result considering all of the assumptions that were made in the derivation of the simplified Bernoulli equation (e.g., negligible frictional energy loss). Fig. (6) also shows good agreement between the experimental catheter measurements and either the simplified Bernoulli equation or the CFD simulation. Using a two-factor without replication ANOVA test, there is a marginal statistical difference between the catheter data and the simplified Bernoulli result (p = 0.071) or the CFD result (p=0.026). Overall, the catheter measured a smaller pressure drop than was predicted, but the difference could simply be due to experimental error.
Fig. (6).
Peak pressure gradient between the outflow tract and aorta as a function of the peak velocity for the 0.93 cm2 orifice using 3 different methods -- Echocardiography with the simplified Bernoulli equation, the CFD model described in this paper, and catheters placed in the in vito left heart model.
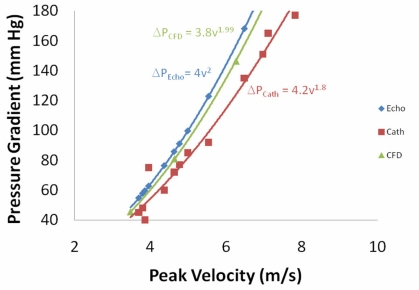
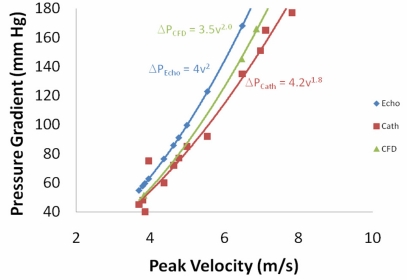
The results for a smaller orifice (0.52cm2 instead of 0.93cm2) are summarized in Fig. (7). Here we observe a small difference between the pressure drop calculated using CFD and the pressure drop calculated using the simplified Bernoulli equation (p < 0.01). However, the difference is small and unlikely to be significant enough to justify the enormous computational cost associated with the CFD simulation compared to the simplified Bernoulli equation (i.e., a few billion floating point operations versus less than 10 operations). For the case of the smaller orifice, we do observe that the catheter measurements of the pressure drop are distinctly less than those predicted by either CFD or the simplified Bernoulli equation (p < 0.01 in both cases). The list of modeling assumptions that could account for this difference and that could be changed to result in a smaller pressure drop is a fairly short list. If the orifice edges in the model were rounded, that could result in a smaller pressure drop and better agreement with the catheter experiments, but the edges are known to be relatively sharp just by examining the experimental orifice disk. Further, initial attempts to slightly round the edges in the computational model did not have a significant impact. Another assumption that could impact the CFD pressure drop is the turbulence model used in the simulation. To test this hypothesis, two difference turbulence models are tested below for the small orifice geometry.
Fig. (7).
Peak pressure gradient between the outflow tract and aorta as a function of the peak velocity for the 0.52cm 2 orifice using 3 different methods -- Echocardiography with the simplified Bernoulli equation, the CFD model described in this paper, and catheters placed in the in vitro left heart model.
The first alternative turbulence model tested was the Launder-Sharma low-Re turbulence model [18]. This model was chosen because it is specifically designed for turbulence at low Reynolds numbers, which is the case for flow through the aorta. The result of using this model (Fig. 8) is slightly better agreement between the CFD model and the catheter data, but there is still a statistically real difference (p < 0.01). Specifically, in the catheter data the pressure drop increases proportional to the velocity to the 1.8 power, . The Launder-Sharma model results in the pressure drop being proportional to the velocity to the 1.94 power, which is higher than the catheter data, but closer than the standard k-ε model, which had the pressure drop proportional to the velocity to the 1.99 power.
Fig. (8).
Peak pressure gradient between the outflow tract and aorta as a function of the peak velocity for the 0.52 cm2 orifice using 3 different methods -- Echocardiography with the simplified Bernoulli equation, the CFD model with the Launder-Sharma low- Re turbulence model, and catheters in the in vitro left heart model.
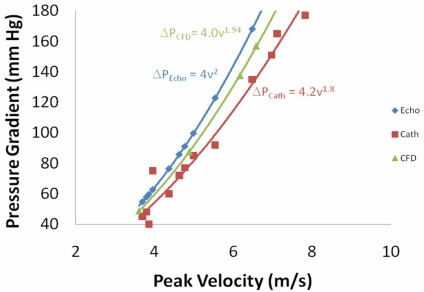
The second alternative turbulence model tested was the RNG (Re-Normalization Group) k-ε turbulence model [19], which has been used previously for modeling blood flow through arterial bifurcations [20]. The results (Fig. 9) in this case were good agreement with the catheter data at low velocities, but poor agreement as the velocity increased (p < 0.05). The decreased agreement with increased velocity is largely due to the fact that the RNG k-ε model predicts the pressure drop is proportional to the velocity to the 2.0 power, which is exactly the same as the simplified Bernoulli equation. A few other turbulence models were tested, including no turbulence (N.B., no turbulence model does not imply a direct numerical simulation because filtering was still used), but none of those models gave better agreement than the 2 alternatives shown here.
Fig. (9).
Peak pressure gradient between the outflow tract and aorta as a function of the peak velocity for the 0.52cm 2 orifice using 3 different methods -- Echocardiography with the simplified Bernoulli equation, the CFD model with the RNG k-ε turbulence model, and catheters in the in vitro left heart model.
For the larger 0.93 cm2 orifice, the choice of turbulence model has an insignificant impact on the results of the CFD simulation. In fact, the need for a CFD simulation at all is questionable for the larger orifice because the simplified Bernoulli equation gave such a similar result. However, the choice of turbulence model clearly has an impact on the accuracy of the CFD model for the smaller 0.52cm2 orifice, which results in a higher Reynolds number. For the turbulence models tested here, the RNG k-ε turbulence model gave the best agreement with the experimental catheter data and the best improvement over the simplified Bernoulli equation.
CONCLUSIONS
The main result from the simulations and experiments described here is that the simplified Bernoulli equation, in spite of all the questionable assumption made in its derivation, predicts pressure drops that are close to the pressure drops predicted by complex CFD modeling for flow through an orifice. Considering the high computational cost of the CFD simulations, the small difference between the results may not justify the extra computational burden. The other important result is that the choice of turbulence model used in the CFD simulation has only a small impact on the predicted pressure drop for flow through an orifice at a specified flow rate, and none of the turbulence models gave excellent agreement with the catheter measurements. It is possible that error in the catheter measurements was the cause for the difference between CFD predictions and catheter measurements of pressure drop, but a more likely cause for the difference is that the model geometry was not exact (overly sharp edges) or that the use of a turbulence model simply introduces too much error. We plan to explore the potential of direct numerical simulation for the modeling of flow through the orifice in the future as more computational resources become available.
ACKNOWLEDGEMENTS
This work was supported by NSF grant DMS-0811275 and the Flight Attendant Medical Research Institute.
REFERENCES
- 1.Nkomo V T, Gardin J M, Skelton T N, Gottdiener J S, Scott C G, Enriquez-Sarano M. "Burden of valvular heart diseases: a population-based study". Lancet. 2006 Sep 16;368:1005–11. doi: 10.1016/S0140-6736(06)69208-8. [DOI] [PubMed] [Google Scholar]
- 2.Chaliki H P, Brown M L, Sundt T M, Tajik A J. "Timing of operation in asymptomatic severe aortic stenosis". Expert Rev. Cardiovasc. Ther. 2007 Nov;5:1065–71. doi: 10.1586/14779072.5.6.1065. [DOI] [PubMed] [Google Scholar]
- 3.Bonow R O, Carabello B A, Chatterjee K, de Leon A C, Faxon D P, Jr, Freed M D, Gaasch W H, Lytle B W, Nishimura R A, O'Gara P T, O'Rourke R A, Otto C M, Shah P M, Shanewise J S. "2008 Focused Update Incorporated Into the ACC/AHA 2006 Guidelines for the Management of Patients With Valvular Heart Disease: A Report of the American College of Cardiology/American Heart Association Task Force on Practice Guidelines (Writing Committee to Revise the 1998 Guidelines for the Management of Patients With Valvular Heart Disease)," . Circulation. p. CIRCULATIONAHA.108.190748, September 26, 2008. [Google Scholar]
- 4.Connolly H M, Ballman K V, Roger V L, Tajik A J. "Aortic stenosis: no more hemodynamic cardiac catheterization!,". Mayo Clin. Proc. 2001 Sep;76:961. doi: 10.4065/76.9.961. [DOI] [PubMed] [Google Scholar]
- 5.Quinones M A, Otto C M, Stoddard M, Waggoner A, Zoghbi W A. "Recommendations for quantification of Doppler echocardiography: a report from the Doppler Quantification Task Force of the Nomenclature and Standards Committee of the American Society of Echocardiography". J. Am. Soc. Echocardiogr. 2002 Feb;15:167–84. doi: 10.1067/mje.2002.120202. [DOI] [PubMed] [Google Scholar]
- 6.White F M. Fluid mechanics. 2nd. New York: McGraw-Hill; 1986. [Google Scholar]
- 7.Baumgartner H, Hung J, Bermejo J, Chambers J B, Evangelista A, Griffin B P, Iung B, Otto C M, Pellikka P A, Quinones M. "Echocardiographic assessment of valve stenosis: EAE/ASE recommendations for clinical practice". J. Am. Soc. Echocardiogr. 2009 Jan;22:1–23. doi: 10.1016/j.echo.2008.11.029. [DOI] [PubMed] [Google Scholar]
- 8.Eichhorn J G, Fink C, Delorme S, Hagl S, Kauczor H U, Ulmer H E. "Magnetic resonance blood flow measurements in the follow-up of pediatric patients with aortic coarctation - A re-evaluation". Int. J. Cardiol. 2006 Nov 18;113:291–298. doi: 10.1016/j.ijcard.2005.11.021. [DOI] [PubMed] [Google Scholar]
- 9.King M J, Corden J, David T, Fisher J. "A three-dimensional, time-dependent analysis of flow through a bileaflet mechanical heart valve: Comparison of experimental and numerical results". J. Biomech. 1996 May;29:609–618. doi: 10.1016/0021-9290(95)00107-7. [DOI] [PubMed] [Google Scholar]
- 10.VanAuker M D, Chandra M, Shirani J, Strom J A. "Jet eccentricity: A misleading source of agreement between Doppler/catheter pressure gradients in aortic stenosis". J. Am. Soc. Echocardiogr. 2001 Sep;14:853–862. doi: 10.1067/mje.2001.113648. [DOI] [PubMed] [Google Scholar]
- 11.Sacks M, Merryman W D, Schmidt D E. "On the biomechanics of heart valve function". J. Biomech. 2009;42:1804–1824. doi: 10.1016/j.jbiomech.2009.05.015. [DOI] [PMC free article] [PubMed] [Google Scholar]
- 12.Ge L, Jones S C, Sotiropoulos F, Healy T M, Yoganathan A P. "Numerical simulation of flow in mechanical heart valves: Grid resolution and the assumption of flow symmetry". J. Biomech. Eng. Trans. Asme. 2003 Oct;125:709–718. doi: 10.1115/1.1614817. [DOI] [PubMed] [Google Scholar]
- 13.Sotiropoulos F, Borazjani I. "A review of state-of-the-art numerical methods for simulating flow through mechanical heart valves". Med. Biol. Eng. Comput. 2009 Mar;47:245–256. doi: 10.1007/s11517-009-0438-z. [DOI] [PMC free article] [PubMed] [Google Scholar]
- 14.Bluestein D, Gutierrez C, Londono M, Schoephoerster R T. "Vortex shedding in steady flow through a model of an arterial stenosis and its relevance to mural platelet deposition". Ann. Biomed. Eng. 1999 Nov-Dec;27:763–773. doi: 10.1114/1.230. [DOI] [PubMed] [Google Scholar]
- 15.DeGroff C G, Shandas R, Valdes-Cruz L. "Analysis of the effect of flow rate on the Doppler continuity equation for stenotic orifice area calculations - A numerical study". Circulation. 1998 Apr 28;97:1597–1605. doi: 10.1161/01.cir.97.16.1597. [DOI] [PubMed] [Google Scholar]
- 16.Yang N, Deutsch S, Paterson E G, Manning K B. "Numerical Study of Blood Flow at the End-to-Side Anastomosis of a Left Ventricular Assist Device for Adult Patients"; ASME 2008 Summer Bioengineering Conference; Marco Island, Florida. 2008. [DOI] [PubMed] [Google Scholar]
- 17.Ivankovic A, Karac A, Dendrinos E, and Parker K. "Towards early diagnosis of atherosclerosis: The finite volume method for fluid-structure interaction". Biorheology. 2002;39:401–407. [PubMed] [Google Scholar]
- 18.Launder B E. "Improved form of low reynolds-number kappa approximately equals epsilon turbulence model - reply". Phys. Fluids. 1976;19:765–766. [Google Scholar]
- 19.Yakhot V, Orszag S A, Thangam S, Gatski T B, Speziale C G. "Development of turbulence models for shear flows by a double expansion technique". Phys. Fluids a-Fluid Dyn. 1992 Jul;4:1510–1520. [Google Scholar]
- 20.Banks J, Bressloff N W. "Turbulence modeling in three-dimensional stenosed arterial bifurcations". J. Biomech. Eng. Trans. Asme. 2007 Feb;129:40–50. doi: 10.1115/1.2401182. [DOI] [PubMed] [Google Scholar]


