

Abstract
Anaplerosis, the net synthesis in mitochondria of citric acid cycle intermediates, and cataplerosis, their export to the cytosol, have been shown to be important for insulin secretion in rodent beta cells. However, human islets may be different. We observed that the enzyme activity, protein level, and relative mRNA level of the key anaplerotic enzyme pyruvate carboxylase (PC) were 80–90% lower in human pancreatic islets compared with islets of rats and mice and the rat insulinoma cell line INS-1 832/13. Activity and protein of ATP citrate lyase, which uses anaplerotic products in the cytosol, were 60–75% lower in human islets than in rodent islets or the cell line. In line with the lower PC, the percentage of glucose-derived pyruvate that entered mitochondrial metabolism via carboxylation in human islets was only 20–30% that in rat islets. This suggests human islets depend less on pyruvate carboxylation than rodent models that were used to establish the role of PC in insulin secretion. Human islets possessed high levels of succinyl-CoA:3-ketoacid-CoA transferase, an enzyme that forms acetoacetate in the mitochondria, and acetoacetyl-CoA synthetase, which uses acetoacetate to form acyl-CoAs in the cytosol. Glucose-stimulated human islets released insulin similarly to rat islets but formed much more acetoacetate. β-Hydroxybutyrate augmented insulin secretion in human islets. This information supports previous data that indicate beta cells can use a pathway involving succinyl-CoA:3-ketoacid-CoA transferase and acetoacetyl-CoA synthetase to synthesize and use acetoacetate and suggests human islets may use this pathway more than PC and citrate to form cytosolic acyl-CoAs.
Keywords: Acetyl-Coenzyme A, Insulin Secretion, Mitochondrial Metabolism, Pancreatic Islet, Pyruvate Carboxylase, ATP Citrate Lyase, Acetoacetate Pathway, Anaplerosis, Human Pancreatic Islets, Succinyl-CoA:3-ketoacid-CoA Transferase
Introduction
Understanding the enzymatic makeup of human pancreatic islets is fundamental to developing strategies for designing artificial beta cells and beta cells differentiated from stem cells as treatments for type 1 diabetes, as well as modulating beta cell metabolism for the treatment of type 2 diabetes. Until recently, most of the information about normal insulin secretion came from studies of rodent islets or clonal cell lines. Although a recent study showed human pancreatic islets respond to insulin secretagogues similarly to rodent islets (1), what is still unknown is whether the use of intracellular pathways of secretagogue metabolism is the same in human islets as in rodent islets and cell lines. During the last few years, human islet preparations from human donors have become more readily available to researchers. By studying the levels of enzymes, the functional units of metabolism, the recent abundant supply of human islets has enabled our laboratory to discover clues suggesting differences in metabolic pathways between pancreatic islets of humans and rodents that have implications for better understanding normal human beta cell physiology.
Anaplerosis, the biosynthesis of citric acid cycle intermediates (2), is widely believed to be important for insulin secretion (3). Pyruvate carboxylase (PC)2 is the key anaplerotic enzyme in this process and plays a central role in insulin secretion in the pancreatic beta cell of rodents and clonal insulin cell lines (3–8). In rat pancreatic islets, the level of PC is as high as in liver and kidney (4, 9–11), two organs in which PC plays a role in gluconeogenesis. In islets, which do not seem to require gluconeogenesis (12, 13), PC is concentrated in the beta cell (11). Our laboratory (4, 14–16) and, subsequently, Kahn et al. (17) previously showed that the rate of carboxylation of glucose-derived pyruvate catalyzed by PC is very high in rat pancreatic islets and equal to the rate of decarboxylation of glucose-derived pyruvate catalyzed by the pyruvate dehydrogenase complex. Lu et al. (18) showed that the rate of pyruvate cycling through PC is proportional to the capacity for glucose-stimulated insulin release from various INS-1 cell lines, and other studies have also found evidence for cycling of pyruvate through PC in rodent clonal beta cell lines (19, 20) and mouse pancreatic islets (21). More recently, we used RNAi knockdown technology to produce a series of cell lines derived from the rat insulinoma cell line INS-1 832/13 that expressed a range of PC levels. In these cell lines insulin release stimulated by glucose, as well as other metabolizable insulin secretagogues, was inhibited in proportion to the severity of PC knockdown (22). Severe knockdown of PC caused a metabolite crossover point in glucose-stimulated cells, with increased pyruvate plus lactate and decreased malate and citrate consistent with a block at the PC reaction (22), further supporting a role for PC in insulin secretion. Another group also found that knockdown of PC inhibits insulin release in rat pancreatic islets (23), and yet another group found that moderate knockdown of PC in INS-1 cells and rat pancreatic islets did not inhibit insulin release possibly due to a compensatory increase in acetyl-CoA that may have activated PC as judged from an increase in acetylcarnitine, a surrogate for acetyl-CoA levels (24). The relatively high level of PC in rodent islets and beta cell lines and the other studies mentioned above unequivocally show that PC is very important for normal insulin secretion in these cells.
In view of the above information that established a role for PC in insulin secretion in rodent islets and clonal beta cell lines, we were surprised when, as a by-product of a very small study in which we compared gene expression and activities of various metabolic enzymes in islets from five nondiabetic humans to islets from five patients with type 2 diabetes (25), we noticed that PC mRNA and enzyme activity appeared to be much lower in islets from nondiabetic humans than we have recently seen in our separate unrelated studies of islets from nondiabetic rats or in clonal beta cell lines. Because of the important role of PC in insulin secretion in rodent beta cells and the preliminary suggestion that the level of PC might be low in human islets, we conducted a larger study focused on PC, as well as other enzymes intended to be controls, in islets from nondiabetic humans. We performed head-to-head comparisons of activities and/or protein levels of PC and other enzymes in human islets to their levels in islets of the rat and/or the mouse and the rat insulinoma-derived INS-1 832/13 cell line. In addition, we compared the relative rates of carboxylation and decarboxylation of pyruvate derived from glucose in intact human islets to these rates in intact rat pancreatic islets where the rate of pyruvate carboxylation is known to be high (14–17).
Our recent studies in rat pancreatic islets and INS-1 832/13 cells (26–29) suggest that beta cells have a pathway that is alternative to a pathway that uses PC and ATP citrate lyase to export carbon precursors of short chain acyl-CoAs to the cytosol. In this pathway, acetoacetate formed in the succinyl-CoA:3-ketoacid-CoA transferase (SCOT) reaction in mitochondria is exported to the cytosol where it can be converted to short chain acyl-CoAs and lipid by a series of reactions that begins with acetoacetyl-CoA synthetase (26–29) (Fig. 1). In the study reported here, the levels of SCOT, acetoacetyl-CoA synthetase, and ATP citrate lyase were among the enzymes we quantified in human islets and compared their levels in interassay measurements with those in rodent islets and the INS-1 832/13 cell line. We also compared glucose-stimulated levels of insulin release and acetoacetate in intact human islets and rat islets, and we studied the ability of β-hydroxybutyrate, the redox partner of acetoacetate, to potentiate glucose-stimulated insulin release in human islets. In addition, we included numerous tests within the study to discern whether the results could be artifacts caused by human donor conditions or the procedure for the preparation of human islets. The results suggest that, although metabolic pathways that require PC and ATP citrate lyase are important in rodent islets, human islets may preferentially use pathway(s) that require SCOT and acetoacetyl-CoA synthetase for stimulating insulin secretion.
FIGURE 1.

Pathways of glucose-derived pyruvate via the pyruvate dehydrogenase complex and SCOT to produce acetoacetate and via pyruvate carboxylase and ATP citrate lyase to produce malate and citrate in mitochondria for export to the cytosol in the pancreatic beta cell. The SCOT pathway is shown with thicker arrows. Abbreviations used are as follows: ACAA1 or ACAA2, acetyl-CoA acyltransferase 1 or 2; ACAT1 or ACAT2, acetyl-CoA acetyltransferase 1 or 2; FAS, fatty-acid synthase.
EXPERIMENTAL PROCEDURES
Materials
Human pancreatic islets used in this study were from Washington University, St. Louis (n = 7 donors), Prodo Laboratories Inc., the Sharp-Lacy Research Institute, Irvine, CA (n = 16 donors), Massachusetts General Hospital (n = 6 donors), and City of Hope, Irvine, CA (n = 1 donor) sponsored by the Juvenile Diabetes Research Foundation. Islets from the University of Wisconsin Islet Cell Resource Center, Madison (n = 9 donors), the University of Miami (n = 6 donors), the University of Pennsylvania, Philadelphia (n = 3 donors), and the University of Alabama, Tuscaloosa (n = 1 donor), were sponsored by the Islet Cell Research Consortium; and islets from the University of Southern California (n = 1 donor) were sponsored by the Integrated Islet Distribution Program. Two additional islet preparations were from Claes-Goran Ostenson at the Karolinska Institutet, Stockholm, Sweden. Human islet preparations are identified by a letter and/or a number in the legends of several figures. The significance of identifying the samples was simply to show that preparations from many different donors were studied.
Sprague-Dawley rats and all mice strains were from Harlan Laboratories, Madison, WI. The INS-1 832/13 cell line was from Chris Newgard. Diazomethane was generated in situ from (trimethylsilyl)diazomethane (Aldrich). A 10-fold excess was used to methylate [1,4-14C]succinic acid and [2,3-14C]succinic acid as described previously (14, 15). The reaction was performed in ethyl ether at 4 °C, and the product was evaporated to dryness and dissolved in water. With the exception of 1-14C]pyruvate, which was from PerkinElmer Life Sciences, and was used in the assay of pyruvate dehydrogenase complex activity, all radioisotopically labeled chemicals were from American Radiolabeled Chemicals, Inc., St. Louis. Antibodies to human SCOT and ACAT1 and ACAT2 were from Dr. Toshiyuki Fukao. Anti-cow glutamate dehydrogenase antibody (catalogue number ab34786) and anti-human pyruvate dehydrogenase complex E1α subunit antibody (catalogue number ab97352) were from Abcam. Anti-human ATP citrate lyase antibody (catalogue number 1699-1) was from Epitomics. Anti-human fatty-acid synthase (catalogue number sc-20140) was from Santa Cruz Biotechnology, Inc. An antibody to human pyruvate dehydrogenase complex E2 protein was the IgG fraction from a pool of 50 primary biliary cirrhosis patients that was affinity-purified on a bovine pyruvate dehydrogenase column, and it was generously provided by Jeremy M. Palmer. The antibody also reacted with the E2 component of the α-ketoglutarate dehydrogenase complex. The antibody to rat acetoacetyl-CoA synthetase was from Tetsuya Fukui. Anti-β-actin and other chemicals in the highest purity available were from Sigma.
Islet Handling and Subcellular Fractionation
Human islets received in 2008–2011 from all sources were shipped in tissue culture medium. After the islets were received in our laboratory, they were maintained from 2 to 24 h in the medium in which they were shipped (CMRL 1066 tissue culture medium (or PIM when islets were from Prodo Laboratories)) and occasionally in RPMI 1640 medium modified to contain 5 mm glucose before use. Alternatively, islet pellets or whole-cell homogenates were prepared, and these were stored frozen until use. Human islets shipped from St. Louis in 1998 (n = 4) and from Stockholm in 2004–2008 (n = 2) were snap-frozen as islet pellets after isolation and shipped on dry ice.
For dilution to the optimal concentrations of enzyme protein for subsequent use in assays of enzyme activity and Western analysis, it was practical to homogenize human islets at a concentration of ∼7,000 islets/ml in KMSH (220 mm mannitol, 70 mm sucrose, and 5 mm potassium Hepes buffer, pH 7.5) containing 1 mm dithiothreitol (4, 25, 27) to produce a homogenate with about 2 mg of whole-cell protein/ml of homogenate, which was diluted as needed at the time of use. This concentration of protein in a whole-cell homogenate was about the minimum required for optimal preservation of the activities of most of the enzymes studied. For the first 13 human islet samples received, a protease inhibitor mixture (ThermoScientific product 78415) was included in the homogenization solution. Subsequently, it was not included because its use produced no discernible difference in enzyme activities. When the activity of the pyruvate dehydrogenase complex was to be measured, the homogenizing solution contained 10 mm MgCl2 and 1 mm dichloroacetate (30) in addition to the ingredients described above. Rat and mouse islets were isolated as described previously (4, 14–16) and homogenized in the KMSH/dithiothreitol solution described above, except the concentration of islets was about ∼3,600 islets/ml of homogenizing solution. Some of the rat islet preparations were maintained in RPMI 1640 medium modified to contain 5 mm glucose for 24 h or as frozen homogenates or as islet pellets before use to produce control samples maintained under conditions similar to the human islets.
Enzyme Assays
Because the emphasis of the study was on PC, PC enzyme activity was measured first and usually in a fresh homogenate of human islets that had either not been frozen at all or was stored frozen for no more than 1 day. The activities of other enzymes were measured as soon as practical after PC was measured and in enough samples to discern whether their levels were different between the human islets and control islets or the INS-1 832/13 cell line. The numbers of human islets received in each shipment precluded the measurement of activities of all enzymes especially when the islets were also used for studies of islet metabolism. Activities of all enzymes were measured under Vmax conditions. Pyruvate carboxylase (22), propionyl-CoA carboxylase (22), pyruvate dehydrogenase complex (13), mitochondrial glycerol phosphate dehydrogenase (31), and glutamate dehydrogenase (22) activities were measured in the whole-cell homogenates as described previously. Activities of ATP citrate lyase (24), malic enzyme (14, 32, 33), NADP isocitrate dehydrogenase (33, 34), malate dehydrogenase (35), and aspartate aminotransferase (35) were measured as described previously in a supernatant fraction of cells prepared so as to contain cytosol proteins and mitochondrial matrix proteins but not mitochondrial membrane proteins (the supernatant fraction from centrifuging the frozen-thawed whole-cell homogenate at 20,800 × g for 20 min) (22, 26). The concentrations of ingredients of the enzyme reaction mixtures and conditions of the more relevant enzyme assays are briefly described in the supplemental material.
Western Blot Analysis
Immunoblotting (26, 36) and probing of blots with streptavidin (4) were performed as described previously. Proteins were separated by SDS-PAGE, and after transfer to nitrocellulose, the membrane was blocked with a mixture of 10 mm Tris buffer, pH 8.0, 150 mm NaCl, and 0.05% Tween 20 (TBST), and 5% nonfat powdered dry milk and probed with a “first” antibody. The first antibody bound to a protein band was detected with horseradish peroxidase-conjugated goat anti-rabbit IgG (Thermo Scientific) used at 1:13,000. The signal was detected using the Immobilon Western chemiluminescent HRP developer (Millipore). As a control for equal protein loading, the blot was stripped with Restore Western blot stripping buffer (Thermo Scientific) and reprobed with a polyclonal antiserum to β-actin diluted in TBST and 3% bovine serum albumin. For detecting biotin-containing proteins, PC and PCC, the nitrocellulose membrane was blocked with TBST buffer containing 2% gelatin. The streptavidin-horseradish peroxidase conjugate antibody (RPN1231, PerkinElmer Life Sciences) was used at 1:20,000 (diluted in TBST + 2% gelatin). The signal was detected using the West Pico CL kit (Pierce catalogue number 34077). To estimate relative densities of the protein bands captured on x-ray films exposed to the immunoblots, the areas and densities of the bands were measured with a Bio-Rad Chemidoc XRS Imaging System and calculated with Quantity One software.
Protein Concentration
The protein concentrations of whole-cell homogenates and supernatant fractions used for measurements of enzyme activity and immunoblot analysis were measured by the Bradford method. The amount of protein in pellets of intact islets from metabolite measurements was measured by the Lowry method after the protein precipitates were washed with 10% trichloroacetic acid.
Pyruvate Carboxylation Measured by 14CO2 Ratios
The 14CO2 ratios method was used to compare the fractions of glucose-derived pyruvate that enter mitochondrial metabolism by carboxylation and decarboxylation in human pancreatic islets versus in rat pancreatic islets. The 14CO2 ratios method was developed by Kelleher and Bryan, III (37), and its use in rat pancreatic islets is described in Refs. 14–16. Briefly, the rate of 14CO2 produced from the metabolism of [2-14C]pyruvate is divided by the rate of 14CO2 produced from [3-14C]pyruvate to obtain a pyruvate 14CO2 ratio. The rate of 14CO2 produced from metabolism of [1-14C]acetate is divided by the rate of 14CO2 produced from [2-14C]acetate to obtain an acetate 14CO2 ratio. The pyruvate and acetate 14CO2 ratios were then used in a formula to calculate the fractions of pyruvate that enter the citric acid cycle via pyruvate carboxylation catalyzed by pyruvate carboxylase and via decarboxylation catalyzed by the pyruvate dehydrogenase complex. As was done previously (14–16), we used glucose labeled with 14C at positions 2 and 6, which, after metabolism via the glycolytic pathway, became pyruvate-labeled at positions 2 and 3, respectively, to obtain the pyruvate 14CO2 ratio. We used dimethyl succinate labeled at the 1 plus 4 carbons and the 2 plus 3 carbons of the succinate part of the molecule, which can substitute for acetate labeled at positions 1 and 2, respectively, to obtain the acetate 14CO2 ratio (14–16).
The fraction of pyruvate carboxylated was calculated according to Ref. 37, Equation 4, which is twice the difference of the acetate and pyruvate ratios divided by the following three terms: 1 + the pyruvate ratio, the acetate ratio − 1, and 2 − F, where F is the ratio of randomized to nonrandomized carbon in the reactions oxaloacetate to malate to fumarate and back to oxaloacetate. The values of F equal to 0.8 and 1.0 were used in this equation which assumes, respectively, almost complete and complete randomization of carbon in these metabolites. Because the activities of the enzymes catalyzing these reactions, fumarase3 and malate dehydrogenase (Table 4) (25, 38), are very high in islets, this is a reasonable assumption.
TABLE 4.
The fraction of pyruvate carboxylated is low in human islets as judged from the 14CO2 ratios method
The [2-14C]pyruvate/[3-14C]pyruvate CO2 ratio was calculated by dividing the 14CO2 released from [2-14C]glucose by that from [6-14C]glucose, and the [1-14C]acetate/[2-14C]acetate ratio was calculated by dividing the 14CO2 released from dimethyl [1,4-14C]succinate by that from dimethyl [2,3-14C]succinate (14–16). The fraction of pyruvate carboxylated expressed as a percent of pyruvate carboxylation plus pyruvate decarboxylation was calculated from the pyruvate and acetate ratios using the formula described under “Experimental Procedures.” The ratios were calculated assuming 80% (the lower estimate) and 100% randomization (the higher estimate) of oxaloacetate carbon in the combined malate dehydrogenase and fumarase reactions prior to metabolism in the citric acid cycle. Results of CO2 formation are shown as the mean ± S.E. (N) of data from experiments with N batches of rat islets or batches of human islets from N donors. In each experiment, there were 3 or 4 replicate test tubes of rat islets and 6 replicate test tubes of human islets (100 islets/test tube for each condition). The mean ± S.E. BMI and age of the human islet donors whose islets were used for these measurements were 27.7 ± 1.5 kg/m2 and 46.9 ± 4.2 years.
| Islets | Tracer | CO2 formation | CO2 ratios | Pyruvate carboxylation |
|---|---|---|---|---|
| nmol 14CO2/90 min | % | |||
| Rat | [2-14C]Glucose | 2.33 ± 0.33 (5) | Pyruvate 14CO2 ratio | |
| Rat | [6-14C]Glucose | 1.29 ± 0.16 (5) | 1.81 | |
| Rat | Dimethyl [1,4-14C]succinate | 4.30 ± 0.57 (3) | Acetate 14CO2 ratio | |
| Rat | Dimethyl [2,3-14C]succinate | 0.92 ± 0.45 (3) | 4.67 | 46–55 |
| Human | [2-14C]Glucose | 1.85 ± 0.19 (7) | Pyruvate 14CO2 ratio | |
| Human | [6-14C]Glucose | 1.12 ± 0.11 (7) | 1.65 | |
| Human | Dimethyl [1,4-14C]succinate | 2.32 ± 0.41 (7) | Acetate 14CO2 ratio | |
| Human | Dimethyl [2,3-14C]succinate | 1.26 ± 0.34 (7) | 1.84 | 14–17 |
Human or rat pancreatic islets (100/test tube) were incubated for 90 min in Krebs-Ringer bicarbonate Hepes buffer, pH 7.3, containing 0.5% fatty acid-free bovine serum albumin, in the presence of [2-14C]glucose and [6-14C]glucose (16.7 mm) (specific radioactivity 0.2 mCi 14C/mmol glucose) and dimethyl [1,4-14C]succinate and dimethyl [2,3-14C]succinate (10 mm) (specific radioactivity 0.2 mCi 14C/mmol dimethyl succinate).
Metabolite Measurements
Acetoacetate and malate levels were measured by alkali-enhanced fluorescence as described previously (38–40).
Insulin Release
Insulin release was studied as described previously (13, 31, 35) with the same average size and similar number (confirmed by islet protein measurements) of rat or human islets per vial incubated for 1 h in the presence of Krebs-Ringer bicarbonate buffer modified to contain 10 mm Hepes buffer, pH 7.3, and 0.5% fatty acid-free bovine serum albumin. Insulin was measured by a radioimmunoassay with human insulin or rat insulin as a standard. Rat islets used for insulin release were from 2- to 2.5-month-old male and female animals weighing 225–250 g. The average BMI and age of the human islet donors whose islets were used for insulin release are mentioned in Table 5.
TABLE 5.
The ratio of pancreatic islet PC mRNA to liver PC mRNA is much lower in the human than in the rat
mRNA levels were estimated by quantitative PCR. The level of PC mRNA was divided by the levels of various other mRNAs in the same tissue. The islet ratio was then divided by the same ratio in liver, and the islet value was expressed as a percentage of the value from liver of the same species with the average values from two human livers and four rat livers each set at 100%. Two primer sets were used for human liver. Results are the mean ± S.E. of islets from nine human donors and four batches of rat islets. The mean ± S.E. BMI and age of the human donors whose islets were used for these measurements were 30 ± 1.8 kg/m2 and 46.3 ± 5.4 years. FAS is fatty-acid synthase.
| PC mRNA/other mRNA | Ratio of human islet PC mRNA to liver PC mRNA |
Ratio of rat islet PC mRNA to liver PC mRNA | Ratio of rat islet to human islet | |
|---|---|---|---|---|
| PC1 primers | PC2 primers | |||
| % of liver | % of liver | fold | ||
| PC/Glud1 | 8.9 ± 0.9 | 15.0 ± 3.2 | 73 ± 7 | 6.1 |
| PC/ME1 | 1.6 ± 0.3 | 3.0 ± 0.4 | 9 ± 1.9 | 3.9 |
| PC/mGPD | 0.4 ± 0.1 | 0.7 ± 0.1 | 3.9 ± 0.3 | 7.1 |
| PC/Idh1 | 14 ± 2.6 | 27 ± 6.0 | 216 ± 28 | 10.5 |
| PC/Idh3a | 1.6 ± 0.4 | 2.9 ± 0.6 | 8.6 ± 1.3 | 3.8 |
| PC/FAS | 5.2 ± 0.1 | 9.7 ± 1.5 | 41 ± 8 | 5.5 |
Quantitative PCR
Tissues were homogenized with a Qiashredder (Qiagen) (islets) or using a Potter-Elvehjem homogenizer (liver), and RNA was prepared using the RNeasy mini kit (product number 74104, Qiagen). On-column DNase digestion was performed using the Qiagen RNase-free DNase set. cDNA was made with randomized primers with the Retroscript kit (AM1710) (Applied Biosystems). Quantitative PCR was performed on a MyIQ real time detection system (Bio-Rad) with SYBR Premix Ex Taq (RR041Q) (Takara). mRNAs encoding other metabolic enzymes were measured as internal controls for PC mRNA measurements. Nucleotide sequences of primers used are shown in supplemental Table 2. Human islet RNAs were compared with RNAs from a liver of a 51-year-old male (Clontech, catalogue number 636531) and a surgical specimen from an adult human liver (of unknown gender and age due to privacy protection) from the University of Wisconsin Hospital. RNA was isolated from islets of human donors whose average BMI and age are shown in Table 5. RNA from rat islets was from 8- to 10-week-old male rats and RNA from rat liver was from two 8- to 10-week-old male rats and two 11-month-old female rats.
Human PC mRNA was measured with two primer sets (PC1 (789–864) and PC2 (2042–2131)). The relative level of the PC mRNA was divided by the relative levels of other metabolic enzyme mRNAs, and these ratios were expressed as a percent of the same ratios in liver with the liver values expressed as 100%. The ratios of the human islets versus liver were compared with the same ratios from the rat. The integrity of the RNA samples and their concentration were measured with the Agilent 2100 Bioanalyzer using RNA6000 NanoChips at the University of Wisconsin Biotechnology Center. Integrity numbers, where 10 is the highest and integrity numbers of above 6 indicate RNA suitable for accurate PCR measurements (41), were as follows: human islets (9.1, 8.5, 9.1, 8.5, 9.0, 7.4, 8.7, 9.2, and 9.0), human liver (7.4 and 8.0), rat islets (5.5, 7.1, 6.6, and not done), and rat liver (9.1, 9.0, 7.4, and not done). In addition, the comparison of PC mRNA with other mRNAs in the same tissue also serves as a control for RNA quality.
Statistical Significance
Statistical significance of differences was assessed by Student's unpaired t test.
RESULTS
Characteristics of Human Islet Donors and Islets
Human islet preparations from 52 donors were studied. Ages of the donors ranged from 19 to 74 years (mean age ± S.E. = 44.9 ± 2.1 years, median age = 46 years). Twenty four of the 48 donors for whom the gender was known were female and 24 were male. BMI when recorded (n = 47) ranged from 20.1 to 51.2 kg/m2 (mean ± S.E., 29.4 ± 1.1 kg/m2) (median = 28.6 kg/m2). The BMIs of 15 donors were between 20 and 26 kg/m2; 21 were between 26 and 32 kg/m2; 5 were between 33 and 36 kg/m2; 5 were between 37 and 44 kg/m2, and 1 was equal to 51.2 kg/m2. Average BMIs and ages of donors whose islets were used for various measurements are shown in the corresponding tables or figures. The purity of 29 islet preparations was rated as 90–99%, 12 as 80–89%, 6 as 76–79%, 4 as 70%, and 1 as 68% by the laboratories that isolated the islets. The viability was described as 90–98% for all but four islet preparations that were described as 82–87% viable.
Influences of Protein Concentration on Enzyme Activity
Because either too little or too much protein in the enzyme reaction mixture may each lower the specific enzyme activity, optimal concentrations of protein in the enzyme reaction mixtures were determined for the PC assay and the other assays. The concentrations of protein and the volume of extract added and the final volumes of reaction mixture for the more relevant enzyme assays are listed in supplemental Table 1. Every PC and PCC enzyme reaction mixture contained 10 μl of 2 mg whole-cell protein/ml in a final volume of 50 μl.
Low PC Enzyme Activity in Human Islets
Measurements of PC enzyme activity were performed on the first 23 excellent quality samples of human islets received and always within an hour of homogenization of the islets or within an hour of the first thaw of a homogenate stored for 1 day or a shorter time period. Human islets received subsequently were used for 14CO2 ratios, metabolite, and mRNA measurements and insulin secretion experiments (see below.).
In each PC assay, a rat islet sample that was maintained similarly to the human islet sample (in tissue culture, as a frozen islet pellet, or a briefly frozen fresh homogenate) and/or an INS-1 832/13 sample (usually stored frozen as a whole-cell homogenate for several days or weeks) was included as a control along with the human islet sample. Most of the human islet samples were maintained for 2–4 or 24 h in tissue culture medium (usually CMRL medium or PIM medium (which each contain 5 mm glucose)) after they were received, and the PC assay was performed immediately after the tissue culture and homogenization of the islets without freezing of the whole-cell homogenate. When human islets were received as frozen pellets without prior tissue culture, the PC assay was performed within an hour of thawing of the islet pellet (very few samples). Regardless of the conditions under the human islets were maintained prior to the PC assay, all of the PC values were similar and much lower than the values from rat islets and INS-1 832/13 cell samples maintained under similar conditions prior to the measurements of PC enzyme activity. Maintaining human islets in RPMI 1640 tissue culture medium with the glucose concentration adjusted to 5 mm (as is used to maintain rat islets in tissue culture in our laboratory) for 2–4 or 24 h did not produce PC enzyme activities that were different from those in islets maintained for any length of time in CMRL medium or PIM medium.
The PC enzyme activity of samples of islets from the 23 human donors studied for PC activity averaged 13 ± 2% of the same assay control values (6.3 ± 0.8 (means ± S.E.) versus ≅45 nmol of CO2 fixed per min/mg of whole-cell protein) of the PC activity in rat islets and in INS-1 832/13 cells (Table 1). This tight clustering of human islet PC values around 13% of the control PC values, instead of being spread across a large range from equal to the values of rat islets to close to zero, suggests the low values are intrinsic to human islets rather than an artifact of handling of the islet preparations. The same-assay rat islet preparations were from 2- to 2.5-month-old rats. As an additional control for older age, PC activity was also measured in islets from 11-month-old rats. This PC value was even higher than the same-assay rat islet PC activity (Table 1).
TABLE 1.
Lower PC enzyme activity in pancreatic islets than rat islets or INS-1 832/13 cells
Enzyme activities in whole-cell homogenates of human islets were compared with activities in homogenates of either rat islets or INS-1 832/13 cells measured in the same assay batch. PC was also measured in islets of older rats as a control for aging. Results are the mean ± S.E. with the number of observations in parentheses. The activity of propionyl-CoA carboxylase (PCC), an enzyme that catalyzes a reaction similar to PC, is shown as an additional control. The mean ± S.E. BMI and age of the human islet donors whose islets were used for these measurements were 28.9 ± 1.9 kg/m2 and 51.3 ± 2.6 years.
| Islet source | PC activity | PCC activity |
|---|---|---|
| nmol of CO2 fixed per min/mg of protein | nmol of CO2 fixed per min/mg of protein | |
| Human islets | 6.3 ± 0.8 (23)a | 25.3 ± 4.1 (6) |
| Same assay control, rat (age 2 months) islets | 45.5 ± 4.4 (7) | 29.0 ± 1.6 (7) |
| Same assay control, INS-1 832/13 cells | 44.8 ± 2.5 (15) | 1.6 ± 0.2 (9) |
| Rat (age 11 months) islets | 59.8 ± 3.3 (6) |
a p < 0.001 versus rat islet or INS-1 832/12 cell PC values.
On the possibility that various subtypes of islets possess superior characteristics that might be associated with higher PC activities, the islets were classified into various subcategories. None of these categories showed higher PC activities. These were handpicked islets (that might have been more pure) (PC activity = 6.9 ± 0.3 (3)), small human islets (small human islets have been reported to show higher glucose-stimulated insulin release in vitro and after transplantation in humans (42)) (PC activity = 5.7 and 7.3 (2)), and islets maintained for 24 h in the RPMI 1640 tissue culture medium modified to contain 5 mm glucose (the same medium used to maintain the rat islets) (PC activity = 4.8 ± 1.2 (3)), as well as entire human islet preparations (PC activity = 6.5 ± 0.8 (18)), which should have been a mixture representative of all the islets of the pancreas (mean PC activity in nmol CO2 fixed per min/mg of protein ± S.E. (N)).
Even when the very highest PC enzyme activities of the human islets were compared with the PC values of the rat islets and/or the INS-1 832/13 rat insulinoma cell line measured in the same assay batch, the human islet PC enzyme activities were still much lower than the rodent values. The average of the highest quartile (n = 5) of human islet PC values was only 22 ± 2.2%, and the average of the highest eight human islet PC values was 18 ± 1.8%, of the same-assay rat islet and INS-1 832/13 cell PC values (Table 2).
TABLE 2.
Lower PC enzyme activity in the highest quartile of human islet PC values compared with same assay rat islet or INS-1 832/13 cell PC values
PCC activity is shown as an additional control. PC and PCC enzyme activities in whole-cell homogenates are from Table 1 and are the mean ± S.E. with the number of preparations studied in parentheses.
| Enzyme activity | |
|---|---|
| nmol of CO2 fixed per min/mg of protein | |
| Highest quartile of human islet PC values | 11.9 ± 1.1 (5)a |
| Highest eight human islet PC values | 9.6 ± 1.0 (8)a |
| Same assay rat islet PC values | 53.4 ± 2.2 (3) |
| Same assay INS-1 832/13 PC values | 53.0 ± 3.3 (5) |
| PCC value of highest PC quartile human islets | 26.9 ± 4.7 (5) |
| Same assay rat islet PCC values | 30.6 ± 1.7 (4) |
a p < 0.001 versus rat islet or INS-1 832/12 cell PC values.
Low PC Protein in Human Islets
As a biotin-containing protein, PC can be detected with streptavidin that binds to biotin-containing proteins in Western blots. In agreement with the low PC enzyme activities, Western blot analysis with streptavidin showed that the PC protein was much lower in the samples of islets from human donors compared with similarly treated rat and mouse islets and INS-1 832/13 cells. This was the case whether the human and rodent islets were processed immediately after the islets were received, after tissue culture for 2 h to 1 day, and after islets were stored frozen as pellets at −20 °C for about 1 month or at −70 °C for up to 10 years (Figs. 2 and 3). The low PC in human islets cannot be explained by the human PC being more readily degraded during frozen storage because the PC protein in human liver was not low after frozen storage for 7 months (Fig. 3). A densitometric scan of the PC protein bands showed that the density of the human islet PC bands was 5 ± 1% (6) (mean ± S.E. (N)) of that of the rat and mouse PC bands (Fig. 3).
FIGURE 2.
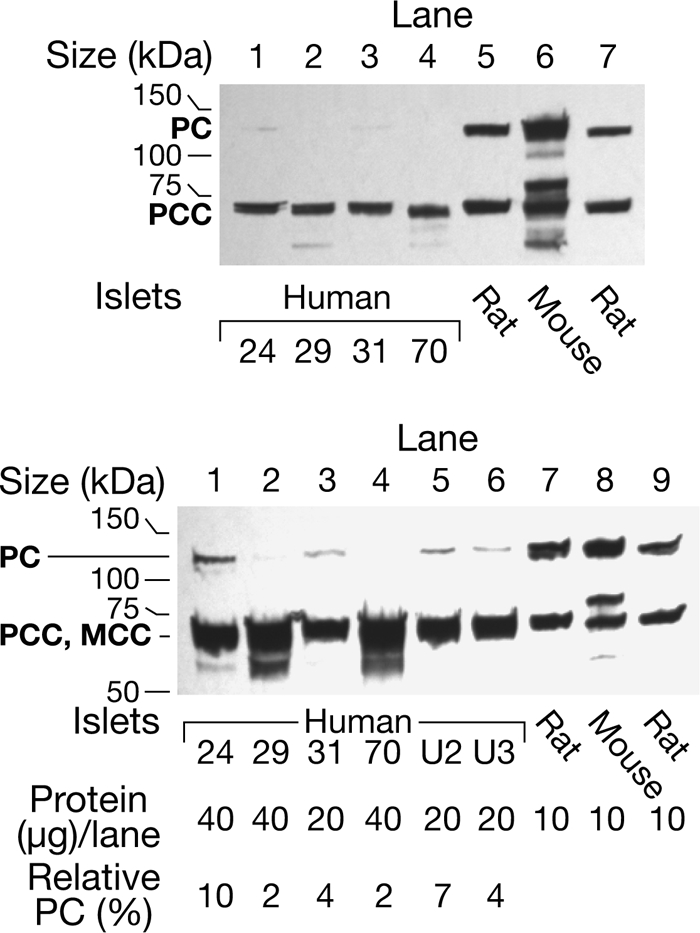
Level of pyruvate carboxylase protein is much lower in human pancreatic islets than in mouse and rat islets. The upper panel shows a streptavidin-probed blot of islets from four human individuals identified by numbers and islets from the rat and the mouse. Each preparation was snap-frozen immediately after isolation. All of these samples happen to have been stored frozen as islet pellets for 8–10 years before they were homogenized in a solution of KMSH containing 1 mm dithiothreitol and analyzed. There was 15-μg whole-cell proteins per lane. The band that migrates at ∼130 kDa is PC and is not visible (lanes 2 and 4) or barely visible (lanes 1 and 3) in the islets from the humans. The band at ∼72 kDa is the α-chain of propionyl-CoA carboxylase (PCC) (with or without methylcrotonyl-CoA carboxylase (MCC) that migrates close to the α-chain of PCC). The density of this band is relatively the same in lanes of the human and rodent islets. The lower panel shows the semiquantification of PC protein and is a streptavidin-probed blot in which larger amounts (20 or 40 μg) of whole-cell protein were added to the lanes containing human islet samples than were added to the lanes containing rodent islet samples. Lanes 1–4 contained the human islets and lanes 7 and 8 contained the rat and mouse islets shown in the top panel. Lanes 5 and 6 contained human islet samples homogenized and boiled in SDS gel sample buffer on the day of receipt and analyzed 1 month and 1 week later, respectively; and lane 9 contained rat islets stored as a frozen homogenate 3 months before analysis. Densitometric quantification of the PC band indicated that the amount of PC protein/μg islet cell protein was 2–10% of the average of the amounts of PC in the three rodent lanes.
FIGURE 3.

Low level of PC in human islets cannot be explained by exquisite instability of the human PC protein because the PC protein is stable in human liver. Upper panel, streptavidin-probed blot with 15 μg of cell protein/lane. Human liver (Hum Lvr) was stored frozen for 7 months before analysis. Human islets 24 and 31 were snap-frozen and stored 8–10 years, and islets U2 and U3 were cultured on 1 day and placed in gel loading buffer the same day and then analyzed at <4 weeks (U2) or <2 weeks (U3) or snap-frozen right after isolation and put in loading buffer the same day and analyzed 5 days later (U4). The density of the PCC/methylcrotonyl-CoA carboxylase (MCC) bands is relatively the same across the lanes. The membrane was stripped of streptavidin and reprobed with anti-β-actin antibody to show relatively equal loading of total cell protein across lanes. Lower panel, low PC protein in fresh cultured human pancreatic islets compared with rat islets, rat liver, or human liver. This panel shows a streptavidin-probed blot with 15 μg of whole-cell protein/lane, except for lane 8 where the protein equaled 4 μg. Human islet samples in lanes 1–4 were maintained in tissue culture medium for 2 or 24 h prior to homogenization. Rat heart is shown as a tissue in which the level of PC is low.
Propionyl-CoA Carboxylase Is Not Low in Human Islets
An excellent control for PC is propionyl-CoA carboxylase (PCC), which like PC is a biotin-containing enzyme and catalyzes a reaction similar to PC. The average PCC enzyme activity from all samples of human islets in which PCC was measured was similar to that in the rat islets (Table 1). (The PCC values in INS-1 832/13 cells were much lower than in human and rat islets.) In addition, the average of the same sample human islet PCC values in human islets with the highest quartile of PC values, when measured, was similar to the PCC values of rat pancreatic islets measured in the same assay batch (Table 2).
As a biotin-containing enzyme, PCC protein, like PC protein, can be visualized with streptavidin on Western blots. PCC protein was not low in human islets compared with rat and mouse islets (Fig. 2) and compared with rat liver and human liver (Fig. 3). This suggests that the lower PC values in human islets were specific for PC and not due to a generalized decreased expression or stability of biotin-containing carboxylases in human islets compared with islets of rats or mice.
Low ATP Citrate Lyase and Protein in Human Islets
The enzyme activity of ATP citrate lyase was 75 and 77% lower in human islets than in rat islets and the INS-1 832/13 line (Table 3), respectively, which was proportionately not as low as PC (Table 1).
TABLE 3.
Activities of various enzymes in human islets compared with rat islets or INS-1 832/13 cells
Results are the mean ± S.E. of the number of samples from individual donors or batches of rat islets or individual plates of INS-1 832/13 cells studied and shown in parentheses. The mean ± S.E. BMI and age of the human islet donors whose islets were used for the ATP citrate lyase measurements were 32.4 ± 2.6 kg/m2 and 48.1 ± 3.6 years.
| Enzyme | Enzyme activity |
||
|---|---|---|---|
| Human islets | Rat islets | INS-1 832/13 | |
| nmol product/min/mg protein | |||
| ATP citrate lyasea | 24 ± 1.9 (21)d | 96 ± 9.0 (13) | 104 ± 3.5 (31) |
| mGPDc | 29 ± 2.2 (16) | 28 ± 1.5 (7) | 43 ± 2.8 (9) |
| Cytosolic ME (ME1)a | 34 ± 3.0 (16) | 32 ± 2.0 (6) | 38 ± 4.2 (8) |
| Aspartate aminotransferasea,b | 595 ± 32 (7) | 778 ± 116 (10) | 528 ± 32 (9) |
| NADP isocitrate dehydrogenasea,b | 208 ± 20 (12) | 235 ± 30 (6) | 198 ± 19 (10) |
| Glutamate dehydrogenasec | 96 ± 7.6 (8) | 129 ± 25 (6) | 99 ± 7.7 (10) |
| Malate dehydrogenasea,b | 7000 ± 800 (7) | 16,300 ± 3,300 (9) | 6900 ± 900 (8) |
| Pyruvate dehydrogenasec | 15.1 ± 1.7 (10) | 14.2 ± 1.3 (8) | 3.7 ± 0.2 (12) |
a Enzyme rates are expressed per mg of protein in the whole-cell homogenate supernatant fraction. Homogenate supernatant fractions were prepared so that mitochondria would be ruptured.
b Thus, in the case of isoforms of the three enzymes that are present in both the mitochondrial matrix and the cytosol, the values shown represent the sum of both activities.
c Enzyme rates are expressed per mg of protein of whole-cell homogenate protein.
d p is < 0.001 versus same assay rat islet and INS-1 832/13 cell values.
The low ATP citrate lyase was confirmed with immunoblots with anti-ATP citrate lyase antibody that showed ATP citrate lyase protein was low in human islets relative to rat islets and INS-1 832/13 cells (Fig. 4). The average relative density per μg of whole-cell protein/lane of the ATP citrate lyase bands was 42 ± 7% (4) of the same band of the rat islets (100 ± 10% (4)) (means ± S.E. (N)) (p < 0.01) (lower panel of Fig. 4).
FIGURE 4.

Lower level of ATP citrate lyase protein in human islets than in rat islets. Top panel, immunoblot with 15 μg of whole-cell protein in each lane. The actin bands show equal loading of protein across the lanes. Lower panel, immunoblot with 15 μg of whole-cell protein/lane in 1st to 6th lanes. 7th to 9th lanes (from left) had 12, 11, and 9 μg of protein/lane, respectively. The relative densities of each ATP citrate lyase (ATPCL) band are shown at the bottom of the band without correction for the lower amounts of protein in the 7th to 9th lanes that contained rat islet protein.
Enzymes Not Decreased in Human Islets
Mitochondrial glycerol phosphate dehydrogenase (mGPD) is expressed at a very high level in beta cells of the pancreatic islets of rats (31, 43, 44), mice (45), and humans (Table 3) (25, 46, 47) relative to most tissues of the body. Thus, the level of mGPD serves as a good control for other islet mitochondrial enzymes. If human islets were less pure or of lower quality than rodent islets, the level of mGPD in human islets might be expected to be lower than in rodent islets. The level of mGPD in the human islets was as high as in the rat islets (Table 3) indicating human islets were as pure and of good quality as the rat islets. The level of mGPD in both human and rat islets was 33% lower than in INS-1 832/13 cells most likely because the INS-1 832/13 cells are pure beta cells, whereas islets contain non-beta endocrine cells, as well as connective tissue cells, in addition to beta cells.
The activities of cytosolic malic enzyme (ME1) (EC 1.1.1.40), aspartate aminotransferase, NADP isocitrate dehydrogenase, glutamate dehydrogenase, the pyruvate dehydrogenase complex (PDC), and malate dehydrogenase in human islets were not significantly different from those in rat islets and/or the INS-1 832/13 cell line (Table 3). Immunoblots showed that the levels of PDC E2 protein and α-ketoglutarate dehydrogenase complex E2 protein (Fig. 5), as well as glutamate dehydrogenase protein and acetyl-CoA acetyltransferases 1 and 2 proteins (Fig. 5), were also not decreased in human islets. The activity of the pyruvate dehydrogenase complex was lower in INS-1 832/13 cells than in human and rat islets (Table 3), and this was confirmed with an immunoblot that showed the density of the PDC E1α protein, the rate-limiting enzyme of the PDC, in INS-1 832/13 cells averaged 38% that in human islets as judged by densitometry measurements (Fig. 5). The average human islet and INS-1 832/13 malate dehydrogenase activities were lower than the average rat islet malate dehydrogenase activity (Table 2). Although the measurements of PC and ATP citrate lyase activities were always made on the freshest possible samples, it was logistically necessary to measure activities of some of the enzymes in human islets after several days or weeks of frozen storage of islet homogenates. Because the malate dehydrogenase measurements in human islets fell into this category, the human islet malate dehydrogenase activity represents the minimal true value. Malate dehydrogenase activity is extremely high in any of the tissues compared with the activities of other enzymes (Table 3), such that differences in the average malate dehydrogenase activities may not cause significantly different rates of intermediary metabolism among the various tissues. We recently showed that mitochondrial malic enzyme ME2 is present in human islets and its levels of enzyme activity and protein are similar to those in the islets of rats or mice or the INS-1 832/13 cell line (48).
FIGURE 5.

Levels of pyruvate dehydrogenase complex E1α and E2 proteins, α-ketoglutarate dehydrogenase complex E2 protein, glutamate dehydrogenase protein, and acetyl-CoA acetyltransferases 1 and 2 proteins in human islets are comparable with or higher in human islets than in rat islets or INS-1 832/13 cells. A, levels of PDC E1α protein in human and rat islets are higher than in INS-1832/13 cells. Immunoblot is shown with 15 μg of protein of whole-cell protein/lane probed with anti-PDC E1α antibody and stripped of antibody and reprobed with anti-β-actin antibody to show relative loading of protein across lanes. B, top panel, immunoblot with 20 μg of whole-cell protein/lane. It was probed with affinity-purified primary biliary cirrhosis (PBC) IgG at a 1:20,000 dilution that reacts against the PDC and α-ketoglutarate dehydrogenase complex (KDC) E2 proteins. Lower panel, immunoblot with 5 μg of whole-cell protein/lane probed with the primary biliary cirrhosis IgG at a dilution of 1:30,000 and reprobed with anti-β-actin antibody to indicate the relative total cell protein levels across the lanes. C, two immunoblots. Membranes were probed with anti-glutamate dehydrogenase (GluDH) antibody, stripped of antibody, and reprobed with anti-β-actin antibody to show relative loading of protein across lanes. Lanes in both panels contained 15 μg of whole-cell protein/lane except 3rd lane from left in the upper panel contained 13 μg of protein/lane. D, bottom panels, immunoblots with 15 μg of whole-cell protein/lane (ACAT1, mitochondrial acetyltransferase; ACAT2, cytosolic acetyltransferase).
Low Relative Rate of Pyruvate Carboxylation in Human Islets Versus Rat Islets
The 14CO2 ratios method was used to compare the fractions of glucose-derived pyruvate that enter the citric acid cycle by carboxylation and decarboxylation in human pancreatic islets versus in rat pancreatic islets. If any pyruvate enters mitochondrial metabolism through PC, the pyruvate 14CO2 ratio will be lower than the acetate 14CO2 ratio, and if pyruvate is metabolized exclusively through the pyruvate dehydrogenase complex, the two ratios will be identical (14–16, 37). In view of the lower amount of amount of PC in human islets compared with rodent islets, the expected finding is a lower relative fraction of pyruvate carboxylation in human islets than in the rat islets, and this is what we observed. The acetate 14CO2 ratio was much higher than the pyruvate 14CO2 ratio in the rat islets, whereas in human islets the two ratios were very close to one another (Table 4). Thus, the data show that although both human and rat pancreatic islets metabolize pyruvate via both carboxylation and decarboxylation, the percentage of pyruvate carboxylated compared with the total pyruvate metabolized by carboxylation plus decarboxylation is 70–80% lower in human islets than in rat islets (46% versus 14% assuming F = 0.8 and 55% versus 17% assuming F = 1 of total (de)carboxylation (Table 4)).
Small human islets are reported to be superior with respect to insulin secretion after transplantation than human islets of average size (42). The fraction of pyruvate carboxylated compared with that decarboxylated was even lower in an additional two batches of human small islets studied (data not shown).
Islet PC mRNA Levels Relative to Liver PC mRNA Levels Are Much Lower in the Human
In the rat the activity and protein of PC in the islet are similar to those in the liver (Fig. 3) (4, 9–11). To see whether the low level of PC in human islets might be due to lower PC gene transcription than in rat islets, the ratio of PC mRNA to the mRNA levels that encode six other metabolic enzymes were determined and expressed relative to these same ratios in liver of the same species. Table 5 shows that, even though the integrities of the human islet and rat liver RNA samples were superior to those of the rat islet RNA and human liver RNA samples (see under “Experimental Procedures”), which are combinations that could have produced higher relative ratios for human islets, the average of these ratios in rat islets was 6.2 times their average in human islets (range 3.8–10.5). This suggests that the low level of PC in human islets is a result of a low level of transcription of the PC gene.
Low PC in Human Islets Is Intrinsic to the Islets
Our surprising observation of low PC in human islets demands that we eliminate all possible reasons to explain why the low PC could be an artifact of islet handling or donor conditions even though an artifact would seem unlikely because, as shown in Table 6, glucose-stimulated insulin release in these islets is robust.
TABLE 6.
The magnitude of glucose-stimulated insulin release in human islets is similar to rat islets and β-hydroxybutyrate potentiates glucose-stimulated insulin release
As described under “Experimental Procedures,” islets were incubated with a submaximal stimulatory concentration of glucose (5.6 mm) with or without β-hydroxybutyrate (HB) for 1 h. Stimulation with 16.7 mm glucose, which provides a near maximal insulin release, is shown as a positive control. Results are from up to six experiments with 5–6 replicates for each condition in each experiment with islet preparations from six human donors and are the mean ± S.E. with the number of replicates in parentheses. The mean ± S.E. BMI and age of the human islet donors whose islets were used for these measurements were 28 ± 2.4 kg/m2 and 49.8 ± 4.3 years. Insulin release from up to 6 batches of rat islets with 6–12 replicates for each condition are shown to demonstrate that the magnitude of glucose-induced insulin release from human islets is similar to that from rat islets. Insulin release is expressed in microunits of insulin/μg islet protein/1 h.
| Secretagogue | Insulin release |
|
|---|---|---|
| Human islets | Rat islets | |
| No addition | 16 ± 1 (36) | 12 ± 0.5 (36) |
| Glucose (5.6 mm) | 60 ± 4 (36)a | 57 ± 4 (24)a |
| Glucose (5.6 mm) + HB (5 mm) | 128 ± 8 (36)b | 102 ± 12 (33)b |
| Glucose (5.6 mm) + HB (1 mm) | 91 ± 8 (18)c | |
| HB (5 mm) | 21 ± 3 (12) | 30 ± 2 (37) |
| Glucose (16.7 mm) | 263 ± 23 (33)a | 273 ± 25 (48)a |
a p < 0.001 is versus no addition.
b p < 0.001 is versus glucose (5.6 mm).
c p < 0.002 is versus glucose (5.6 mm).
Islet Donor Conditions
The low PC is not likely explained by the long term conditions or short term medical management of the islet donors because there were numerous different causes of death, and some died after an illness, and some died suddenly. Because obesity is diabetogenic by causing insulin resistance and can directly influence the condition of an individual's islet beta cells, the possible correlation of BMIs of the islet donors with PC activity was considered. Also Pietilainen et al. (49) recently reported down-regulation of PC mRNA transcripts in adipose tissue of the obese twin of twin pairs discordant for obesity. In our study, the body mass index of the human donors ranged from 20 to 51 kg/m2, but islet PC activity showed no relationship with body mass index, as judged from linear regression analysis (correlation coefficient r = 0.1; see supplemental Fig. 1). (Indeed, the person with a BMI of 51 kg/m2 had one of the highest islet PC activities (10.1 nmol of CO2 fixed per min/mg of protein).) There was also no correlation of PC activity or PC protein with age or gender of the donors.
PC Protein Stability
The lower PC enzyme activity and PC protein in human pancreatic islets compared with rodent islets and clonal cell lines cannot be explained by rapid degradation of the human PC protein during the islet isolation procedure or more rapid loss of PC activity in human islets (compared with rodent islets or INS-1 832/13 cells) during frozen storage of tissue. We did notice that PC enzyme activity in human islets or rat islets and other tissues decreased extensively with repeated freezing and thawing of frozen cell homogenates; therefore, we have reported measurements of PC enzyme activity on only freshly prepared homogenates of tissue that had either not been frozen or on the first thaw of a homogenate stored for about 1 day. However, repeated freezing and thawing of tissue homogenates and length of frozen storage of the islets and other tissues did not affect the level of PC protein.
The PC protein was not low in human liver after 7 months of frozen storage (Fig. 3). However, the PC level of protein in human islets analyzed by streptavidin blotting after intervals of a few hours to 30 days and even up to 8–10 years of frozen storage was extremely low, whereas the level of the PC protein in rat islets and mouse islets stored frozen for similar lengths of time and also for up to 10 years was not low (Fig. 2). In the rat, the level of PC in islets is similar to the PC levels in liver or kidney (Fig. 3) (4), whereas in the human, the level of the PC protein is lower in the islet than in liver (Fig. 3).
Islet Purity, Composition, and Viability
To explain the low PC in human islets on the basis of low islet purity or low viability, the purity and/or viability would need to equal 10–15%, an implausibly low number. In addition, as mentioned above, the activity of the mitochondrial enzyme mGPD, which is as highly expressed in human islets as in rat islets and mouse islets (31, 43–47) and is even more beta cell-specific than PC, was as high in the human islets as in the rat islets (Table 3). This indicates the purity and percentage of beta cells of the human islets were similar to those of the rat islets. In addition, the relative rate of pyruvate carboxylation was low in intact human islets compared with intact rat islets (Table 4). For these experiments, islets were selected manually under a dissecting microscope, and therefore, purity should have been excellent for both human and rat islets. Regarding the cell composition of human islet preparations, recent analyses by experts in this field indicate that the percentage of beta cells in human islets is similar to rodent islets (50, 51). Furthermore, the low human islet PC cannot be explained by poor islet quality. Some of the highest quality human islets as judged by high ATP/ADP ratios and high ratios of glucose-stimulated insulin release to unstimulated insulin release possessed some of the lowest PC activities (see supplemental material).
Is There Down-regulation of PC and ATP Citrate Islets during Preparation of Human Islets?
If low PC and ATP citrate lyase is not a characteristic of human islets in vivo, then down-regulation of these enzyme during the preparation and tissue culture of the islets would seem the most likely explanation for the low levels of these enzymes. However, if this is the case, then it appears that isolated human islets operate normally with low PC and low ATP citrate lyase because they secrete insulin as well as rat islets (Table 6) (13, 27) and metabolize glucose to similar extents (13–17, 52). PC activity did not change in human islets maintained in RPMI 1640 medium containing 5 mm glucose for 2 or 24 h, identical to the medium used for rat islets, which showed high PC levels instead of CMRL medium or PIM medium, which also contain 5 mm glucose.
Our quantitative PCR data (Table 5) and our mRNA microarray data (25), as well as microarray data found in databases (53, 54),4 show that PC mRNA is low in comparison with other mRNAs in isolated human islets. It is likely the PC mRNA is low in human islets before the islet isolation procedure has begun. Weir5 has noticed that the level of PC mRNA is very low compared with many other mRNAs in beta cells of islets of human pancreas analyzed in situ by laser capture microdissection (which, of course, does not involve islet isolation). Thus, it is likely that the cause of the low PC in the human beta cell is due to a low rate of transcription of the PC gene in vivo.
mGPD is regulated similarly to PC in rodent islets and clonal cell lines. Its transcription is influenced by some of the same transcription factors that influence the transcription of PC (8, 55–57), and both PC and mGPD are down-regulated in human islets isolated from subjects with type 2 diabetes (25), similarly to islets isolated from rodent models of type 2 diabetes (43, 58–60, 62). Because the level of mGPD is as high in normal human islets as in normal rat islets (Table 3), this is consistent with the idea that the low PC in human islets is specific for human islets.
SCOT Is Plentiful in Human Islets
The level of SCOT protein in human islets was much higher than in the INS-1 832/13 cell line and about twice as high as in rat islets and mouse islets as judged from immunoblot analysis (Fig. 6).
FIGURE 6.

Level of SCOT protein is higher in human islets than in rat islets and INS-1 832/13 cells. Immunoblots were probed with anti-SCOT antibody. Top panel, 13 μg (lane 6) or 20 μg of whole-cell protein/lane (other lanes). (Hum is human islets.) Middle panel, immunoblot with 15 μg of whole-cell protein/lane. Bottom panel, 10 μg of whole-cell protein. The densities of the SCOT protein bands in each panel are expressed relative to the bands within the same panel. Membranes were stripped of antibody and reprobed with anti-β-actin antibody to discern relatively equal loading of protein across the lanes. In the bottom panel, due to the lower protein loaded in the lane of mouse islets, densities of the actin bands are also shown. The ratio of the relative density of the SCOT band to the actin band in the mouse lane shows the level of SCOT in mouse islets is about one-half the level in human islets, similar to in rat islets.
Acetoacetyl-CoA Synthetase Is Plentiful in Human Islets
The level of acetoacetyl-CoA synthetase protein in human islets and INS-1 832/13 cells was much higher than in rat islets and mouse islets as judged by immunoblot analysis (Fig. 7).
FIGURE 7.

Higher levels of acetoacetyl-CoA synthetase (AACS) protein in human pancreatic islets than in rat and mouse islets. Two immunoblots with 15 μg of whole-cell protein/lane. The level of the enzyme (acetoacetyl-CoA synthetase) is much higher in human islets and INS-1 832/13 cells than in Sprague-Dawley rat islets and islets from the NSA (CF-1) mouse and the C57BL/6 (B6) mouse. Membranes were stripped of antibody and reprobed with anti-β-actin antibody to discern equal loading of protein across the lanes. A human islet lane that showed extremely dark staining was deleted from both panels.
Islet Thiolases
Previous immunoblot analysis and estimates of specific mRNAs showed that pancreatic islets possess thiolases (26) that can reversibly convert acetyl-CoA to acetoacetyl-CoA. The levels of the proteins of the mitochondrial thiolase, acetyl-CoA acetyltransferase 1 (ACAT1), and the cytosolic thiolase, acetyl-CoA acetyltransferase 2 (ACAT2), were about the same in human islets as in rat pancreatic islets, liver, and kidney (Fig. 5).
Fatty-acid Synthase
The level of fatty-acid synthase protein in human islets was higher than in rat islets and equal to that in INS-1 832/13 cells also as judged by immunoblot analysis (Fig. 8).
FIGURE 8.

High level of fatty-acid synthase protein in human islets. Immunoblot, 15 μg of whole-cell protein/lane. The level of fatty-acid synthase (FAS) in human islets is as high as in INS-1 832/13 cells and much higher than in rat islets. The level of fatty-acid synthase in rat islets in this same blot was not visible, and the lane with rat islet protein is not shown.
Higher Acetoacetate and Lower Malate Levels in Glucose-stimulated Human Islets than in Rat Islets
Human islets and rat islets were incubated with a concentration of glucose that stimulates insulin secretion for 30 min, a time interval that includes the first phase of insulin secretion plus the initial part of the second phase of insulin secretion, which is the phase associated with metabolism of insulin secretagogues. Acetoacetate (Fig. 9) increased to a higher level in the human islets than in the rat islets, and malate (Fig. 10) increased to a lower level in the human islets than in the rat islets as judged by alkali-enhanced fluorescence assays.
FIGURE 9.

Higher glucose-stimulated acetoacetate in glucose-stimulated human islets than in rat islets. Islets were maintained in tissue culture medium containing 5 mm glucose for 4 h (some human) to 24 h (some human and all rat), washed, and then incubated in Krebs-Ringer bicarbonate buffer, pH 7.35, in the presence or absence of 16.7 mm glucose for 30 min. The figure shows the mean ± S.E. acetoacetate levels from eight separate experiments with 3–4 replicates of 100 rat islets for each condition (left side of figure) and 4–6 replicates of 100–200 islets for each condition from six separate experiments with islets from human donors (P11, C1, UM1, 258, P14, and P15) (middle of figure). Because of the high background fluorescence in the experiments with these six preparations of human islets that were shipped and maintained in media (CMRL or PIM) that contain NAD and NADP (see “Results”), which increased measured acetoacetate values to unrealistic high values, the no addition value for these experiments was assigned zero, and the glucose-stimulated increase in acetoacetate above the control is shown. Results of individual experiments with islets from four additional human donors are shown on the right side of the figure. For these experiments, to lower the background fluorescence, islets were maintained in RPMI 1640 tissue culture medium (modified to contain 5 mm glucose) for 24 h before incubation in the presence or absence of 16.7 mm glucose for 30 min as described above. a, p < 0.01, or b, p < 0.001 glucose-stimulated human islets versus glucose-stimulated rat islets. The mean ± S.E. BMI and age of the human islets donors whose islets were used for these measurements were 26.2 ± 1.6 kg/m2 and 41.7 ± 5.3 years.
FIGURE 10.

Lower glucose-stimulated malate in human islets than in rat islets. Malate was measured in the extracts from the experiments described in Fig. 9. Results are the mean ± S.E. of three experiments with rat islets and eight experiments with islets from human islets donors. a, p = 0.05 glucose-stimulated human islets versus glucose-stimulated rat islets.
In six samples of human islets maintained in CMRL or PIM medium prior to being washed and incubated in Krebs-Ringer bicarbonate buffer for 30 min, the fluorescence was extremely high. CMRL and PIM media contain NAD and NADP, which increased the fluorescence background and thus the measured acetoacetate levels to unrealistically high values in the alkali-enhanced fluorescence assay for acetoacetate. (These pyridine nucleotides must adhere tightly to the islets as they cannot be removed by simple washing.) For the experiments with these islet preparations from six donors, the unstimulated measured acetoacetate levels were subtracted from the glucose-stimulated measured acetoacetate values, and the averages of the individual differences between the stimulated and unstimulated acetoacetate values are shown in the middle of Fig. 9. This average was 3.5–4 times higher in human islets than in rat islets.
In addition, islets from four additional donors were maintained in RPMI 1640 medium containing 5 mm glucose for 24 h before they were washed and incubated in Krebs-Ringer bicarbonate buffer for 30 min. This lowered the background fluorescence to the low values seen with incubating rat islets in the same culture medium prior to the experiment. These experiments shown on the right side of Fig. 9 also showed that glucose stimulated acetoacetate to 3.5–4 times higher levels in human islets than in rodent islets; in addition, in islets from some donors the unstimulated acetoacetate levels were significantly higher than in unstimulated rat islets. Fig. 10 shows that malate, an immediate metabolite of oxaloacetate the product of the PC reaction, was about 50% lower in glucose-stimulated human islets than in similarly stimulated rat islets.
β-Hydroxybutyrate Augments Insulin Release in Human Islets, and the Magnitude of Glucose-stimulated Insulin Release Is Similar to That from Rat Islets
Table 6 shows that β-hydroxybutyrate, the redox partner of acetoacetate, potentiates insulin release from human islets in the presence of a physiological concentration of glucose (5.6 mm) that provides a submaximal stimulus of insulin secretion. Table 6 also shows that human islets stimulated with 5.6 mm glucose or 16.7 mm glucose, which provides a near maximal insulin stimulus, can release the same amount of insulin as rat islets of similar average size and total cellular protein.
DISCUSSION
Pathways That Use Pyruvate Carboxylase and ATP Citrate Lyase or SCOT and Acetoacetyl-CoA Synthetase in Beta Cells
The importance of PC and ATP citrate lyase for insulin secretion in rodent beta cells is underscored by their high levels in rodent islets compared with many other body tissues. As mentioned above, the level of PC in rat islets is known to be relatively high (4, 9–11). In addition, we have found that the activity of ATP citrate lyase in rat islets is >10 times higher than in rat liver and kidney.3 Also Berne (63) previously reported that the activity of ATP citrate lyase in islets of the New England obese mouse is 4–7 times higher than in liver or kidney. If high levels of PC and ATP citrate lyase are important for insulin release, then it must be explained how human islets with low levels of these two enzymes (Tables 1–3 and Figs. 2–4) achieve the same glucose-stimulated insulin release as rat islets (Table 6) that have high levels of these enzymes.
In the beta cell, as in other cells containing PC, PC can catalyze the unidirectional carboxylation of aerobic-glycolysis-derived pyruvate to form oxaloacetate in the mitochondrial matrix. The oxaloacetate can either be converted to malate, which can be exported from the mitochondria to the cytosol to participate in the pyruvate malate shuttle (3, 4), or oxaloacetate can combine with acetyl-CoA derived from the decarboxylation of pyruvate catalyzed by the pyruvate dehydrogenase complex to form citrate. Citrate, formed by the condensation of oxaloacetate and acetyl-CoA in the citrate synthase reaction, can be exported from the mitochondria to the cytosol where ATP citrate lyase converts the citrate into oxaloacetate and acetyl-CoA. The cytosolic oxaloacetate can be used in the citrate pyruvate shuttle (3, 5, 6), and the acetyl-CoA can be used for short chain acyl-CoA synthesis and lipid synthesis (Fig. 1) (3, 26, 29). However, as we suggest below, there is evidence for another pathway in islets and beta cell lines that can accomplish a similar result in respect to delivering precursors of short chain acyl-CoAs to the cytosol.
Enzyme levels and metabolic and insulin release studies (27–29, 40) suggest an alternative pathway (26) for exporting mitochondrially synthesized products to the cytosol in rodent islets and insulin cell lines and, especially, human islets (this study). In this pathway acetyl-CoA formed in the pyruvate dehydrogenase complex reaction can be converted to acetoacetyl-CoA catalyzed by mitochondrial thiolases (ACAT1 or ACAA2) followed by the reaction of acetoacetyl-CoA plus succinate to form succinyl-CoA plus acetoacetate catalyzed by SCOT. In this scheme, acetoacetyl-CoA and acetoacetate are consumed, and succinate is regenerated in a cycle catalyzed by succinyl-CoA synthetases. The acetoacetate can be exported from the mitochondria to the cytosol where acetoacetyl-CoA synthetase can catalyze the first step in a series of reactions that form short chain acyl-CoAs and lipids in the cytosol (Fig. 1).
Low Pyruvate Carboxylation and ATP Citrate Lyase and a More Active Alternative Pathway Involving Acetoacetate in Human Islets
The “Results” provide evidence to support the idea that the low levels of PC and ATP citrate lyase in human islets compared with rodent islets and clonal rodent beta cell lines are intrinsic properties of human islets and suggest there are important quantitative differences between humans and rodents in mitochondrial biosynthesis and cytosolic pathways used in stimulating insulin secretion. In rodent beta cells, there is no question that PC has a role in insulin secretion. PC has been shown to be responsible for the high rate of carboxylation of pyruvate in rat islets (3, 11, 14–16) and to be involved in cycling of pyruvate in clonal rodent insulin cell lines (17–20), and knockdown of PC inhibits insulin release from clonal insulin cell lines (22) and from rat or mouse islets (23).
The low level of PC in human islets compared with rodent islets and clonal insulinoma cells (Tables 1 and 2 and Figs. 2 and 3) and the low rate of pyruvate carboxylation relative to pyruvate decarboxylation in comparison with rat islets (Table 4) suggest that flux through the PC reaction, although present in the human beta cell, occurs at a lower rate than in rodent beta cells. ATP citrate lyase activity (Table 3) and protein (Fig. 4) were also found to be low in human islets. Might there be pathways of biosynthesis in addition to those involving PC and ATP citrate lyase that are more active in the human beta cell relative to rodent beta cells? In this respect, the level of SCOT in human islets appears to be very high compared with rodent islets (Fig. 6). As described above, SCOT can catalyze the formation of acetoacetate from glucose-derived carbon (Fig. 1), and indeed, acetoacetate increased to 3.5–4-fold higher levels in human islets after 30 min of incubation with glucose than in similarly incubated rat islets (Fig. 9). In contrast, malate, which is an immediate metabolite of oxaloacetate the product of the PC reaction, increased to a lower level in glucose-stimulated human islets than in glucose-stimulated rat islets (Fig. 10). The lower increase in malate in human islets is also consistent with the lower level of PC in human islets.
Short chain acyl-CoAs by themselves, as well as acting as precursors for long chain acyl-CoAs, have been proposed to have a role in supporting insulin secretion (reviewed in Refs. 3, 64). We recently accumulated a large amount of circumstantial evidence from metabolic and insulin release studies that suggests acetoacetate can act as a carrier of carbon from mitochondria to the cytosol for the synthesis of short chain acyl-CoAs and lipid in beta cells (26–29). Knockdown of either SCOT (65) or acetoacetyl-CoA synthetase (26) in the INS-1 832/13 cell line lowers glucose-stimulated insulin release. In addition, leucine alone, as well as hydroxybutyrate or α-ketoisocaproic acid, which each can be metabolized to acetoacetate, and acetoacetate itself, in combination with other metabolites, stimulate insulin release in INS-1 832/13 cells (27, 28). β-Hydroxybutyrate also potentiates insulin release in the presence of a physiological concentration of glucose in human islets (Table 6) and in rat pancreatic islets as well (27, 66, 67). PC is not directly involved in the metabolism of β-hydroxybutyrate (Fig. 1). Along these lines, it is noteworthy that mitochondria from rat heart, which is a tissue with very low PC (4, 68, 69), when provided with pyruvate, the end product of aerobic glycolysis, synthesize a large amount of acetoacetate (70). It is also notable that in single mouse islets stimulated with glucose and analyzed by capillary LC-MS/MS, the signal for succinate, a substrate of the SCOT reaction, increased 8.3-fold and the signal for acetyl-CoA, a direct precursor of acetoacetyl-CoA, increased 7.7-fold (71). Another fact that supports the idea of an alternate pathway to acetoacetate in addition to a pathway to citrate is that acetoacetyl-CoA, at physiological levels, is a competitive inhibitor of citrate synthase (Fig. 1) in respect to acetyl-CoA, making more acetyl-CoA available for synthesis of acetoacetyl-CoA itself (72). In line with the idea that the human beta cell might preferentially use a pathway in which the SCOT reaction forms acetoacetate for export to the extramitochondrial space where it is converted into acetoacetyl-CoA, which then can be converted to other short chain acyl-CoAs beginning with the acetoacetyl-CoA synthetase reaction (Fig. 1), the level of acetoacetyl-CoA synthetase in human islets is much higher than in rat islets and mouse islets (Fig. 7).
Although there is evidence for metabolic pathways that utilize ATP citrate lyase in rodent islets and rodent insulin cell lines (3, 5, 6), it is noteworthy that the Newgard laboratory studying INS-1 832/13 cells and rat islets (73) and our laboratory studying INS-1 832/13 cells (26) have shown that severely lowering ATP citrate lyase activity with siRNA technology does not inhibit glucose-stimulated insulin release. The Prentki laboratory did achieve inhibition of glucose-stimulated insulin release with knockdown of the enzyme in the INS-1 832/13 cell line (61). The results from the first two studies suggest a pathway redundant with a pathway involving ATP citrate lyase in beta cells.
In contrast to the situation with glucose-stimulated insulin release, BCH-stimulated insulin release was significantly inhibited in our INS-1 832/13-derived cells lines with severely knocked down (>87%) ATP citrate lyase (28). With the very low ATP citrate lyase in these cells, the formation of cytosolic acetyl-CoA from the glutamate-derived citrate to produce other cytosolic short chain acyl-CoAs would be almost nonexistent leaving any short chain acyl-CoA formation in the cytosol to come from acetoacetate exported from the mitochondria (see Fig. 1 to view the acetoacetate and citrate pathways). BCH is a nonmetabolizable leucine analogue that can allosterically activate glutamate dehydrogenase and enhance metabolism of endogenous glutamate to provide carbon to part of the citric acid cycle. Unlike leucine (which also can allosterically activate glutamate dehydrogenase) or glucose, BCH cannot be metabolized to acetyl-CoA and acetoacetyl-CoA to produce acetoacetate. We hypothesized that the inhibited BCH-stimulated insulin release was because short chain acyl-CoA production from glutamate carbon through the acetoacetate pathway was inadequate. Providing a source of acetoacetate by adding β-hydroxybutyrate or α-ketoisocaproate to these ATP citrate lyase-deficient cells raised BCH-stimulated insulin release to that in control INS-1 832/13 cells (28). This experiment also suggests that acetoacetate through the action of acetoacetyl-CoA synthetase can provide the short chain acyl-CoAs required for insulin release.
Conclusions
The pathway that requires SCOT and acetoacetyl-CoA synthetase for the export of acetoacetate from mitochondria to the cytosol to provide substrates for synthesis of short chain acyl-CoAs and lipid in the cytosol (Fig. 1) is present in rat islets and the INS-1 832/13 cell line (26–29). However, this pathway appears to be more active in human islets. It also appears that the pathway that requires PC and ATP citrate lyase is used relatively less (Fig. 1) in human islets than in rodent islets. Glucose acutely stimulates increases in the levels of various lipids in the INS-1 832/13 cell line (29). In addition, glucose carbon (29) and β-hydroxybutyrate carbon (27) are acutely incorporated into lipid in these same cells. In human islets, the level of fatty-acid synthase, which forms longer chain acyl-CoAs, appears to be very high (Fig. 8). The acetoacetate pathway could theoretically very effectively provide short chain acyl-CoAs for the synthesis of cytosolic long chain acyl-CoAs that have long been thought to act as signaling molecules for insulin exocytosis (64). The relative rate of pyruvate carboxylation in human islets, which is 20–30% the relative rate in rat islets (Table 4), should be adequate to support other pathways, including the pyruvate malate shuttle (4) and the pyruvate citrate shuttle (5, 6), which are also probably needed for insulin secretion.
Supplementary Material
Acknowledgment
We thank Tonya Zeczycki for helpful discussions.
This work was supported, in whole or in part, by National Institutes of Health Grant DK28348. This work was also supported by the Nowlin Family Trust of the Lutheran Community Foundation.

The on-line version of this article (available at http://www.jbc.org) contains supplemental Tables 1 and 2, Fig. 1, and Enzyme Assays.
M. J. MacDonald, unpublished observations.
Gordon Weir, personal communication.
- PC
- pyruvate carboxylase
- BCH
- 2-aminobicyclo[2,2,1]heptane-2-carboxylic acid
- mGPD
- mitochondrial glycerol phosphate dehydrogenase
- PCC
- propionyl-CoA carboxylase
- PDC
- pyruvate dehydrogenase complex
- SCOT
- succinyl-CoA:3-ketoacid-CoA transferase
- BMI
- body mass index.
REFERENCES
- 1. Henquin J. C., Dufrane D., Nenquin M. (2006) Diabetes 55, 3470–3477 [DOI] [PubMed] [Google Scholar]
- 2. Brunengraber H., Roe C. R. (2006) J. Inherit. Metab. Dis. 29, 327–331 [DOI] [PubMed] [Google Scholar]
- 3. MacDonald M. J., Fahien L. A., Brown L. J., Hasan N. M., Buss J. D., Kendrick M. A. (2005) Am. J. Physiol. Endocrinol. Metab. 288, E1–E15 [DOI] [PubMed] [Google Scholar]
- 4. MacDonald M. J. (1995) J. Biol. Chem. 270, 20051–20058 [PubMed] [Google Scholar]
- 5. Farfari S., Schulz V., Corkey B., Prentki M. (2000) Diabetes 49, 718–726 [DOI] [PubMed] [Google Scholar]
- 6. Flamez D., Berger V., Kruhøffer M., Orntoft T., Pipeleers D., Schuit F. C. (2002) Diabetes 51, 2018–2024 [DOI] [PubMed] [Google Scholar]
- 7. Newgard C. B., Lu D., Jensen M. V., Schissler J., Boucher A., Burgess S., Sherry A. D. (2002) Diabetes 51, S389–S393 [DOI] [PubMed] [Google Scholar]
- 8. Jitrapakdee S., Wutthisathapornchai A., Wallace J. C., MacDonald M. J. (2010) Diabetologia 53, 1019–1032 [DOI] [PMC free article] [PubMed] [Google Scholar]
- 9. Schuit F., De Vos A., Farfari S., Moens K., Pipeleers D., Brun T., Prentki M. (1997) J. Biol. Chem. 272, 18572–18579 [DOI] [PubMed] [Google Scholar]
- 10. Louis N. A., Witters L. A. (1992) J. Biol. Chem. 267, 2287–2293 [PubMed] [Google Scholar]
- 11. Brun T., Roche E., Kim K. H., Prentki M. (1993) J. Biol. Chem. 268, 18905–18911 [PubMed] [Google Scholar]
- 12. MacDonald M. J., McKenzie D. I., Walker T. M., Kaysen J. H. (1992) Horm. Metab. Res. 24, 158–160 [DOI] [PubMed] [Google Scholar]
- 13. MacDonald M. J., Kaysen J. H., Moran S. M., Pomije C. E. (1991) J. Biol. Chem. 266, 22392–22397 [PubMed] [Google Scholar]
- 14. MacDonald M. J. (1993) Arch. Biochem. Biophys. 300, 201–205 [DOI] [PubMed] [Google Scholar]
- 15. MacDonald M. J. (1993) Arch. Biochem. Biophys. 305, 205–214 [DOI] [PubMed] [Google Scholar]
- 16. MacDonald M. J. (1993) Metabolism 42, 1229–1231 [DOI] [PubMed] [Google Scholar]
- 17. Khan A., Ling Z. C., Landau B. R. (1996) J. Biol. Chem. 271, 2539–2542 [DOI] [PubMed] [Google Scholar]
- 18. Lu D., Mulder H., Zhao P., Burgess S. C., Jensen M. V., Kamzolova S., Newgard C. B., Sherry A. D. (2002) Proc. Natl. Acad. Sci. U.S.A. 99, 2708–2713 [DOI] [PMC free article] [PubMed] [Google Scholar]
- 19. Pongratz R. L., Kibbey R. G., Shulman G. I., Cline G. W. (2007) J. Biol. Chem. 282, 200–207 [DOI] [PubMed] [Google Scholar]
- 20. Simpson N. E., Khokhlova N., Oca-Cossio J. A., Constantinidis I. (2006) Diabetologia 49, 1338–1348 [DOI] [PubMed] [Google Scholar]
- 21. Li C., Nissim I., Chen P., Buettger C., Najafi H., Daikhin Y., Nissim I., Collins H. W., Yudkoff M., Stanley C. A., Matschinsky F. M. (2008) J. Biol. Chem. 283, 17238–17249 [DOI] [PMC free article] [PubMed] [Google Scholar]
- 22. Hasan N. M., Longacre M. J., Stoker S. W., Boonsaen T., Jitrapakdee S., Kendrick M. A., Wallace J. C., MacDonald M. J. (2008) J. Biol. Chem. 283, 28048–28059 [DOI] [PMC free article] [PubMed] [Google Scholar]
- 23. Xu J., Han J., Long Y. S., Epstein P. N., Liu Y. Q. (2008) Diabetologia 51, 2022–2030 [DOI] [PMC free article] [PubMed] [Google Scholar]
- 24. Jensen M. V., Joseph J. W., Ilkayeva O., Burgess S., Lu D., Ronnebaum S. M., Odegaard M., Becker T. C., Sherry A. D., Newgard C. B. (2006) J. Biol. Chem. 281, 22342–22351 [DOI] [PubMed] [Google Scholar]
- 25. MacDonald M. J., Longacre M. J., Langberg E. C., Tibell A., Kendrick M. A., Fukao T., Ostenson C. G. (2009) Diabetologia 52, 1087–1091 [DOI] [PMC free article] [PubMed] [Google Scholar]
- 26. MacDonald M. J., Smith A. D., 3rd, Hasan N. M., Sabat G., Fahien L. A. (2007) J. Biol. Chem. 282, 30596–30606 [DOI] [PubMed] [Google Scholar]
- 27. MacDonald M. J., Longacre M. J., Stoker S. W., Brown L. J., Hasan N. M., Kendrick M. A. (2008) Am. J. Physiol. Cell. Physiol. 294, C442–C450 [DOI] [PubMed] [Google Scholar]
- 28. Macdonald M. J., Hasan N. M., Longacre M. J. (2008) Biochim. Biophys. Acta 1780, 966–972 [DOI] [PMC free article] [PubMed] [Google Scholar]
- 29. MacDonald M. J., Dobrzyn A., Ntambi J., Stoker S. W. (2008) Arch. Biochem. Biophys. 470, 153–162 [DOI] [PMC free article] [PubMed] [Google Scholar]
- 30. Whitehouse S., Cooper R. H., Randle P. J. (1974) Biochem. J. 141, 761–774 [DOI] [PMC free article] [PubMed] [Google Scholar]
- 31. MacDonald M. J. (1981) J. Biol. Chem. 256, 8287–8290 [PubMed] [Google Scholar]
- 32. MacDonald M. J. (2002) Am. J. Physiol. Endocrinol. Metab. 283, E302–E310 [DOI] [PubMed] [Google Scholar]
- 33. MacDonald M. J., Marshall L. K. (2001) Mol. Cell. Biochem. 220, 117–125 [DOI] [PubMed] [Google Scholar]
- 34. MacDonald M. J. (1981) Endocrinology 108, 1899–1902 [DOI] [PubMed] [Google Scholar]
- 35. MacDonald M. J. (1982) Arch. Biochem. Biophys. 213, 643–649 [DOI] [PubMed] [Google Scholar]
- 36. Brown L. J., Longacre M. J., Hasan N. M., Kendrick M. A., Stoker S. W., Macdonald M. J. (2009) J. Biol. Chem. 284, 35359–35367 [DOI] [PMC free article] [PubMed] [Google Scholar]
- 37. Kelleher J. K., Bryan B. M., III (1985) Anal. Biochem. 151, 55–62 [DOI] [PubMed] [Google Scholar]
- 38. MacDonald M. J. (2003) Biochim. Biophys. Acta 1619, 77–88 [DOI] [PubMed] [Google Scholar]
- 39. Macdonald M. J. (2003) Metabolism 52, 993–998 [DOI] [PubMed] [Google Scholar]
- 40. MacDonald M. J. (2007) J. Biol. Chem. 282, 6043–6052 [DOI] [PubMed] [Google Scholar]
- 41. Schroeder A., Mueller O., Stocker S., Salowsky R., Leiber M., Gassmann M., Lightfoot S., Menzel W., Granzow M., Ragg T. (2006) BMC Mol. Biol. 7, 3. [DOI] [PMC free article] [PubMed] [Google Scholar]
- 42. Lehmann R., Zuellig R. A., Kugelmeier P., Baenninger P. B., Moritz W., Perren A., Clavien P. A., Weber M., Spinas G. A. (2007) Diabetes 56, 594–603 [DOI] [PubMed] [Google Scholar]
- 43. MacDonald M. J., Efendiæ S., Ostenson C. G. (1996) Diabetes 45, 886–890 [DOI] [PubMed] [Google Scholar]
- 44. MacDonald M. J., Tang J., Polonsky K. S. (1996) Diabetes 45, 1626–1630 [DOI] [PubMed] [Google Scholar]
- 45. Koza R. A., Kozak U. C., Brown L. J., Leiter E. H., MacDonald M. J., Kozak L. P. (1996) Arch. Biochem. Biophys. 336, 97–104 [DOI] [PubMed] [Google Scholar]
- 46. MacDonald M. J., Warner T. F., Pellett J. R. (1983) J. Clin. Endocrinol. Metab. 57, 662–664 [DOI] [PubMed] [Google Scholar]
- 47. MacDonald M. J., Warner T. F., Mertz R. J. (1990) Cancer Res. 50, 7203–7205 [PubMed] [Google Scholar]
- 48. MacDonald M. J., Longacre M. J., Kendrick M. A. (2009) Arch. Biochem. Biophys. 488, 100–104 [DOI] [PMC free article] [PubMed] [Google Scholar]
- 49. Pietiläinen K. H., Naukkarinen J., Rissanen A., Saharinen J., Ellonen P., Keränen H., Suomalainen A., Götz A., Suortti T., Yki-Järvinen H., Oresic M., Kaprio J., Peltonen L. (2008) PLoS Med. 5, e51. [DOI] [PMC free article] [PubMed] [Google Scholar]
- 50. Pisania A., Weir G. C., O'Neil J. J., Omer A., Tchipashvili V., Lei J., Colton C. K., Bonner-Weir S. (2010) Lab. Invest. 90, 1661–1675 [DOI] [PMC free article] [PubMed] [Google Scholar]
- 51. Kim A., Miller K., Jo J., Kilimnik G., Wojcik P., Hara M. (2009) Islets 1, 129–136 [DOI] [PMC free article] [PubMed] [Google Scholar]
- 52. De Vos A., Heimberg H., Quartier E., Huypens P., Bouwens L., Pipeleers D., Schuit F. (1995) J. Clin. Invest. 96, 2489–2495 [DOI] [PMC free article] [PubMed] [Google Scholar]
- 53. Zhang X., Odom D. T., Koo S. H., Conkright M. D., Canettieri G., Best J., Chen H., Jenner R., Herbolsheimer E., Jacobsen E., Kadam S., Ecker J. R., Emerson B., Hogenesch J. B., Unterman T., Young R. A., Montminy M. (2005) Proc. Natl. Acad. Sci. U.S.A. 102, 4459–4464 [DOI] [PMC free article] [PubMed] [Google Scholar]
- 54. Kutlu B., Kayali A. G., Jung S., Parnaud G., Baxter D., Glusman G., Goodman N., Behie L. A., Hayek A., Hood L. (2009) Physiol. Genomics 39, 72–81 [DOI] [PubMed] [Google Scholar]
- 55. Gong Q., Brown L. J., MacDonald M. J. (2000) J. Biol. Chem. 275, 38012–38021 [DOI] [PubMed] [Google Scholar]
- 56. Hasan N. M., MacDonald M. J. (2002) Gene 296, 221–234 [DOI] [PubMed] [Google Scholar]
- 57. Sunyakumthorn P., Boonsaen T., Boonsaeng V., Wallace J. C., Jitrapakdee S. (2005) Biochim. Biophys. Res. Commun. 329, 188–196 [DOI] [PubMed] [Google Scholar]
- 58. Ostenson C. G., Abdel-Halim S. M., Rasschaert J., Malaisse-Lagae F., Meuris S., Sener A., Efendic S., Malaisse W. J. (1993) Diabetologia 36, 722–726 [DOI] [PubMed] [Google Scholar]
- 59. Fernandez-Alvarez J., Conget I., Rasschaert J., Sener A., Gomis R., Malaisse W. J. (1994) Diabetologia 37, 177–181 [DOI] [PubMed] [Google Scholar]
- 60. Giroix M. H., Rasschaert J., Bailbe D., Leclercq-Meyer V., Sener A., Portha B., Malaisse W. J. (1991) Diabetes 40, 227–232 [DOI] [PubMed] [Google Scholar]
- 61. Guay C., Madiraju S. R., Aumais A., Joly E., Prentki M. (2007) J. Biol. Chem. 282, 35657–35665 [DOI] [PubMed] [Google Scholar]
- 62. Laybutt D. R., Glandt M., Xu G., Ahn Y. B., Trivedi N., Bonner-Weir S., Weir G. C. (2003) J. Biol. Chem. 278, 2997–3005 [DOI] [PubMed] [Google Scholar]
- 63. Berne C. (1975) J. Histochem. Cytochem. 23, 660–665 [DOI] [PubMed] [Google Scholar]
- 64. Corkey B. E., Deeney J. T., Yaney G. C., Tornheim K., Prentki M. (2000) J. Nutr. 130, 299S–304S [DOI] [PubMed] [Google Scholar]
- 65. Hasan N. M., Longacre M. J., Seed Ahmed M., Kendrick M. A., Gu H., Ostenson C. G., Fukao T., MacDonald M. J. (2010) Arch. Biochem. Biophys. 499, 62–68 [DOI] [PMC free article] [PubMed] [Google Scholar]
- 66. Malaisse W. J., Lebrun P., Yaylali B., Camara J., Valverde I., Sener A. (1990) Am. J. Physiol. 259, E117–E122 [DOI] [PubMed] [Google Scholar]
- 67. Ikeda T., Yoshida T., Ito Y., Murakami I., Mokuda O., Tominaga M., Mashiba H. (1987) Arch. Biochem. Biophys. 257, 140–143 [DOI] [PubMed] [Google Scholar]
- 68. Owen O. E., Kalhan S. C., Hanson R. W. (2002) J. Biol. Chem. 277, 30409–30412 [DOI] [PubMed] [Google Scholar]
- 69. Walter P., Paetkau V., Lardy H. A. (1966) J. Biol. Chem. 241, 2523–2532 [PubMed] [Google Scholar]
- 70. LaNoue K., Nicklas W. J., Williamson J. R. (1970) J. Biol. Chem. 245, 102–111 [PubMed] [Google Scholar]
- 71. Ni Q., Reid K. R., Burant C. F., Kennedy R. T. (2008) Anal. Chem. 80, 3539–3546 [DOI] [PMC free article] [PubMed] [Google Scholar]
- 72. Srere P. A. (1974) Life Sci. 15, 1695–1710 [DOI] [PubMed] [Google Scholar]
- 73. Joseph J. W., Odegaard M. L., Ronnebaum S. M., Burgess S. C., Muehlbauer J., Sherry A. D., Newgard C. B. (2007) J. Biol. Chem. 282, 31592–31600 [DOI] [PubMed] [Google Scholar]
Associated Data
This section collects any data citations, data availability statements, or supplementary materials included in this article.