

Abstract
The exposure of the plasma membrane calcium pump (PMCA) to the surrounding phospholipids was assessed by measuring the incorporation of the photoactivatable phosphatidylcholine analog [125I]TID-PC/16 to the protein. In the presence of Ca2+ both calmodulin (CaM) and phosphatidic acid (PA) greatly decreased the incorporation of [125I]TID-PC/16 to PMCA. Proteolysis of PMCA with V8 protease results in three main fragments: N, which includes transmembrane segments M1 and M2; M, which includes M3 and M4; and C, which includes M5 to M10. CaM decreased the level of incorporation of [125I]TID-PC/16 to fragments M and C, whereas phosphatidic acid decreased the incorporation of [125I]TID-PC/16 to fragments N and M. This suggests that the conformational changes induced by binding of CaM or PA extend to the adjacent transmembrane domains. Interestingly, this result also denotes differences between the active conformations produced by CaM and PA. To verify this point, we measured resonance energy transfer between PMCA labeled with eosin isothiocyanate at the ATP-binding site and the phospholipid RhoPE included in PMCA micelles. CaM decreased the efficiency of the energy transfer between these two probes, whereas PA did not. This result indicates that activation by CaM increases the distance between the ATP-binding site and the membrane, but PA does not affect this distance. Our results disclose main differences between PMCA conformations induced by CaM or PA and show that those differences involve transmembrane regions.
Keywords: Calcium ATPase, Calmodulin, Phosphatidic Acid, Photoaffinity Labeling, Plasma Membrane, Transmembrane Domain
Introduction
The plasma membrane calcium pump (PMCA)3 is an integral membrane protein that actively removes calcium from the cytoplasm of eukaryotic cells. Its ATPase activity is enhanced by several modulators among which calmodulin (CaM) and acidic phospholipids appear to be the most effective. CaM binds to the C-terminal end of PMCA (1–3), a domain that displays a high content of basic amino acid residues. Cross-linking experiments revealed that the N-terminal half of this sequence interacts with a region located just upstream transmembrane segment M3 (Cys537–Thr544), whereas the C-terminal part interacts with another one located downstream transmembrane segment M4 (Ile206–Val271) (4, 5). This interaction causes the autoinhibition of the enzyme activity. Upon CaM binding, the interaction is disrupted, which results in an enhanced ATPase activity. Acidic phospholipids exert their effect on PMCA activity by accelerating the dephosphorylation step of the enzyme reaction cycle (6). Two binding sites for acidic phospholipids have been described within PMCA (7, 8). The one mainly responsible for the activation effect is located near transmembrane segment M3 (9). Binding of acidic phospholipids to this site also appears to relieve autoinhibition because deletion of a segment comprising amino acids 296–349 renders a high calcium affinity enzyme that is almost non-responsive to further activation by acidic phospolipids (10). Interestingly, this binding site partially overlaps the C-terminal receptor region. For instance, synthetic peptides, including amino acids 339–363 or 348–370, i.e. acidic phospholipids binding site, were shown to effectively bind CaM and the CaM binding region as well. Acidic phospholipids bind to a second site located in the C-terminal domain of PMCA (7, 8). The contribution of this binding to the activation of the enzyme has been explored lately using isoform 2 of PMCA (11) but remains unclear for h4PMCA. The conformation adopted by PMCA upon activation has been recently studied by different techniques. Activation by CaM or acidic phospholipids increases the distance between N- and C-terminal domains of PMCA (12). Besides, the transmembrane arrangement of CaM-bound PMCA was shown to be more compact than that in the presence of calcium but absence of CaM (13). The aim of this work was to gain further insight into the structural changes elicited by CaM and phosphatidic acid (PA) on PMCA transmembrane region. To this end, we used a photolabeling approach previously shown to accurately sense differential exposure of transmembrane domains to surrounding phospholipids resulting from different conformations adopted by the protein (13). Our results show that CaM and PA behave independently regarding their effects on enzyme activity and transmembrane conformation. Moreover, activation elicited by CaM involves structural rearrangements within PMCA transmembrane domain markedly different from those taking place upon activation by acidic phospholipids.
EXPERIMENTAL PROCEDURES
Reagents
All chemicals used in this work were of analytical grade and purchased mostly from Sigma. Recently drawn human blood for the isolation of PMCA was obtained from the Hematology Section of the Hospital de Clínicas General San Martín and from Fundacion Fundosol (Argentina). Blood donation in Argentina is voluntary, and therefore the donor provides informed consent for the donation of blood and for the subsequent legitimate use of the blood by the transfusion service.
Purification of PMCA from Human Erythrocytes
PMCA was isolated from calmodulin-depleted erythrocyte membranes by the calmodulin affinity chromatography procedure (14) as modified by Filomatori and Rega (6). Protein concentration after purification was ∼10 μg/ml. No phospholipids were added at any step along the purification procedure. By measuring inorganic phosphate (see “Phospholipid Quantification”), we estimated that <1 mol of natural phospholipids per mol of PMCA is present in the purified enzyme. The purification procedure described preserves transport activity and maintains the kinetic properties and regulatory characteristics of the enzyme in its native milieu (6).
Measurement of Ca2+-ATPase Activity
Ca2+-ATPase activity was measured at 37 °C as the initial velocity of release of Pi from ATP as described previously (6). The incubation medium contained 80 μm DMPC, 120 μm C12E10, 120 mm KCl, 30 mm MOPS-K (pH 7.4), 3.75 mm MgCl2, 1 mm EGTA, and enough CaCl2 to give the desired final free [Ca2+] as specified for each experiment. When necessary, calmodulin and/or 1,2-distearoyl-sn-glycero-3-phosphate (PA) were added, and their concentration is indicated in each figure. Release of Pi was estimated according to the procedure of Fiske and Subbarow (15). Measurements were performed in a Jasco V-630 Bio spectrophotometer.
Preparation of [125I]TID-PC/16
TTD-PC/16 (tin precursor) was a kind gift of Dr. J. Brunner (ETH Zentrum, Zurich, Switzerland). [125I]TID-PC/16 was prepared by radioiodination of its tin precursor according to Weber and Brunner (16).
Phospholipid Quantification
Phospholipid concentration was measured according to Chen et al. (17).
Labeling Procedure
A dried film of the photoactivatable reagent was suspended in PC/C12E10 or PA/C12E10 mixed micelles containing 10 μg/ml of the membrane protein. The samples were incubated for 20 min at 25 °C before being irradiated for 15 min with light from a filtered UV source (λ = 360 nm).
Radioactivity and Protein Determination
Electrophoresis was performed according to the Tris-Tricine SDS-PAGE method (18). Isocratic gels (7.5% T and 1% C and 1-mm thick) were used for undigested PMCA. When the protocols required isolation of proteolytic fragments, gradient gels (4–20%) were used. Polypeptides were stained with Coomassie Blue R; the isolated bands were excised from the gel, and the incorporation of radioactivity was directly measured on a gamma counter. The amount of protein was quantified by eluting each stained band, as described previously (19), including bovine serum albumin in each gel as a standard for protein quantification. Specific incorporation was calculated as the ratio between measured radioactivity and amount of protein determined for each band.
V8 Protease Proteolysis of PMCA
After photolysis, the labeled samples were dialyzed against 50 mm Tris-H3PO4 (pH 7.2) and then supplemented with 0.8% SDS and digested with V8 protease (200 ng per ml) at 25 °C. The reaction was stopped after 3 h by the addition of TCA up to a final concentration of 10%. The identity of the fragments was confirmed by immunoblotting and protein N-terminal sequencing as described previously (20–22).
Analysis of SERCA Structure and Accessible Surface Area
The crystal structures used for comparison were as follows: Protein Data Bank codes 1SU4 (23) and 2EAR (24).
The transmembrane regions were taken as explicitly defined in Uniprot for sarcoplasmic/endoplasmic reticulum calcium ATPase 2, accession no. P20647. The accessible surface area (ASA) of the transmembrane helices was calculated with MolMol (25, 26) with a solvent radio of 1.4 Å. Superposition of crystal structures was performed with POSA (27).
Spectroscopic Measurements
The fluorescence measurements were made in a quartz cell of 3 × 3 mm using an SLM-spectrofluorometer AMINCO BOWMAN Series 2 (Spectronic Instrument, Inc., Rochester, NY). The excitation and emission bandwidths were set at 4 nm.
Labeling with Isothiocyanate 5′-Eosin (EITC)
The calcium pump was labeled with isothiocyanate 5′-eosin as described previously (28). In these conditions, only Lys495 becomes labeled (28, 29). The stoichiometry of labeling (0.96 ± 0.6 mol of EITC per mol of ATPase) was determined by measuring the light absorption in the presence of 1% SDS, 0.1 m NaOH, considering a molar extinction coefficient of 83,000 m−1/1 cm−1 at 522 nm for EITC-PMCA (30).
After labeling with EITC, the enzyme completely lost its Ca2+-ATPase activity. The inhibition of the enzyme by EITC is a consequence of the selective binding of this probe to lysine 495 in hPMCA4b isoform residue located near the ATP binding site (30). These authors observed that the enzyme is not able to bind ATP after chemical modification with either of these probes. In addition, the enzyme properties that do not depend on ATP binding are conserved after the specific labeling. Particularly, the labeled enzymes preserve the ability to bind calmodulin in a Ca2+-dependent mode, exhibit calmodulin-dependent phosphatase activity (31), and dimerize (32). The labeled protein has a single fluorescence emission maximum of 548 nm. The maximum excitation at 532 nm was observed according to previous reports (33).
RhoPE-containing Micelles
A lyophilized powder of lissamine rhodamine-B1,2-sn-glycerides dihexadecanoyl-3-phosphatidylethanolamine (RhoPE) was resuspended in 500 μl of CH3OH-CHCL3 (2:1), aliquoted into equal parts, and carried to dryness. The films obtained were stored at −20 °C, protected from light. In the elution buffer of PMCA, the probe shows maximum excitation at 573 nm and a single fluorescence emission peak at 588 nm. The concentration used was always <2% mol/mol. Under these conditions no self-quenching effects are observed (34). When increasing concentrations of PC, PE, or PA were needed, these phospholipids were sonicated until the total disappearance of turbidity. They were added to EITC-PMCA reconstituted in micelles of C12E10 containing RhoPE and incubated 20 min prior to the florescence measurement.
The efficiency of fluorescence energy transfer (E) was measured from the decrease on the donor fluorescence caused by the presence of the acceptor according to the following equation (35): E = 1 − F/F0, where F and F0 are the EITC-PMCA emission intensity in the presence or the absence of RhoPE, respectively.
Analysis of Data
All measurements were performed in duplicate to quintuplicate. SDS gels presented under “Results” were chosen as representative of at least three independent experiments.
RESULTS
Effect of CaM and PA on PMCA Enzymatic Activity
Ca2+-ATPase activity of PMCA was measured in the presence of increasing concentrations of CaM (Fig. 1A). A hyperbolic function (Equation 1) was fitted to the experimental data, and the best fit value parameter obtained for KCaM was 10.7 ± 1.2 nm in good agreement with previously reported values obtained from PMCA activity measurements (36, 37).
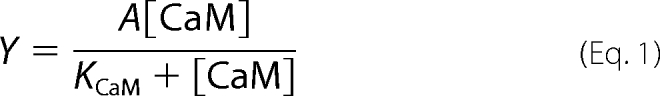 |
This parameter remained unchanged in the presence of 60 μm PA (9.4 ± 0.6 nm). However, the best fit parameter value obtained for A, i.e. enzyme activation over a basal activity in the absence of modulators, increased from 136 ± 4.4% in the absence of PA to 253.1 ± 17.2% in the presence of this modulator. ATPase activity was then assessed using increasing PA concentrations (Fig. 1B). Equation 1 was fitted to the experimental points, but now the variable was the concentration of PA instead of the concentration of CaM. Accordingly, KCaM of Equation 1 is replaced by KPA. The best fit parameter value for KPA thus obtained was 21.8 ± 3.8 μm. As before, this parameter remained constant in the presence of 50 nm CaM (21.7 ± 3.2 μm), whereas A increased from 127.1 ± 4.1 to 229 ± 11.6. These results suggest that CaM and PA binding sites responsible for PMCA activation are independent.
FIGURE 1.

Dependence of Ca2+-ATPase activation as a function of [CaM] and [PA]. A, function of [CaM] in the absence or presence of 60 μm PA. B, function of [PA] in the absence or presence of 50 nm CaM. The [Ca2+]free was 3 μm. ATPase activity in the absence of activators was taken as 100%. Values reported are mean ± S.E. of three independent experiments.
Effect of CaM and PA on [125I]TID-PC/16 Incorporation to PMCA
[125I]TID-PC/16 is a photoactivatable reagent that has been shown previously to behave as PC regarding protein-lipid interactions (38, 39). It is thus possible to assess lipid exposure of transmembrane protein regions by quantifying the amount of reagent that becomes covalently attached to the protein upon photolysis (40). [125I]TID-PC/16 is used as a probe, i.e. its concentration in the labeling medium is negligible. As a PC analog, it is not expected to preferentially bind any sites within PMCA. Its incorporation to the protein is therefore an accurate report of the overall conformational changes occurring upon activation by CaM or PA. These latter compounds were used at suitable concentrations to achieve maximal activity of the pump. We first wished to determine the extent of [125I]TID-PC/16 labeling of the PMCA in its major known conformational states. The E2 state is attained by incubating PMCA in the absence of Ca2+ (1 mm EGTA). The incorporation of [125I]TID-PC/16 in this condition was considered as the control and was set as 100%. The other two conformers are E1I and E1A. E1I is obtained by incubating the enzyme in the presence of Ca2+ and binds the maximum amount of [125I]TID-PC/16 (155% at optimal concentration of Ca2+). E1A is a conformation attainable in the presence of Ca2+ and CaM, which binds 75% of the control. These data are similar as those reported earlier (13) and illustrate the sensitivity of [125I]TID-PC/16 incorporation to the different PMCA conformations. To estimate the level of exposure of activated PMCA to surrounding phospholipids, we labeled the enzyme in the presence of CaM, PA, or CaM and PA (Fig. 2). A similar behavior to that observed with CaM was observed with PA, i.e. exposure of the transmembrane region also decreases in the presence of this activator. However, the effect observed with PA is less pronounced than that observed with CaM. Moreover, when CaM is already bound to PMCA, no further changes in the average transmembrane exposure to lipids occur upon PA binding. These results suggest that the degree of compaction attained by the transmembrane region is maximal in the presence of CaM.
FIGURE 2.

Relative specific incorporation of [125I]TID-PC/16 to PMCA under different conditions. The specific incorporation in the presence of 1 mm EGTA was taken as 100% (EGTA). Ca2+, 100 μm Ca2+; CaM, 100 μm Ca2+ and 200 nm CaM. PA, 100 μm Ca2+ and 60 μm PA. CaM+PA, 100 μm Ca2+ 200 nm CaM and 60 μm PA (E1A). Values reported are mean ± S.E. of five independent experiments.
Quantitative Analysis of CaM and PA Binding Processes
According to our results, activation triggers a conformational change in PMCA transmembrane domain, which results in less incorporation of [125I]TID-PC/16. To further explore this effect, we performed a photolabeling experiment in which increasing amounts of CaM were added to the incubation medium in the presence or absence of PA (Fig. 3A). In this experiment, we titrated the amount of [125I]TID-PC/16 that binds to PMCA as it shifts from the E1I to the E1A conformer as we have described previously (41).
FIGURE 3.

Incorporation of [125I]TID-PC/16 to PMCA upon activation by calmodulin or phosphatidic acid activation. A, purified PMCA was photolabeled in the presence of 100 μm Ca2+ and increasing CaM concentrations in the presence or absence of 60 μm PA. B, purified PMCA was photolabeled in the presence of 100 μm Ca2+ and increasing PA concentrations in the presence or absence of 100 nm CaM. Values reported are mean ± S.E. of three independent experiments.
Equation 2 was fitted to the experimental data. This empirically derived equation characterizes the effect of CaM on the amount of [125I]TID-PC/16 bound to PMCA.
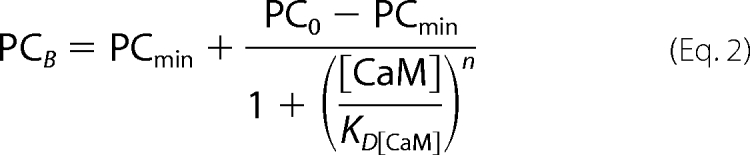 |
The PCB parameter represents the specific incorporation of [125I]TID-PC/16 to PMCA at a given concentration of CaM, PC0 is the specific incorporation in the absence of CaM, PCmin is the minimal level of specific incorporation, n is the Hill coefficient, and KD[CaM] the concentration of CaM at which half-maximal incorporation is attained. The best fit value parameter obtained for PC0 in the absence of PA was 154.8 ± 2.6%, whereas those obtained for PCmin, n, and KD[CaM] were 71.9 ± 1.8%, 1.9 ± 0.4, and 9.6 ± 0.8 nm, respectively. The values obtained for PC0 and PCmin illustrate the previously described compaction effect exerted by CaM on PMCA transmembrane region. In the presence of 60 μm PA, the value parameters obtained were PC0 = 91.4 ± 1.4%, PCmin = 74.7 ± 0.9, n = 2.3 ± 0.4, and KD[CaM] = 8.5 ± 1.2. The value obtained for PC0 under this condition illustrates the more compact conformation adopted by PMCA transmembrane region in the presence of PA and that obtained for PCmin shows that CaM exerts an additional effect. The degree of compaction achieved is indistinguishable from that attained in the absence of PA. The value obtained for KD[CaM] in the absence of PA is in good agreement with the value we calculated for KCaM from Fig. 1, with the reported affinity constant for CaM obtained by enzyme activity measurements (36, 37), and with that obtained by fluorescence polarization (42). These results show that the values for the dissociation constant of CaM calculated from the change in [125I]TID-PC/16 incorporation and from enzyme activation are very similar, validating the use of [125I]TID-PC/16 incorporation to follow the conformational shift from E1I to E1A. This parameter remained unchanged in the presence of 60 μm PA, which suggests that the CaM binding site responsible for the observed conformational effects does not overlap with the acidic phospholipid binding site.
Fig. 3B shows the PA-dependent incorporation of [125I]TID-PC/16 in the absence or presence of 50 nm CaM. Equation 2 was fitted to the experimental data, but now the variable was the concentration of PA instead of the concentration of CaM. Accordingly, KD[CaM] of Equation 2 is replaced by KD[PA], and PC0 reflects the initial amount of [125I]TIDPC/16 bound in the absence of PA. In this case, the best fit value parameters obtained for PC0, PCmín, n, and KD[PA] were 153.0 ± 2.2%, 89.8 ± 2.0%, 1.7 ± 0.24, and 16.5 ± 2.3 μm, respectively. As before, the values obtained for PC0 and PCmin illustrate the effect exerted by PA on the degree of compaction of PMCA transmembrane region. The value obtained for KD[PA] is also in good agreement with that obtained for KPA using enzymatic activity measurements (see above). By contrast, in the presence of 50 nm CaM, no changes in [125I]TID-PC/16 specific incorporation to PMCA were observed upon increasing concentrations of PA (Fig. 3B). The average value obtained under this condition was 75.2 ± 3.4, which is indistinguishable from that obtained for PCmin upon increasing [CaM] in the presence of PA (76.9 ± 1.8%). This result suggests that regarding its transmembrane conformation, CaM-bound PMCA becomes insensitive to binding of PA and further points to nonoverlapping binding sites of these two enzyme activity modulators.
Differential Exposure of PMCA Hydrophobic Domains
It is possible to obtain a highly reproducible proteolysis pattern of PMCA by using V8 protease under controlled conditions (Scheme 1). Each of the resulting fragments includes two (fragments N and M) or six (fragment C) transmembrane segments. Therefore, the combined strategy of photolabeling followed by controlled digestion of PMCA allowed us to analyze the specific incorporation of [125I]TID-PC/16 to three different hydrophobic domains of the transmembrane region (43). We assessed the amount of [125I]TID-PC/16 covalently attached to each of the proteolitic fragments after photolabeling the enzyme in the presence of EGTA, Ca2+, Ca2+ and CaM, Ca2+ and PA or Ca2+, CaM, and PA. Specific incorporation to each fragment in the presence of EGTA was considered as the control and was set as 100%. Specific incorporation of the reagent to fragment N, M, and C was higher in the presence of Ca2+ than in the absence of the ion (Fig. 4A). On the other hand, specific incorporation to any of the fragments was decreased markedly in the presence of either CaM or PA (Fig. 4, B and C), mimicking the results obtained for the undigested protein. The pattern of reagent incorporation among the three fragments was markedly different under each experimental condition. In the presence of Ca2+, the level of incorporation to fragment N, M, or C was similar. In the presence of CaM, fragments C and M showed a lower level of [125I]TID-PC/16 incorporation than fragment N. In the presence of PA [125I]TID-PC/16 incorporation to fragments N and M was lower than that measured for fragment C. Finally, in the presence of both CaM and PA, the pattern was similar to that obtained with CaM alone (Fig. 4D). Incorporation of [125I]TID-PC/16 to fragment C was lower than that to fragment M, which, in turn, was lower than that obtained for fragment N. These results show that, besides affecting the overall exposure of the transmembrane region, the presence of Ca2+, CaM, or PA leads to a specific rearrangement of hydrophobic domains in PMCA.
SCHEME 1.

Schematic representation of PMCA digestion with V8 protease. The arrows show the residues where the cleavage occurs. The gray boxes represent the sites of interaction with acidic phospholipids and calmodulin, respectively. N, M, and C correspond to the three resulting fragments, each of which contains one of three hydrophobic domains (DH). Left, SDS-PAGE representative of the resulting 55-, 40-, and 38-kDa fragments after proteolysis with V8 protease in the presence of SDS. Mr of proteins used as standards are indicated on the right.
FIGURE 4.

Relative specific incorporation to N, M, and C fragments resulting from PMCA proteolysis. Purified PMCA was photolabeled in the presence of 100 μm Ca2+ (A), 100 μm Ca2+ and 200 nm CaM (B), 100 μm Ca2+ and 60 μm PA (C), or 100 μm Ca2+ 200 nm CaM and 60 μm PA (D). The samples were then digested with V8 protease as described under “Experimental Procedures.” Values were calculated relative to the specific incorporation of each fragment in the presence of 1 mm EGTA (E2), which was taken as 100%. Data shown are mean ± S.E. of three to five independent experiments.
Differential Exposure of SERCA Hydrophobic Domains, Accessible Surface Area
Our next goal was to assess whether this finding was comparable with the transmembrane domain conformational changes described for other P-ATPases. As a model, we chose the Ca2+ pump of sarcoplasmic reticulum (SERCA) because crystallographic structures of this protein in different conformations are available (23, 24, 44–46). The most striking rearrangement in protein structure occurs when the enzyme binds Ca2+, i.e. between E2 (2EAR) and E1 (1SU4). The extent of interaction with membrane lipids under each condition was quantified by calculating the ASA as described previously (25). To perform a direct comparison with the results obtained for PMCA, the transmembrane region of SERCA was divided into three hydrophobic domains, similar to those obtained after V8 digestion of PMCA. ASA was calculated for these domains, and the value obtained for each of them in the absence of calcium was set as 100%. After binding of calcium, the conformation in which SERCA is completely activated, ASA of the three hydrophobic domains decreases. However, the pattern of differential exposure to phospholipids of each domain is different from that obtained for activated PMCA, i.e. in the presence of CaM or PA or both CaM and PA (Table 1). This result points out a clear difference between the two pumps and further points at specific mechanisms of activation in PMCA of both CaM and PA.
TABLE 1.
Relative specific incorporation of [125I]TID-PC/16 to N, M, and C fragments and PMCA and accessible surface area of the equivalent hydrophobic domains in SERCA
The specific incorporation in presence of EGTA (E2 PMCA) and ASA obtained for E2 SERCA (Protein Data Bank code 2EAR) were taken as 100%.
| Enzyme | PMCA |
SERCA |
|||
|---|---|---|---|---|---|
| Ca2+ | CaM | PA | CaM and PA | Ca2+ | |
| N | 126.7 ± 5.5 | 97.1 ± 4.6 | 73.7 ± 3.8 | 104.2 ± 1.0 | 79.8 |
| M | 121.7 ± 2.7 | 67.8 ± 1.9 | 83.0 ± 1.5 | 69.4 ± 8.1 | 72.8 |
| C | 125.3 ± 6.0 | 79.0 ± 1.9 | 97.4 ± 1.7 | 76.5 ± 1.5 | 87.6 |
| Transmembrane domain | 160.3 ± 1.5 | 75.0 ± 1.1 | 91.4 ± 1.3 | 76.4 ± 2.3 | 81.7 |
Differences between Effect of Acidic Phospholipids and CaM in Cytoplasmic Domains
The ATP binding site is located in the cytoplasmic domain between transmembrane segments 4 and 5, which are included in the central and C-terminal hydrophobic domains, respectively. The exposure to phospholipids of these two hydrophobic domains was shown to decrease in the presence of CaM. Therefore, we wanted to explore a possible correlation between this transmembrane rearrangement and a conformational change in the corresponding cytoplasmic region. To this end, we measured RET between EITC-labeled PMCA reconstituted in mixed micelles containing C12E10-PC and RhoPE in different media (Fig. 5A). The Lys residue that becomes labeled in PMCA is located at the ATP-binding site (30) of PMCA. Thus, changes in the efficiency of the energy transfer (see “Experimental Procedures”) indicate whether the cytoplasmic domain containing the ATP binding site gets closer to or further away from the membrane. When comparing with control medium (in the presence of EGTA), Ca2+-containing medium increased the efficiency of the energy transfer by ∼20%. Addition of CaM to the Ca2+-containing medium decreased the efficiency of RET to about the same value as in the EGTA-containing medium. These results suggest that in the conformation E1I (obtained with Ca2+ alone) the cytoplasmic domain containing the ATP binding site is closer to the membrane. Addition of CaM renders a conformation in which this domain is located further away from the membrane. We then measured the efficiency of energy transfer between EITC-PMCA and RhoPE with increasing amounts of PC, PE, or PA (Fig. 5B). As expected, increasing the amount of lipids decreased the fluorescence because RhoPE was diluted. To quantify the effect of each phospholipid, Equation 3 was fitted to the experimental data.
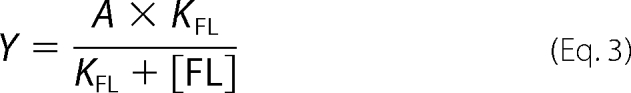 |
KFL represents the phospholipid concentration needed to reduce by half the RET efficiency. The best fit value parameter obtained for KFL (76.3 ± 8.3 μm, 84.4 ± 9.1 μm, and 79.7 ± 9.3 μm for phosphatidylcholine, phosphatidylethanol-amine, and phosphatidic acid, respectively) was indistinguishable for the different phospholipids, i.e. the decrease in RET efficiency was the same regardless of the nature of the phospholipid added. This indicates that during the activation by acidic lipids, the cytoplasmic domain containing the ATP binding site does not move significantly farther away from the membrane in contrast to the results obtained with the enzyme activated by CaM.
FIGURE 5.

Efficiency of energy transfer (E) between EITC-PMCA and RhoPE under different conditions. A, purified EITC-PMCA was reconstituted in C12E10-PC-RhoPE mixed micelles (120 μm-60 μm-0.2 μm), and the emission of the donor was measured in presence of 1 mm EGTA (EGTA), 100 μm Ca2+ (Ca2+), 100 μm Ca2+ and 200 nm CaM (CaM), or purified EITC-PMCA was reconstituted in C12E10-PA-RhoPE (120 μm-60 μm- 0.2 μm) (PA). E was calculated as described under “Experimental Procedures.” The value obtained for E in presence of EGTA was taken as 100%. B, purified EITC-PMCA was reconstituted in C12E10-RhoPE mixed micelles, and the emission of the donor was measured in presence of increasing concentrations of PA, PE, or PC. The value obtained for E in the absence of PC, PE, or PA was taken as 100%. Values reported are mean ± S.E. of five and three independent experiments, respectively.
DISCUSSION
By using [125I]TID-PC/16, we were previously able to assess two different transmembrane conformations within PMCA: one in which the protein displays maximum lipid exposure corresponding to an autoinhibited state of the enzyme (presence of Ca2+) and another in which protein-lipid interactions are markedly decreased corresponding to an activated state (presence of Ca2+ and CaM) (13). Using the same experimental approach, we were also able to measure equilibrium constants for different ligands through the change of transmembrane conformations in PMCA (41). We demonstrated that the apparent affinity constant for Ca2+ (KCa2+) is not affected by the presence of either CaM or PA, two of the most relevant modulators of enzyme activity. These results highlight the convenience of directly exploring the effects of different ligands on PMCA transmembrane region as these are not necessarily reflected in the rate of ATP turnover; i.e. in steady state conditions, both CaM and PA have been extensively shown to have a considerable effect on KCa2+ (7, 47, 48).
The effect of CaM and PA proved to be additive as assessed by Ca2+-ATPase activity, suggesting that they act through independent mechanisms. In these experiments, neither CaM nor PA affected the apparent affinity constant of the other ligand, pointing to nonoverlapping binding sites. Therefore, although CaM and PA could be expected to share a common structural effect because they both ultimately perturb a region connecting transmembrane segment M3, these ligands are able to act through unrelated pathways. This does not discard the presence of a second low affinity binding site shared by both ligands that has no effect on ATP turnover but is revealed in binding experiments using synthetic peptides (7, 8).
When interpreting the results of [125I]TID-PC/16 incorporation experiments, it is important to emphasize that this method probes the overall exposure of membrane segments to phospholipids but not the specific site(s) for acidic phospholipids in PMCA. The overall exposure to surrounding lipids is less in the presence of CaM than in the presence of PA and much less in the presence of either CaM or PA than in the presence of Ca2+ alone. The level of compaction elicited by CaM on the transmembrane region appears to be maximum as, in the presence of this ligand, no changes were observed in the level of [125I]TID-PC/16 incorporation upon addition of PA. By measuring changes in the level of [125I]TID-PC/16 incorporation we calculated the value for PA apparent affinity constant, which is in excellent agreement with that calculated from ATPase measurements. This suggests that the effect of PA on transmembrane rearrangement goes in parallel with its effect on the rate of ATP turnover. In the presence of CaM, this ligand completely masks any effect that PA exerts on the level of compaction in the transmembrane region, i.e. no further changes are observed in [125I]TID-PC/16 incorporation within the whole range of PA concentrations assayed. Similarly, the calculated apparent affinity constant for CaM through specific incorporation analysis is in good agreement with that calculated by Liyanaje et al. (42) and through ATPase activity measurements (1, 36, 37, 49). This suggests that CaM effect on PMCA transmembrane structure is related directly to its effect on ATPase activity. Furthermore, the fact that the apparent affinity constant for this ligand remains unchanged in the presence of PA points to an independent effect of CaM on transmembrane rearrangements, which is also exposed in ATPase activity.
By enzymatically digesting photolabeled PMCA, we were able to dissect the domains within the transmembrane region that become specifically exposed to surrounding lipids. Calcium appears to elicit a general expansion of the transmembrane region in which every domain is more exposed to membrane lipids. In the presence of CaM or PA, a striking decrease in [125I]TID-PC/16 incorporation to any of the hydrophobic domains is observed, which is, on average, comparable with that observed for the undigested protein under each condition. However, the pattern of reagent incorporation between the different domains displays interesting variations. In the presence of CaM, the central domain included in fragment M becomes less exposed to phospholipids than the C-terminal domain included in fragment C and much less than the N-terminal domain included in fragment N. Activation by CaM is due to its binding to an autoinhibitory domain located at the C terminus of PMCA. CaM binding dissociates this C-terminal domain interaction with two pump domains, with one located just upstream transmembrane segment M3 and another one located downstream transmembrane segment M4 of PMCA relieving the autoinhibition. It is therefore not surprising that the most affected hydrophobic domains are those that include transmembrane segments directly connected with cytoplasmic targets of CaM binding, i.e. domain M, which includes segment M3 and M4, and domain C, which includes the transmembrane segment directly connected to the C terminus autoinhibitory domain. The observed pattern is remarkably different in the presence of PA. Under this condition, it is the N-terminal domain (fragment N) that becomes less exposed. The central domain (fragment M) presents an intermediate exposure, whereas the C-terminal domain shows the highest level of [125I]TID-PC/16 incorporation. PA binding sites have been identified within the cytoplasmic loop that connects transmembrane segments M2 and M3 (AL region) and in the C-terminal region of PMCA (7, 8). Mutagenesis experiments suggest that the function of this AL region is independent of the C-terminal autoinhibitory region (10). In our experiments, the most affected hydrophobic domains are those that include the transmembrane segments directly connected with the AL region, i.e. domain N, which includes M2, and domain M, which includes M3. In the simplest scenario, these changes would be occurring as a result of PA binding to AL region, although PA binding to the C-terminal region cannot be ruled out. Nevertheless, the results obtained using our experimental design explicitly highlight the difference in the transmembrane arrangement resulting from PA activation as compared with that resulting from CaM activation.
The difference in the pattern of [125I]TID-PC/16 incorporation between the two activating conditions further supports the conclusion that CaM and PA exert their effects through different pathways. In the presence of both activators, the pattern of [125I]TID-PC/16 incorporation is remarkably similar to that obtained in the presence of CaM alone. This result further supports the conclusion that the transmembrane arrangement elicited by CaM is not modified by the presence of PA. The transmembrane region compaction after activation is also observed in the SERCA. In this P-type ATPase, ASA calculation shows that the activation of the enzyme involves the compaction of the three hydrophobic domains analyzed in this work. However, the level of compaction of each domain is different from that elicited by CaM or PA in PMCA. This difference regarding the transmembrane structure upon activation is directly related to the major functional difference between these two P-ATPases, which lies precisely in the presence of the C terminus and the phospholipid binding domains that regulate Ca2+-ATPase activity.
Regarding cytoplasmic rearrangements, both CaM and PA were shown to increase the distance between N- and C-terminal regions (12). CaM increased the distance between the ATP binding site and the phospholipidic membrane as shown by our RET experiments, whereas this distance remained unchanged in the presence of PA. The ATP binding site is located between transmembrane segments 4 and 5 included in the central domain and the C-terminal hydrophobic domains, respectively. These were the hydrophobic domains that showed major changes in the presence of CaM in our [125I]TID-PC/16 incorporation experiments. Our data agree very well with the idea that in the E2 conformation the inhibitory region is tightly bound to the catalytic core so that it forms a compact structure, whereas the transmembrane domain adopts a more relaxed conformation. On the other hand, in the E1A conformation, the transmembrane domain adopts a more compact conformation. Within this general architecture elicited by both activators, we found important differences between the structural effect of CaM or PA, which were observed both at the transmembrane and cytoplasmatic domains. Taken together, our results indicate that regulation of PMCA activity by PA or CaM is achieved by different mechanisms.
Acknowledgments
We are greatly indebted to Dr. J. Brunner (Department of Biochemistry, Swiss Federal Institute of Technology Zurich, Zurich, Switzerland) for the kind gift of TTD-PC/16 (tin precursor) and to Dr. Rolando Rossi for helpful comments.
This work was supported by, in whole or in part, by National Institutes of Health, Fogarty International Center Grant R03TW006837. This work was also supported by Agencia Nacional de Promoción Científica y Tecnológica, Consejo Nacional de Investigaciones Científicas y Técnicas, and Universidad de Buenos Aires Ciencia y Técnica (Argentina).
- PMCA
- plasma membrane calcium pump
- SERCA
- sarcoplasmic reticulum calcium pump
- CaM
- calmodulin
- ASA
- accessible surface area
- [125I]TID-PC/16
- 1-O-hexadecanoyl-2-O-[9-[[[2-[125I]iodo-4-(trifluoromethyl-3H-diazirin-3-yl)benzyl]oxy]carbonyl] nonanoyl]-sn-glycero-3-phosphocholine
- PC
- 1,2-dimyristoyl-sn-glycero-3-phosphocholine
- PA
- 1,2 distearoyl-sn-glycero-3-phosphate
- PE
- 1,2-distearoyl-sn-glycero-3-phosphoethanolamine
- C12E10
- polyoxyethylene(10)dodecyl ether/-decaoxadotetracontan-1-ol
- Tris
- tris(hydroxymethyl)aminomethane
- RET
- resonance energy transfer
- RhoPE
- lissamine rhodamine-dihexadecanoil B1,2-sn-glycerin-3-phosphoethanolamine
- EITC
- isothiocyanate 5′-eosin.
REFERENCES
- 1. Enyedi A., Vorherr T., James P., McCormick D. J., Filoteo A. G., Carafoli E., Penniston J. T. (1989) J. Biol. Chem. 264, 12313–12321 [PubMed] [Google Scholar]
- 2. James P., Maeda M., Fischer R., Verma A. K., Krebs J., Penniston J. T., Carafoli E. (1988) J. Biol. Chem. 263, 2905–2910 [PubMed] [Google Scholar]
- 3. Vorherr T., James P., Krebs J., Enyedi A., McCormick D. J., Penniston J. T., Carafoli E. (1990) Biochemistry 29, 355–365 [DOI] [PubMed] [Google Scholar]
- 4. Falchetto R., Vorherr T., Brunner J., Carafoli E. (1991) J. Biol. Chem. 266, 2930–2936 [PubMed] [Google Scholar]
- 5. Falchetto R., Vorherr T., Carafoli E. (1992) Protein Sci. 1, 1613–1621 [DOI] [PMC free article] [PubMed] [Google Scholar]
- 6. Filomatori C. V., Rega A. F. (2003) J. Biol. Chem. 278, 22265–22271 [DOI] [PubMed] [Google Scholar]
- 7. Filoteo A. G., Enyedi A., Penniston J. T. (1992) J. Biol. Chem. 267, 11800–11805 [PubMed] [Google Scholar]
- 8. Brodin P., Falchetto R., Vorherr T., Carafoli E. (1992) Eur. J. Biochem. 204, 939–946 [DOI] [PubMed] [Google Scholar]
- 9. Zvaritch E., James P., Vorherr T., Falchetto R., Modyanov N., Carafoli E. (1990) Biochemistry 29, 8070–8076 [DOI] [PubMed] [Google Scholar]
- 10. Pinto F., de T., Adamo H. P. (2002) J. Biol. Chem. 277, 12784–12789 [DOI] [PubMed] [Google Scholar]
- 11. Brini M., Di Leva F., Ortega C. K., Domi T., Ottolini D., Leonardi E., Tosatto S. C., Carafoli E. (2010) J. Biol. Chem. 285, 30779–30791 [DOI] [PMC free article] [PubMed] [Google Scholar]
- 12. Corradi G. R., Adamo H. P. (2007) J. Biol. Chem. 282, 35440–35448 [DOI] [PubMed] [Google Scholar]
- 13. Mangialavori I., Giraldo A. M., Buslje C. M., Gomes M. F., Caride A. J., Rossi J. P. (2009) J. Biol. Chem. 284, 4823–4828 [DOI] [PMC free article] [PubMed] [Google Scholar]
- 14. Niggli V., Penniston J. T., Carafoli E. (1979) J. Biol. Chem. 254, 9955–9958 [PubMed] [Google Scholar]
- 15. Fiske C. H., SubbaRow Y. (1925) J. Biol. Chem. 66, 375–400 [Google Scholar]
- 16. Weber T., Brunner J. (1995) J. Am. Chem. Soc. 117, 3084–3095 [Google Scholar]
- 17. Chen P. S., Toribara T. Y., Warner H. (1956) Anal. Chem. 28, 1756–1758 [Google Scholar]
- 18. Schägger H., von Jagow G. (1987) Anal. Biochem. 166, 368–379 [DOI] [PubMed] [Google Scholar]
- 19. Ball E. H. (1986) Anal. Biochem. 155, 23–27 [DOI] [PubMed] [Google Scholar]
- 20. Filoteo A. G., Elwess N. L., Enyedi A., Caride A., Aung H. H., Penniston J. T. (1997) J. Biol. Chem. 272, 23741–23747 [DOI] [PubMed] [Google Scholar]
- 21. Caride A. J., Filoteo A. G., Enyedi A., Verma A. K., Penniston J. T. (1996) Biochem. J. 316, 353–359 [DOI] [PMC free article] [PubMed] [Google Scholar]
- 22. Adamo H. P., Caride A. J., Penniston J. T. (1992) J. Biol. Chem. 267, 14244–14249 [PubMed] [Google Scholar]
- 23. Toyoshima C., Nakasako M., Nomura H., Ogawa H. (2000) Nature 405, 647–655 [DOI] [PubMed] [Google Scholar]
- 24. Takahashi M., Kondou Y., Toyoshima C. (2007) Proc. Natl. Acad. Sci. U.S.A. 104, 5800–5805 [DOI] [PMC free article] [PubMed] [Google Scholar]
- 25. Lee B., Richards F. M. (1971) J. Mol. Biol. 55, 379–400 [DOI] [PubMed] [Google Scholar]
- 26. Koradi R., Billeter M., Wüthrich K. (1996) J. Mol. Graph. 14, 51–55 [DOI] [PubMed] [Google Scholar]
- 27. Ye Y., Godzik A. (2005) Bioinformatics 21, 2362–2369 [DOI] [PubMed] [Google Scholar]
- 28. Papp S., Pikula S., Martonosi A. (1987) Biophys. J. 51, 205–220 [DOI] [PMC free article] [PubMed] [Google Scholar]
- 29. Filoteo A. G., Gorski J. P., Penniston J. T. (1987) J. Biol. Chem. 262, 6526–6530 [PubMed] [Google Scholar]
- 30. Donnet C., Caride A. J., Talgham S., Rossi J. P. (1998) J. Membr. Biol. 1, 217–224 [DOI] [PubMed] [Google Scholar]
- 31. Munkonge F., Michelangeli F., Rooney E. K., East J. M., Lee A. G. (1988) Biochemistry 27, 6800–6805 [DOI] [PubMed] [Google Scholar]
- 32. Gatto C., Milanick M. A. (1993) Am. J. Physiol. 264, 1577–1586 [DOI] [PubMed] [Google Scholar]
- 33. Levi V., Rossi J. P., Castello P. R., González Flecha F. L. (2000) FEBS Lett. 483, 99–103 [DOI] [PubMed] [Google Scholar]
- 34. Hoekstra D. (1982) Biochemistry 21, 1055–1061 [DOI] [PubMed] [Google Scholar]
- 35. Fung B. K., Stryer L. (1978) Biochemistry 17, 5241–5248 [DOI] [PubMed] [Google Scholar]
- 36. Caride A. J., Elwess N. L., Verma A. K., Filoteo A. G., Enyedi A., Bajzer Z., Penniston J. T. (1999) J. Biol. Chem. 274, 35227–35232 [DOI] [PubMed] [Google Scholar]
- 37. Graf E., Penniston J. T. (1981) Arch. Biochem. Biophys. 210, 257–262 [DOI] [PubMed] [Google Scholar]
- 38. Brunner J., Semenza G. (1981) Biochemistry 20, 7174–7182 [DOI] [PubMed] [Google Scholar]
- 39. Brunner J. (1993) Annu. Rev. Biochem. 62, 483–514 [DOI] [PubMed] [Google Scholar]
- 40. Villamil Giraldo A. M., Castello P. R., González Flecha F. L., Moeller J. V., Delfino J. M., Rossi J. P. (2006) FEBS Lett. 580, 607–612 [DOI] [PubMed] [Google Scholar]
- 41. Mangialavori I., Ferreira-Gomes M., Pignataro M. F., Strehler E. E., Rossi J. P. (2010) J. Biol. Chem. 285, 123–130 [DOI] [PMC free article] [PubMed] [Google Scholar]
- 42. Liyanage M. R., Zaidi A., Johnson C. K. (2009) Anal. Biochem. 385, 1–6 [DOI] [PubMed] [Google Scholar]
- 43. Castello P. R., Caride A. J., González Flecha F. L., Fernández H. N., Rossi J. P., Delfino J. M. (1994) Biochem. Biophys. Res. Commun. 201, 194–200 [DOI] [PubMed] [Google Scholar]
- 44. Toyoshima C., Nomura H. (2002) Nature 418, 605–611 [DOI] [PubMed] [Google Scholar]
- 45. Toyoshima C., Mizutani T. (2004) Nature 430, 529–535 [DOI] [PubMed] [Google Scholar]
- 46. Olesen C., Picard M., Winther A. M., Gyrup C., Morth J. P., Oxvig C., Møller J. V., Nissen P. (2007) Nature 450, 1036–1042 [DOI] [PubMed] [Google Scholar]
- 47. Padányi R., Pászty K., Penheiter A. R., Filoteo A. G., Penniston J. T., Enyedi A. (2003) J. Biol. Chem. 278, 35798–35804 [DOI] [PubMed] [Google Scholar]
- 48. Bredeston L. M., Adamo H. P. (2004) J. Biol. Chem. 279, 41619–41625 [DOI] [PubMed] [Google Scholar]
- 49. Enyedi A., Flura M., Sarkadi B., Gardos G., Carafoli E. (1987) J. Biol. Chem. 262, 6425–6430 [PubMed] [Google Scholar]