

Abstract
Cholesterol has been shown to be hydroxylated at the 4β-position by cytochrome P450 3A4, and the reaction occurs in vivo (Bodin, K., Andersson, U., Rystedt, E., Ellis, E., Norlin, M., Pikuleva, I., Eggertsen, G., Björkhem, I., and Diczfalusy, U. (2002) J. Biol. Chem. 277, 31534–31540). If cholesterol is a substrate of P450 3A4, then it follows that it should also be an inhibitor, particularly in light of the high concentrations found in liver. Heme perturbation spectra indicated a Kd value of 8 μm for the P450 3A4-cholesterol complex. Cholesterol inhibited the P450 3A4-catalyzed oxidations of nifedipine and quinidine, two prototypic substrates, in liver microsomes and a reconstituted enzyme system with Ki ∼ 10 μm in an apparently non-competitive manner. The concentration of cholesterol could be elevated 4–6-fold in cultured human hepatocytes by incubation with cholesterol; the level of P450 3A4 and cell viability were not altered under the conditions used. Nifedipine oxidation was inhibited when the cholesterol level was increased. We conclude that cholesterol is both a substrate and an inhibitor of P450 3A4, and a model is presented to explain the kinetic behavior. We propose that the endogenous cholesterol in hepatocytes should be considered in models of prediction of metabolism of drugs and steroids, even in the absence of changes in the concentrations of free cholesterol.
Keywords: Cholesterol, Cytochrome P450, Drug Metabolism, Enzyme Inhibitors, Enzyme Kinetics, Hepatocytes
Introduction
Cytochrome P450 enzymes are nearly ubiquitous in nature. These hemoproteins are involved in the metabolism of numerous steroids, drugs, carcinogens, and other substrates in mammals and, in addition, in many pathways of secondary metabolism and defense in plants and microorganisms (1). Humans have 57 CYP genes potentially coding for P450 enzymes (2). One of these, P450 3A4, is involved in the metabolism of approximately one-half of the drugs marketed today (of those known to be oxidized) (2–4). In addition to drugs, this enzyme also has roles in both the bioactivation and detoxication of chemical carcinogens, e.g. aflatoxin B1 (2, 5, 6). P450 3A4 also has relatively high catalytic activities in the oxidation of a number of steroids, e.g. testosterone, progesterone, and 17β-estradiol (7, 8). More recently, P450 3A4 has been shown to catalyze the 4β-hydroxylation of cholesterol (9, 10), and the product has been proposed to be an in vivo biomarker of the activity of P450 3A4 (and the related protein P450 3A5, which is generally expressed at lower levels) (11).
P450 3A4 has been described as displaying rather schizophrenic behavior toward some ligands, which has been difficult to understand (2). Evidence for cooperativity (both homotropic and heterotropic) was first described in 1993–1994 (12, 13). Subsequently, considerable work has provided insight into the phenomenon, although not all aspects have been clarified (reviewed in Refs. 2 and 14). A general conclusion is that multiple ligands can be accommodated and that this multiplicity somehow accounts for the cooperative behavior that is seen, e.g. due to forcing substrates into juxtapositions more (or less) conducive for catalysis. This multiple-ligand hypothesis is supported by several kinetic studies (13, 15–17) and by fluorescence measurements (18). The binding of testosterone is a relatively slow process and is best described in terms of two (or more?) molecules of testosterone, with a conformational change in the protein (19, 20). X-ray crystallographic studies have provided some evidence for a multiple-ligand model of P450 3A4, with some structures indicating progesterone and testosterone bound at a peripheral site (21, 22) and two molecules of ketoconazole in a P450 3A4 crystal (23).
Ligand competition is another issue with P450 3A4 and is the basis of many of the drug-drug interaction issues in pharmaceutical development (24). Another consideration, which has received less discussion, is competition between drugs and endogenous compounds, e.g. sterols. Testosterone, progesterone, and estrogens are known substrates (7, 8) but are generally present at only low concentrations in the tissues where P450 3A4 is highly expressed, i.e. liver and small intestine. However, cholesterol is present at high concentrations in liver. Even considering the low solubility of cholesterol and equilibrium with bound forms, the high concentration of cholesterol in the liver is a potential issue.
In consideration of the demonstrated 4β-hydroxylation of cholesterol by P450 3A4 (9, 10), if cholesterol is a substrate of P450 3A4, then it follows that it should also be an inhibitor, which may be an issue in the context of the aforementioned high concentrations of cholesterol in liver (and brain). We considered this issue and have described the in vitro kinetics, which appear to follow non-competitive behavior but can be considered in other paradigms presented by Segel (25). The level of cholesterol in cultured human hepatocytes could be elevated by treatment with cholesterol. Elevation of the cholesterol level led to attenuated nifedipine oxidation activity, a marker for P450 3A4 (7). We conclude that consideration should be made for cholesterol inhibition of P450 3A4 in extrapolation to in vivo situations, analogous to binding of drugs and steroids to plasma proteins.
EXPERIMENTAL PROCEDURES
Chemicals
Cholesterol, 17α-ethynyl estradiol, 5-dimethylaminonaphthalene-1-sulfonyl (dansyl)2 chloride, 4,4-dimethylaminopyridine, 2-hydroxypropyl-β-cyclodextrin (HPβCD), miconazole, nifedipine, quinidine, l-α-1,2-dioleoyl-sn-glycero-3-phosphocholine, l-α-1,2-dilauroyl-sn-glycero-3-phosphoserine, and Tween 20 were purchased from Sigma, and l-α-1,2-dilauroyl-sn-glycero-3-phosphocholine was purchased from Enzo Life Sciences, Inc. (Plymouth Meeting, PA). Nifedipine was recrystallized from hot C2H5OH in amber glass. 4β- and 7α-hydroxycholesterol were purchased from Steraloids (Newport, RI). 3S-Hydroxyquinidine and quinidine N-oxide were obtained from Toronto Research Chemicals (North York, Ontario, Canada). Quinine was purchased from New York Quinine and Chemical Works (New York, NY). HPLC-grade solvents were purchased from Fisher. Oxidized nifedipine (pyridine derivative product) was synthesized by HNO3 oxidation as described previously (26).
Enzyme Preparations
Recombinant cytochrome P450 3A4 with a C-terminal His5 tag (27) was expressed in Escherichia coli and purified as described (16). Rat NADPH-cytochrome P450 reductase (28) and human cytochrome b5 (29) were expressed in E. coli and purified as described previously. Human liver samples (for preparation of microsomes) were from organ donors and obtained through Tennessee Donor Services (Nashville, TN) in accord with Vanderbilt Institution Review Board policies.
MS and Spectroscopy
A Thermo Finnigan TSQ Quantum mass spectrometer connected to a Waters ACQUITY UPLC® system was used for quantitation of dansylated compounds. UV-visible spectra were recorded with an Aminco DW-2/OLIS spectrophotometer (On-Line Instrument Systems, Bogart, GA).
Measurement of Cholesterol 4β-Hydroxylation Activity with a P450 3A4-reconstituted System
A 5× P450 protein premixture was prepared with slight modification (30). Briefly, a 5× protein premixture including 2.5 μm P450 3A4, 5 μm NADPH-cytochrome P450 reductase, 2.5 μm cytochrome b5, 150 μg/ml phospholipid mixture (1:1:1 (w/w/w) l-α-1,2-dioleoyl-sn-glycero-3-phosphocholine/l-α-1,2-dilauroyl-sn-glycero-3-phosphoserine/l-α-1,2-dilauroyl-sn-glycero-3-phosphocholine), 0.81 mm sodium CHAPS (0.50 mg/ml), and 3.0 mm GSH in 50 mm potassium HEPES buffer (pH 7.4) and a 5× buffer mixture including 12 mm GSH and 150 mm MgCl2 in 200 mm potassium HEPES (pH 7.4) were prepared. A typical 500-μl enzyme reaction mixture was prepared by mixing 100 μl of 5× P450 3A4 protein premixture, an equal volume of 5× buffer mixture, 5 μl of cholesterol solution in 310 mm HPβCD (45% (w/v)), and 220 μl of H2O. Incubations were initiated by the addition of 75 μl of an NADPH-generating system (31). Reactions were quenched with 2.0 ml of CH2Cl2 including 150 pmol of 17α-ethynyl estradiol (as the internal standard) and mixed with a Vortex device. Following centrifugation (2000 × g, 5 min), 1.4 ml of the organic layer was transferred and taken to dryness under an N2 stream. A general method for derivatization with dansyl chloride was used with slight modification (32). Briefly, the samples were dissolved in 200 μl of CH2Cl2 containing 2 mg of dansyl chloride, 0.5 mg of 4,4-dimethylaminopyridine, and 2 μl of triethylamine and incubated at 65 °C for 1 h. The samples were dried under an N2 stream and then dissolved in 100 μl of CH3CN for analysis.
Dansylated products were analyzed by LC-MS on a UPLC® system connected to a TSQ Quantum mass spectrometer using a Hypersil GOLD octadecylsilane column (2.1 × 150 mm, 3 μm; Thermo Scientific). LC conditions were as follows. Solvent A contained 95% H2O, 5% CH3CN, and 0.1% (v/v) HCO2H, and solvent B contained 5% H2O, 85% CH3CN, 10% tert-butyl methyl ether, and 0.1% (v/v) HCO2H. The column was maintained at the initial condition of 50% (v/v) solvent B for 0.5 min at a flow rate of 350 μl/min, followed by a linear gradient increasing to 100% (v/v) solvent B over 2.0 min. This condition was maintained for 7.5 min and then returned to the initial condition over 0.05 min and maintained until the end of a 13-min run. The column temperature was maintained at 40 °C. The injection volume onto the column was 15 μl. MS analyses were performed in the positive ion electrospray mode. Quantitation was based on multiple-reaction monitoring (dansylated 4β-hydroxycholesterol, m/z 636 → 252 and collision energy of 22 V; dansylated 17α-ethynyl estradiol, m/z 530 → 171 and collision energy of 40 V). The following (optimized) parameters were used for the detection of the analyte and the internal standard: N2 sheath gas, 27 p.s.i.; N2 auxiliary gas, 21 p.s.i.; spray voltage, 5.0 kV; capillary temperature, 270 °C; capillary offset, 35 V; tube lens voltage, 220 V; argon collision gas, 1.5 millitorr; scan time, 50 ms; Q3 scan width, 1 m/z; and Q1/Q3 peak widths at half-maximum, 0.7 m/z. The data were collected and quantified using Thermo Finnigan Xcalibur Version 1.0 software.
Measurement of Cholesterol 4β-Hydroxylation Activity with Human Liver Microsomes
The amount of cholesterol in a set of 10 pooled human liver microsomes (seven males and three females) (31) was first quantified as described previously (33). Aliquots of 10 pooled human liver microsomal samples, including exactly 25 nmol of cholesterol, were added to 1.0 ml of reaction mixture containing different amounts of cholesterol (0–225 nmol) and 3.1 mm HPβCD in 50 mm potassium phosphate buffer (pH 7.4). The assays were conducted at 37 °C for 30 min. Incubations were initiated by the addition of an NADPH-generating system (31). Following extraction, the derivatization and quantitation steps were conducted as described above.
Inhibition Studies with Human Liver Microsomes and a P450 3A4-reconstituted System
Reaction mixtures with human liver microsomes included 0.10 mg/ml microsomal protein, 5.8 μm endogenous cholesterol, 0–60 μm exogenous cholesterol, and 3.1 mm HPβCD in 100 mm potassium phosphate buffer (pH 7.4). Incubation times were 30 min for nifedipine and 20 min for quinidine. Reaction mixtures with recombinant P450 3A4 included 0.10 μm P450 3A4, 0.20 μm NADPH-cytochrome P450 reductase, 0.10 μm cytochrome b5, 40 μg/ml phospholipid mixture, 0.1 mg/ml CHAPS, 3.0 mm GSH, 30 mm MgCl2, 0–60 μm cholesterol, and 3.1 mm HPβCD in 50 mm potassium HEPES buffer (pH 7.4). Incubation times were 10 min for nifedipine and 5 min for quinidine. A typical volume of enzyme reaction mixture was 500 μl, and the substrate concentrations ranged from 5 to 200 μm (nifedipine) and from 10 to 300 μm (quinidine). After a 3-min preincubation, enzyme reactions were initiated by the addition of 75 μl of an NADPH-generating system (31).
The nifedipine reactions were terminated by the addition of 200 μl of CH3CN including 20 μm miconazole (as the internal standard), and the quinidine reactions were terminated by the addition of 20 μl of 5% (v/v) CF3CO2H and 2 μl of a 100 μm quinine solution in C2H5OH (as the internal standard). Samples were centrifuged at 12,000 × g for 10 min, and the supernatants were collected for LC analyses.
Samples for nifedipine oxidation studies were analyzed with a UPLC® system connected to an ACQUITY UV detector using an ACQUITY UPLC® BEH C18 octadecylsilane column (2.1 × 50 mm, 1.7 μm; Waters). LC conditions were as follows. Solvent A contained 45% H2O and 55% (v/v) CH3OH, and solvent B contained 100% (v/v) CH3OH. The column was maintained at an initial condition of 0% (v/v) solvent B for 2 min at a flow rate of 500 μl/min, followed by a linear gradient increasing to 100% (v/v) solvent B over 1.5 min. This condition was maintained for 1.5 min and then returned to the initial condition over 0.1 min and maintained until the end of a 7-min run. The column temperature was maintained at 40 °C. The injection volume was 15 μl. Absorbance was monitored at 269 nm (oxidized nifedipine) and 230 nm (miconazole).
Quinidine oxidation samples were analyzed with a UPLC® system connected to an ACQUITY fluorescence detector using an ACQUITY UPLC® BEH C18 octadecylsilane column (2.1 × 50 mm, 1.7 μm). LC conditions were as follows. Solvent A contained 90% H2O, 10% CH3CN, and 0.1% (v/v) CF3CO2H, and solvent B contained 10% H2O, 90% CH3CN, and 0.1% (v/v) CF3CO2H. The column was maintained at the initial condition of 0% (v/v) solvent B for 0.5 min at a flow rate of 350 μl/min, followed by a linear gradient increasing to 5% (v/v) solvent B over 3 min. After that, the percentage of solvent B was increased with a linear gradient to 100% over 1 min. This condition was maintained for 1.5 min and then returned to the initial condition over 0.1 min and maintained until the end of a 7.7-min run. The column temperature was maintained at 40 °C. The injection volume was 7.5 μl. Fluorescence measurements were made at an excitation wavelength of 360 nm and an emission wavelength of 415 nm. The data collection and quantitative analysis were conducted with Waters MassLynx Version 4.1 and QuanLynx Version 4.1 software, respectively.
Hepatocyte Incubations
Cryopreserved human hepatocytes (lots Hu1126 and Hu4242) were purchased from Invitrogen, stored frozen in liquid N2 until used, and thawed according to the supplier's recommended procedure. The cell number and viability were assessed using a trypan blue exclusion test. Cells were seeded at 0.9 × 10⁵ cells/well in collagen type 1-precoated 96-well plates in culture medium composed of Williams' E medium including 10% (v/v) FBS. The cells were maintained in a humidified incubator at 37 °C (5% (v/v) CO2) for 24 h. The medium was changed to FBS-free Hepato-STIM medium (BD Biosciences) including 200 μm cholesterol (0.31 mm HPβCD) or 30 μm pravastatin to modify the cholesterol levels in the cells. After 24 h, the leakage of lactate dehydrogenase was measured with a cytotoxicity detection kit (lactate dehydrogenase; Roche Diagnostics). The cells were washed twice with 100 μl of prewarmed PBS (10 mm potassium phosphate buffer (pH 7.4) containing 150 mm NaCl), and P450 3A4 activities were measured using 200 μm nifedipine (in FBS-free Hepato-STIM medium) with a 30-min incubation. The media were collected and stored at −20 °C until analysis.
Quantitation of Nifedipine Product in Media
The media (100 μl, following incubation with nifedipine) were mixed with 100 μl of CH3CN containing 1 μm miconazole (as the internal standard). Samples were centrifuged at 12,000 × g for 10 min, and the supernatants were collected and analyzed by LC-MS on a UPLC® system connected to a TSQ Quantum mass spectrometer using an L-column2 ODS (2.1 × 150 mm, 5 μm; Chemicals Evaluation and Research Institute, Saitama, Japan). LC conditions were as follows. Solvent A contained 95% H2O, 5% CH3CN, and 0.1% (v/v) HCO2H, and solvent B contained 5% H2O, 95% CH3CN, and 0.1% (v/v) HCO2H. The column was maintained at the initial condition of 20% (v/v) solvent B for 1.0 min at a flow rate of 350 μl/min, followed by a linear gradient increasing to 100% (v/v) solvent B over 3.5 min. This condition was maintained for 2.0 min and then returned to the initial condition over 0.1 min and maintained until the end of a 9-min run. The column temperature was maintained at 40 °C. The injection volume onto the column was 10 μl. MS analyses were performed in the positive ion electrospray mode. Quantitation was based on multiple-reaction monitoring (oxidized nifedipine, m/z 345 → 284 and collision energy of 26 V; miconazole, m/z 415 → 159 and collision energy of 32 V). The following (optimized) parameters were used for the detection of the analyte and the internal standard: N2 sheath gas, 40 p.s.i.; N2 auxiliary gas, 15 p.s.i.; spray voltage, 5.0 kV; capillary temperature, 270 °C; capillary offset, 12 V; tube lens voltage, 146 V; argon collision gas, 1.9 millitorr; scan time, 50 ms; Q3 scan width, 1 m/z; and Q1/Q3 peak widths at half-maximum, 0.7 m/z. Data were collected and quantified using Thermo Finnigan Xcalibur Version 1.0 software.
Quantitation of Cholesterol in Hepatocytes
After treatment with 200 μm cholesterol or 30 μm pravastatin, cells were washed twice with 100 μl of prewarmed PBS buffer (pH 7.4) and collected with 200 μl of 0.25% (w/v) trypsin solution. The cell solutions were treated with 2.0 ml of CH2Cl2 including 500 pmol of 7α-hydroxycholesterol (as the internal standard) and mixed with a Vortex device. Following derivatization and quantitation, steps were conducted as reported previously (33).
Immunoquantitation of P450 3A4 in Hepatocytes
After treatment with 200 μm cholesterol or 30 μm pravastatin, the cells were washed twice with 100 μl of prewarmed PBS buffer, and the proteins in the cells were collected with TRIzol® reagent (Invitrogen). The protein concentration was determined by a BCA assay (Pierce). The proteins extracted from hepatocytes (2–2.5 μg of protein/well in triplicate) were separated by 7.5% (w/v) SDS-PAGE (31, 34), along with standard samples containing 0–100 fmol of purified P450 3A4/well. The proteins were electrophoretically transferred to a polyvinylidene fluoride membrane (Bio-Rad). A primary rabbit serum including polyclonal antibodies raised against human P450 3A4 (35) was used (125-fold dilution in PBS). The secondary antibody was goat anti-rabbit IRD800CW, which emits infrared light at 800 nm (detected using a LI-COR Odyssey instrument). The slope of the standard curve (based on the spiked samples) was used to quantify the amount of P450 3A4 in proteins extracted from hepatocytes.
Kinetic Analyses
The kinetic parameters were calculated from untransformed data using GraphPad Prism. The models used in this study were as follows (Equations 1 and 2),
where Vmax is the maximal formation rate (kcat was used with purified P450 3A4), [I] is the inhibitor concentration, Ki is the inhibitor constant, [S] is the substrate concentration, Km is the Michaelis constant, and h is a Hill coefficient. The Hill constant-incorporated non-competitive inhibition model (Equation 2) was applied for the analysis of nifedipine metabolism by human liver microsomes, and the usual non-competitive inhibition model (Equation 1) was applied for the rest of the analyses.
RESULTS
Cholesterol 4β-Hydroxylation Activity with Human Liver Microsomes and a Cytochrome P450 3A4-reconstituted System
The cholesterol 4β-hydroxylation activity of P450 3A4 was measured in the presence of 3.1 mm HPβCD. Cholesterol binding to HPβCD has been reported with a Kd value of 1.1 mm (36). Free cholesterol concentrations were calculated using the Kd value of the cholesterol-HPβCD complex and a simple two-state binding model (i.e. cholesterol + HPβCD ⇄ cholesterol-HPβCD). These free cholesterol concentrations were used for further kinetic analyses.
The calculated Vmax and Km(cholesterol) values in human liver microsomes were 1.0 ± 0.2 pmol/min/mg of protein and 27 ± 9 μm, respectively (Fig. 1A). The calculated kcat and Km(cholesterol) values for the reconstituted system were 2.2 ± 0.2 pmol/min/nmol of P450 and 6.4 ± 2.1 μm, respectively (Fig. 1B), yielding an estimated catalytic efficiency of 3.4 × 10² m−1 min−1 (6 m−1 s−1).
FIGURE 1.
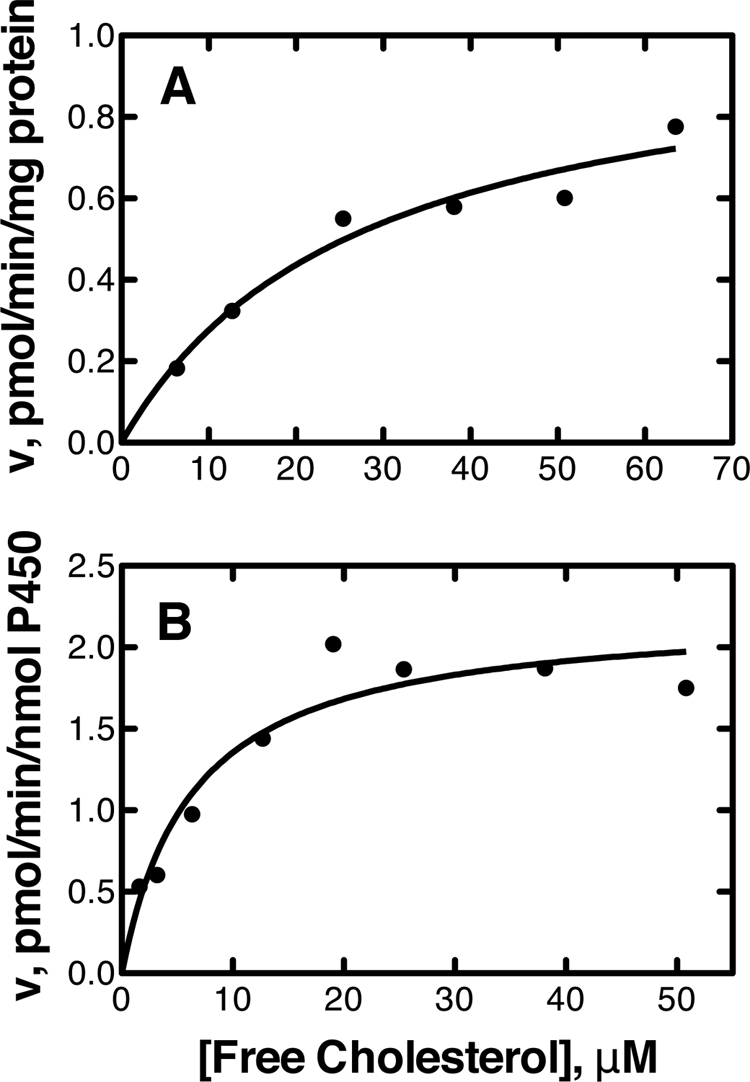
Rates of cholesterol 4β-hydroxylation by human liver microsomes and recombinant P450 3A4. The resulting data points were fit to the Michaelis-Menten equation (GraphPad Prism software). A, microsomes (Km = 27 ± 9 μm and Vmax = 1.0 ± 0.2 pmol/min/mg of protein); B, recombinant P450 3A4 (Km = 6.4 ± 2.1 μm and kcat = 2.2 ± 0.2 pmol/min/nmol of P450).
Cholesterol Binding to P450 3A4
Binding of cholesterol to P450 3A4 induced a substrate-type (“Type I”) difference spectrum (Fig. 2, inset) (37). The calculated ΔAmax/nmol of P450 and Kd values (hyperbolic binding model) were 0.005 ± 0.001 and 8.3 ± 1.0 μm, respectively (Fig. 2).
FIGURE 2.

Binding of cholesterol to P450 3A4. Titration of 2.0 μm P450 3A4 was done with increasing concentrations of cholesterol (in the presence of 3.1 mm HPβCD). The plot (——) is a fit of the changes in absorbance (●) versus the calculated free cholesterol concentration using a hyperbolic binding equation (GraphPad Prism software). The inset shows the spectral changes. Kd = 8.3 ± 1.0 μm. Averaged absorbance values were used to analyze the data, i.e. A390 means the averaged value of absorbance data between 389 and 391 nm, and A413 means the averaged value of data between 412 and 414 nm.
Inhibitory Effect of Cholesterol on P450 3A4 Activity in Human Liver Microsomes and a Reconstituted System
Lineweaver-Burk plots for nifedipine metabolism in human liver microsomes (with varying cholesterol concentrations) indicated that the inhibition type of cholesterol was apparently non-competitive (supplemental Fig. S1). However, the plots of nifedipine concentrations versus nifedipine oxidation rates in human liver microsomes could not be fit well to the basic non-competitive inhibition model (Equation 1). Instead of this model, the non-competitive model including an exponent (Hill coefficient) was used (Equation 2). This model provided a good fit to the curve, and the calculated Ki value and the Hill coefficient were 11.4 ± 0.3 μm and 2.8 ± 0.2, respectively (Fig. 3A and Table 1). On the other hand, plots of nifedipine concentrations versus nifedipine oxidation rates in the P450 3A4-reconstituted system could be fit well to the basic non-competitive inhibition model (Equation 1), with a Ki value of 9.2 ± 0.3 μm (Fig. 4A, Table 1, and supplemental Fig. S2).
FIGURE 3.
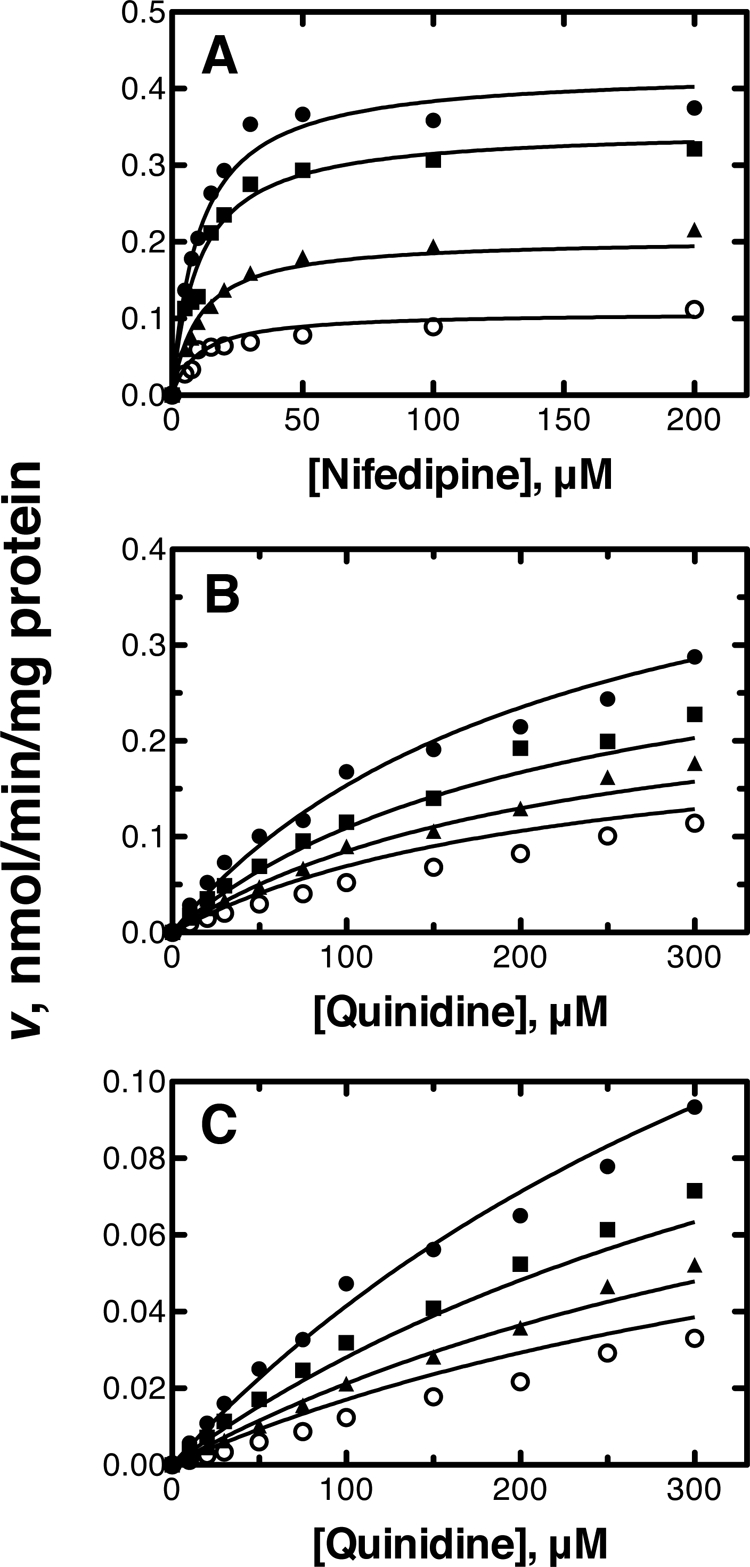
Inhibitory effects of cholesterol in human liver microsomes. A, nifedipine oxidation (5–200 μm); B, quinidine 3S-hydroxylation (10–300 μm); C, quinidine N-oxidation (10–300 μm). The data points represent means of duplicate determinations. The lines represent a simultaneous fit to the corresponding models defined under “Experimental Procedures” at free cholesterol concentrations of 1.5, 6.6, 11.7, and 16.8 μm. See Table 1 for Ki values.
TABLE 1.
Calculated Ki values of cholesterol for activities of human P450 3A4
| Enzyme source | Ki | Hill constant | Apparent inhibition type |
|---|---|---|---|
| μm | |||
| Nifedipine oxidation | |||
| Human liver microsomes | 11.4 ± 0.3a | 2.8 ± 0.2a | Non-competitive |
| Reconstituted system | 9.2 ± 0.3b | Non-competitive | |
| Quinidine 3S-hydroxylation | |||
| Human liver microsomes | 11.1 ± 1.0b | Non-competitive | |
| Reconstituted system | 9.1 ± 0.6b | Non-competitive | |
| Quinidine N-oxidation | |||
| Human liver microsomes | 9.2 ± 0.7b | Non-competitive | |
| Reconstituted system | 15.0 ± 0.8b | Non-competitive | |
a The Ki value was calculated using Equation 2 under “Experimental Procedures.”
b The Ki value was calculated using Equation 1 under “Experimental Procedures.”
FIGURE 4.
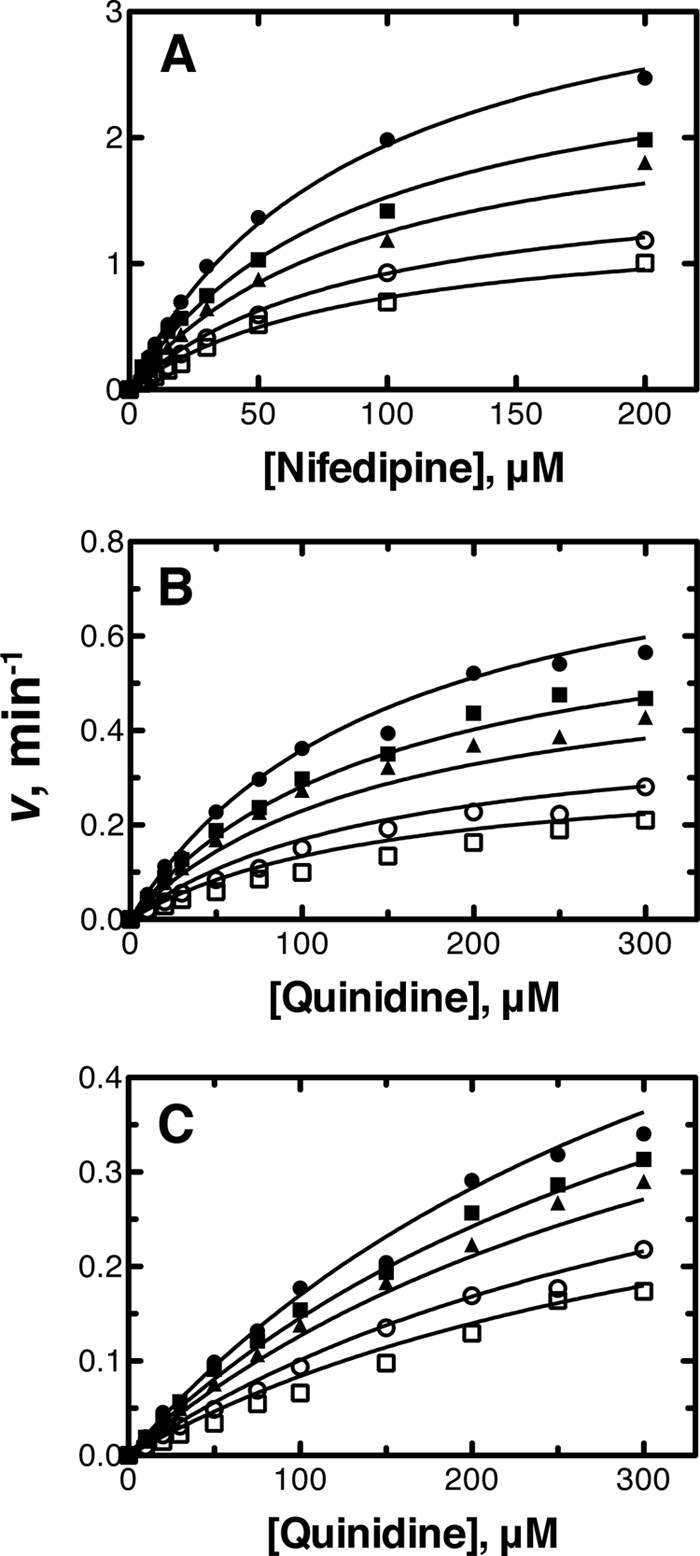
Inhibitory effects of cholesterol on recombinant P450 3A4. A, nifedipine oxidation (5–200 μm); B, quinidine 3S-hydroxylation (10–300 μm); C, quinidine N-oxidation (10–300 μm). The data points represent the means of duplicate determinations. The lines represent a simultaneous fit to the corresponding models defined under “Experimental Procedures” at free cholesterol concentrations of 0, 2.5, 5.1, 10.2, and 15.3 μm. See Table 1 for Ki values.
Cholesterol showed apparent non-competitive inhibition with quinidine 3S-hydroxylation activity in both human liver microsomes and the reconstituted system. The Ki values were calculated as 11.1 ± 1.0 and 9.1 ± 0.6 μm, respectively, with good fitting to the basic non-competitive inhibition model (Equation 1) (Figs. 3B and 4B, Table 1, and supplemental Figs. S1 and S2).
The inhibition of quinidine N-oxidation by cholesterol in both enzyme sources was also apparently non-competitive. The Ki values calculated with the basic non-competitive inhibition model (Equation 1) were 9.2 ± 0.7 and 15.0 ± 0.8 μm, respectively (Figs. 3C and 4C, Table 1, and supplemental Figs. S1 and S2).
Effect of Cholesterol on P450 3A4 Activity in Hepatocytes
Cholesterol concentrations were quantified in a preliminary study in hepatocytes (lot Hu1126) following treatment with 200 μm cholesterol or 30 μm pravastatin (supplemental Fig. S3). The cholesterol amount in the cells treated with 200 μm cholesterol was increased up to 48 h, and that in the cells treated with 30 μm pravastatin was decreased by up to 30% after 24 and 48 h. However, lactate dehydrogenase leakage from the cells after a 48-h treatment with either cholesterol or pravastatin was increased, although that after a 24-h treatment was not changed (data not shown). These results indicated that a 24-h treatment with cholesterol or pravastatin could modify the cholesterol amount in the cells without causing cytotoxicity. The P450 3A4 contents in human hepatocytes (lots Hu1126 and Hu4242) after a 24-h treatment with 200 μm cholesterol (or 30 μm pravastatin) were not significantly changed compared with those in the cells without any treatment (Table 2).
TABLE 2.
Cholesterol and P450 3A4 levels in human hepatocytes
| Treatment | Cholesterol | P450 3A4 |
|---|---|---|
| nmol/106 cells | pmol/mg protein | |
| Hu1126 cells | ||
| No treatment | 8.7 ± 0.5 | 15.8 ± 2.6 |
| 200 μm cholesterol | 36.1 ± 1.7 | 12.8 ± 0.6 |
| Hu4242 cells | ||
| No treatment | 3.7 ± 0.8 | 46.6 ± 1.6 |
| 200 μm cholesterol | 23.8 ± 2.2 | 42.7 ± 5.2 |
The nifedipine oxidation activities of human hepatocytes were measured after a 24-h treatment with 200 μm cholesterol. Nifedipine oxidation activities in the cells (lot Hu1126) treated with 200 μm cholesterol were significantly decreased (59%) compared with the activities in the cells that received no treatment (Fig. 5A). Nifedipine oxidation activity in the Hu4242 cells treated with 200 μm cholesterol was significantly decreased (by 63%) (Fig. 5B).
FIGURE 5.

Effects of cholesterol levels on P450 3A4 catalytic activity in human hepatocytes. Human hepatocytes (lots Hu1126 and Hu4242) were treated with FBS-free Hepato-STIM medium (open bars; no treatment) or 200 μm cholesterol in FBS-free Hepato-STIM medium (closed bars) for 24 h. The catalytic activities of human hepatocytes for nifedipine (in FBS-free Hepato-STIM medium) were measured with a 30-min incubation. A, nifedipine oxidation in Hu1126 cells; B, nifedipine oxidation in Hu4242 cells. Error bars represent means ± S.D. of quadruplicate determinations. *, p < 0.05; **, p < 0.005.
DISCUSSION
The purpose of this study was to determine the inhibitory effects of cholesterol on cytochrome P450 3A4, the major human P450 in liver and small intestine, in light of reports that cholesterol is a substrate for 4β-hydroxylation by P450 3A4 (Fig. 1) (9–11). Cholesterol was shown to bind to P450 3A4 (Kd = 8 μm) (Fig. 2) and to inhibit prototypic P450 3A4 reactions with a Ki value of ∼10 μm (Figs. 3 and 4 and Table 1). These results, considered in the context of the known concentration of cholesterol in liver, suggest that cholesterol inhibition occurs in cells. Raising the level of cholesterol in cultured human hepatocytes resulted in the inhibition of nifedipine oxidation by P450 3A4 (Fig. 5).
Cholesterol inhibition studies were done with human liver microsomes and a purified enzyme system (reconstituted with NADPH-cytochrome P450 reductase and cytochrome b5). Steroids (e.g. testosterone) and other hydrophobic substrates could not be utilized as substrates in these assays because they are bound to HPβCD, resulting in the inhibition of hydroxylation activity in the absence of cholesterol. Therefore, we used the drug nifedipine, the first P450 3A4 substrate identified (7). HPβCD did not inhibit nifedipine or quinidine oxidation activity. The inhibition of these activities by cholesterol appeared to be non-competitive, and the data were fit to a classic model (Equation 1) to obtain Ki values (Table 1). In the case of the results obtained with liver microsomes (Fig. 3 and supplemental Fig. S1), a poor fit was obtained but could be improved by the inclusion of an exponent (Hill factor) (Equation 2). However, we do not have a specific physical interpretation of this factor for inhibition, as in the case of Hill coefficients applied to cooperative phenomena observed with P450 3A4 substrates (2, 15, 38).
Although the simplistic view of non-competitive inhibition is that the inhibitor is interacting at a site distinct from that of the substrate (39), a number of possibilities exist (Fig. 6) (25), particularly in a case in which there is extensive evidence for the presence of multiple ligands in a large active site (15, 16, 23, 40). In the model shown in Fig. 6, the substrate is nifedipine or quinidine (S). Cholesterol is the inhibitor (I), but it is also a substrate (the EI′ complex). However, in the configurations of EI and ESI, cholesterol (I) can block the oxidation of other substrates without being in the “S” site. This model comes from the classic text of Segel (41) and can explain the results observed here. Furthermore, the proposed proclivity for multiple modes of binding can explain the relatively weak absorbance changes observed when cholesterol binds to P450 (Fig. 2) in that only a small population of the modes of binding could result in H2O displacement (as an iron ligand) and spin-state shift. The multiplicity of configurations would also be an issue contributing to the low rate of catalysis, i.e. 4β-hydroxylation (Fig. 1).
FIGURE 6.
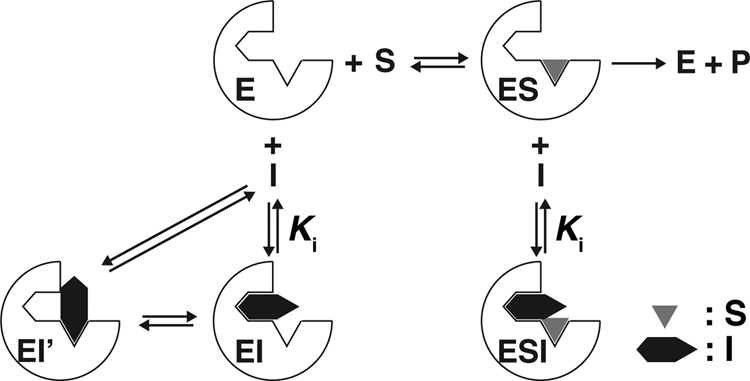
Proposed model for apparent non-competitive inhibition by cholesterol on P450 3A4 activities. E, P450 3A4; I, cholesterol; P, product; S, substrate; EI, P450 3A4-cholesterol complex; EI′, P450 3A4-cholesterol complex showing 4β-hydroxylation activity toward cholesterol; ES, P450 3A4-substrate complex, ESI, P450 3A4-substrate-cholesterol ternary complex.
As in the general case of prediction of drug-drug interactions involving P450 and other enzymes, the Ki can be compared with the estimated free concentration of the inhibitor. A typical concentration of total cholesterol in human serum is ∼5 mm (i.e. 20 mg/ml or 200 mg/dl). One estimate of the amount of unesterified cholesterol in human liver is 840 μmol, based only on the concentration of unesterified cholesterol in human liver microsomes (∼56 nmol/mg of protein) (33) multiplied by a typical recovery factor of 10 mg of microsomal protein/g of liver (42). For a liver (of 1.5 kg), this would give an “average” concentration of 560 μm. Our own work with human liver microsomes showed a mean value of 56 pmol of unesterified cholesterol/mg of microsomal protein or ∼100 nmol of free (unesterified) cholesterol/nmol of (total) P450. Some of the cholesterol is bound to lipoprotein complexes, so the exact concentration of free cholesterol is not precisely known. Another approach to the estimation is to consider the solubility of cholesterol in buffer (5.2 μm) (43), although this value may not be appropriate in considering the overall equilibrium among various proteins. However, using a conservative value of 5 μm for an “effective” cholesterol concentration and a Ki value of 10 μm, Equation 1 would predict an increase in the “area under the curve” (integral) for an in vivo pharmacokinetic profile of 50% (i.e. 50% more exposure of the tissues to drug). If cholesterol were treated as an experimental drug candidate in development, this degree of inhibition would suggest caution. It is possible that the effective concentration of free cholesterol that P450 3A4 encounters is higher, given the ratio of 100 nmol of unesterified cholesterol/nmol of P450 in liver microsomal membranes. To put this in perspective, the decrease in nifedipine oxidation activity observed in the hepatocytes was ∼60% (Fig. 5) after raising the cholesterol concentration. However, this experiment did not directly address the question of how much inhibition was produced by the basal level of cholesterol in the hepatocytes.
Use of an animal model to test the hypothesis that cholesterol inhibits P450 3A4 function in cells would not be trivial in that P450 3A4 is not present in mice, and mice contain seven subfamily 3A P450 enzymes, thus requiring a complex transgenic model. Accordingly, we designed experiments with cultured human hepatocytes and modulated the level of cholesterol in the cells. We considered reducing the level of cholesterol in the hepatocytes with the use of statin inhibitors of 3-hydroxymethylglutaryl-CoA reductase, but many of the statins are P450 3A4 substrates themselves and could not be used (44). Pravastatin is not a P450 3A4 substrate, but we were able to achieve an attenuation of only ∼30% of the cholesterol level with this statin in the cells (supplemental Fig. S3), which is very significant clinically but in subsequent experiments was not sufficient to modify rates of nifedipine oxidation (at least at the level of statistical significance) (data not shown). Cholesterol levels in the hepatocytes could be elevated 4–6-fold by incubation with 200 μm cholesterol, concordant with the knowledge that hepatocytes are known to have active cholesterol uptake transporters (45).
Three individual lots of cultured human hepatocytes were used in this work. In one set, the viability decreased during the course of the experiment and was reversed by the presence of the added cholesterol, thus confounding any interpretation of results (data not shown). In the other two sets of experiments, nifedipine oxidation (a P450 3A4 marker) (7) was significantly decreased when the level of cholesterol increased (Fig. 5). Nifedipine oxidation is considered a classic and reliable marker of P450 3A4 (7); we have not extended these studies to other substrates.
In summary, we evaluated the inhibitory effect of cholesterol on P450 3A4 activities in human liver microsomes, a reconstituted system, and human hepatocytes. Cholesterol showed apparent non-competitive inhibition toward three oxidation reactions catalyzed by P450 3A4, with Ki values comparable with that of the clinically established typical P450 3A4 inhibitor verapamil (46). The increased cholesterol could cause attenuation of P450 3A4 activity in hepatocytes (Fig. 5), indicating that cholesterol in human liver could affect the metabolism of drugs and other compounds by P450 3A4. This conclusion is relevant to the basal level of cholesterol as well as elevated levels.
Supplementary Material
This work was supported, in whole or in part, by National Institutes of Health Grants R37 CA090426 and P30 ES000267 (to F. P. G.). This work was also supported by Eisai Co., Ltd. (to R. S.).

The on-line version of this article (available at http://www.jbc.org) contains supplemental Figs. S1–S3.
- dansyl
- 5-dimethylaminonaphthalene-1-sulfonyl
- HPβCD
- 2-hydroxypropyl-β-cyclodextrin.
REFERENCES
- 1. Ortiz de Montellano P. R. (ed) (2005) Cytochrome P450: Structure, Mechanism, and Biochemistry, 3rd Ed., Plenum Pless, New York [Google Scholar]
- 2. Guengerich F. P. (2005) in Cytochrome P450: Structure, Mechanism, and Biochemistry (Ortiz de Montellano P. R. ed), 3rd Ed., pp. 377–530, Plenum Press, New York [Google Scholar]
- 3. Williams J. A., Hyland R., Jones B. C., Smith D. A., Hurst S., Goosen T. C., Peterkin V., Koup J. R., Ball S. E. (2004) Drug Metab. Dispos. 32, 1201–1208 [DOI] [PubMed] [Google Scholar]
- 4. Wienkers L. C., Heath T. G. (2005) Nat. Rev. Drug Discov. 4, 825–833 [DOI] [PubMed] [Google Scholar]
- 5. Shimada T., Guengerich F. P. (1989) Proc. Natl. Acad. Sci. U.S.A. 86, 462–465 [DOI] [PMC free article] [PubMed] [Google Scholar]
- 6. Ueng Y. F., Shimada T., Yamazaki H., Guengerich F. P. (1995) Chem. Res. Toxicol. 8, 218–225 [DOI] [PubMed] [Google Scholar]
- 7. Guengerich F. P., Martin M. V., Beaune P. H., Kremers P., Wolff T., Waxman D. J. (1986) J. Biol. Chem. 261, 5051–5060 [PubMed] [Google Scholar]
- 8. Waxman D. J., Attisano C., Guengerich F. P., Lapenson D. P. (1988) Arch. Biochem. Biophys. 263, 424–436 [DOI] [PubMed] [Google Scholar]
- 9. Bodin K., Bretillon L., Aden Y., Bertilsson L., Broomé U., Einarsson C., Diczfalusy U. (2001) J. Biol. Chem. 276, 38685–38689 [DOI] [PubMed] [Google Scholar]
- 10. Bodin K., Andersson U., Rystedt E., Ellis E., Norlin M., Pikuleva I., Eggertsen G., Björkhem I., Diczfalusy U. (2002) J. Biol. Chem. 277, 31534–31540 [DOI] [PubMed] [Google Scholar]
- 11. Diczfalusy U., Nylén H., Elander P., Bertilsson L. (2011) Br. J. Clin. Pharmacol. 71, 183–189 [DOI] [PMC free article] [PubMed] [Google Scholar]
- 12. Guengerich F. P., Kim B.-R., Gillam E. M. J., Shimada T. (1994) in Proceedings of the Eighth International Conference on Cytochrome P450: Biochemistry, Biophysics, and Molecular Biology (Lechner M. C. ed) pp. 97–101, John Libbey Eurotext, Paris [Google Scholar]
- 13. Shou M., Grogan J., Mancewicz J. A., Krausz K. W., Gonzalez F. J., Gelboin H. V., Korzekwa K. R. (1994) Biochemistry 33, 6450–6455 [DOI] [PubMed] [Google Scholar]
- 14. Sligar S. G., Denisov I. G. (2007) Drug Metab. Rev. 39, 567–579 [DOI] [PubMed] [Google Scholar]
- 15. Ueng Y. F., Kuwabara T., Chun Y. J., Guengerich F. P. (1997) Biochemistry 36, 370–381 [DOI] [PubMed] [Google Scholar]
- 16. Hosea N. A., Miller G. P., Guengerich F. P. (2000) Biochemistry 39, 5929–5939 [DOI] [PubMed] [Google Scholar]
- 17. Shou M., Dai R., Cui D., Korzekwa K. R., Baillie T. A., Rushmore T. H. (2001) J. Biol. Chem. 276, 2256–2262 [DOI] [PubMed] [Google Scholar]
- 18. Dabrowski M. J., Schrag M. L., Wienkers L. C., Atkins W. M. (2002) J. Am. Chem. Soc. 124, 11866–11867 [DOI] [PubMed] [Google Scholar]
- 19. Baas B. J., Denisov I. G., Sligar S. G. (2004) Arch. Biochem. Biophys. 430, 218–228 [DOI] [PubMed] [Google Scholar]
- 20. Isin E. M., Guengerich F. P. (2006) J. Biol. Chem. 281, 9127–9136 [DOI] [PubMed] [Google Scholar]
- 21. Williams P. A., Cosme J., Vinkovic D. M., Ward A., Angove H. C., Day P. J., Vonrhein C., Tickle I. J., Jhoti H. (2004) Science 305, 683–686 [DOI] [PubMed] [Google Scholar]
- 22. He Y.-A., Gajiwala K. S., Wu M., Parge H., Burke B., Lee C. A., Wester M. R. (2006) Proceedings of the Sixteenth International Symposium on Microsomes Drug Oxidations (MDO 2006), Budapest, Hungary, September 3–7, 2006 [Google Scholar]
- 23. Ekroos M., Sjögren T. (2006) Proc. Natl. Acad. Sci. U.S.A. 103, 13682–13687 [DOI] [PMC free article] [PubMed] [Google Scholar]
- 24. Guengerich F. P. (2009) in Inhibition of Drug Metabolizing Enzymes: Molecular and Biochemical Aspects (Wienkers L., Pearson P. eds) 2nd Ed., pp, 203–226, Marcel Dekker, New York [Google Scholar]
- 25. Segel I. H. (1975) Enzyme Kinetics: Behavior and Analysis of Rapid Equilibrium and Steady-state Enzyme Systems, John Wiley & Sons, New York [Google Scholar]
- 26. Böcker R. H., Guengerich F. P. (1986) J. Med. Chem. 29, 1596–1603 [DOI] [PubMed] [Google Scholar]
- 27. Gillam E. M., Baba T., Kim B. R., Ohmori S., Guengerich F. P. (1993) Arch. Biochem. Biophys. 305, 123–131 [DOI] [PubMed] [Google Scholar]
- 28. Hanna I. H., Teiber J. F., Kokones K. L., Hollenberg P. F. (1998) Arch. Biochem. Biophys. 350, 324–332 [DOI] [PubMed] [Google Scholar]
- 29. Guengerich F. P. (2005) Arch. Biochem. Biophys. 440, 204–211 [DOI] [PubMed] [Google Scholar]
- 30. Shaw P. M., Hosea N. A., Thompson D. V., Lenius J. M., Guengerich F. P. (1997) Arch. Biochem. Biophys. 348, 107–115 [DOI] [PubMed] [Google Scholar]
- 31. Guengerich F. P., Bartleson C. J. (2007) in Principles and Methods of Toxicology (Hayes A. W. ed) 5th Ed., pp, 1981–2048, CRC Press, Boca Raton, FL [Google Scholar]
- 32. Tang Z., Guengerich F. P. (2010) Anal. Chem. 82, 7706–7712 [DOI] [PMC free article] [PubMed] [Google Scholar]
- 33. Shinkyo R., Guengerich F. P. (2011) J. Biol. Chem. 286, 4632–4643 [DOI] [PMC free article] [PubMed] [Google Scholar]
- 34. Laemmli U. K. (1970) Nature 227, 680–685 [DOI] [PubMed] [Google Scholar]
- 35. Soucek P., Martin M. V., Ueng Y. F., Guengerich F. P. (1995) Biochemistry 34, 16013–16021 [DOI] [PubMed] [Google Scholar]
- 36. Mast N., Pikuleva I. A. (2005) J. Lipid Res. 46, 1561–1568 [DOI] [PubMed] [Google Scholar]
- 37. Schenkman J. B., Remmer H., Estabrook R. W. (1967) Mol. Pharmacol. 3, 113–123 [PubMed] [Google Scholar]
- 38. Sohl C. D., Isin E. M., Eoff R. L., Marsch G. A., Stec D. F., Guengerich F. P. (2008) J. Biol. Chem. 283, 7293–7308 [DOI] [PubMed] [Google Scholar]
- 39. Dixon M., Webb E. C. (1964) Enzymes, 2nd Ed., Longman's, Green and Co., London [Google Scholar]
- 40. Yano J. K., Wester M. R., Schoch G. A., Griffin K. J., Stout C. D., Johnson E. F. (2004) J. Biol. Chem. 279, 38091–38094 [DOI] [PubMed] [Google Scholar]
- 41. Segel I. H. (1975) Enzyme Kinetics: Behavior and Analysis of Rapid Equilibrium and Steady-state Enzyme Systems, p. 109, John Wiley & Sons, New York [Google Scholar]
- 42. Guengerich F. P. (1990) Chem. Res. Toxicol. 3, 363–371 [DOI] [PubMed] [Google Scholar]
- 43. O'Neil M. J. (2001) Merck Index, 13th Ed., p. 2223, Merck Research Laboratories, Whitehouse Station, NJ [Google Scholar]
- 44. Wang R. W., Kari P. H., Lu A. Y., Thomas P. E., Guengerich F. P., Vyas K. P. (1991) Arch. Biochem. Biophys. 290, 355–361 [DOI] [PubMed] [Google Scholar]
- 45. Garcia-Calvo M., Lisnock J., Bull H. G., Hawes B. E., Burnett D. A., Braun M. P., Crona J. H., Davis H. R., Jr., Dean D. C., Detmers P. A., Graziano M. P., Hughes M., Macintyre D. E., Ogawa A., O'Neill K. A., Iyer S. P., Shevell D. E., Smith M. M., Tang Y. S., Makarewicz A. M., Ujjainwalla F., Altmann S. W., Chapman K. T., Thornberry N. A. (2005) Proc. Natl. Acad. Sci. U.S.A. 102, 8132–8137 [DOI] [PMC free article] [PubMed] [Google Scholar]
- 46. Ohno Y., Hisaka A., Suzuki H. (2007) Clin. Pharmacokinet. 46, 681–696 [DOI] [PubMed] [Google Scholar]
Associated Data
This section collects any data citations, data availability statements, or supplementary materials included in this article.