

Abstract
Fibroblast growth factor receptor-3 (FGFR-3) expression in the developing intestine is restricted to the undifferentiated epithelial cells within the lower portion of the crypt. We previously showed that mice lacking functional FGFR-3 have a significant decrease in the number of Paneth cells in the small intestine. Here, we used Caco2 cells to investigate whether FGFR-3 signaling can directly modulate expression of Paneth cell differentiation markers through its effects on TCF4/β-catenin or through other signaling pathways downstream of this receptor. Caco2 cells treated with FGFR-3 ligands or expressing FGFR-3K650E, a constitutively active mutant, resulted in a significantly increased expression of genes characteristic of mature Paneth cells, including human α-defensins 5 and 6 (HD5 and HD6) and Paneth cell lysozyme, whereas enterocytic differentiation markers were reduced. Activation of FGFR-3 signaling sustained high levels of β-catenin mRNA expression, leading to increased TCF4/β-catenin-regulated transcriptional activity in Caco2 cells. Sustained activity of the TCF4/β-catenin pathway was required for the induction of Paneth cell markers. Activation of the MAPK pathway by FGFR-3 is also required for the induction of Paneth cell markers in addition to and independent of the effect of FGFR-3 on TCF4/β-catenin activity. These studies suggest that coordinate activation of multiple independent signaling pathways downstream of FGFR-3 is involved in regulation of Paneth cell differentiation.
Keywords: Beta-Catenin, Defensins, Differentiation, Epithelial Cell, MAP Kinases (MAPKs), FGF Receptor-3, Paneth Cells
Introduction
Paneth cells are granulated, relatively long lived cells found at the base of small intestinal crypts that arise by differentiation of secretory progenitor cells (1). They are most abundant in the terminal ileum and not present in the normal colon (1, 2). Paneth cells are key effectors of innate mucosal immunity (3–5). These cells produce a variety of microbicidal peptides, such as lysozyme, phospholipase A2, α-defensins in humans and cryptdins in mice, and RegIIIγ, that are secreted into the lumen and neutralize invading microorganisms (3, 6) Consistent with their role in innate immunity in the intestine, several studies have shown that dysregulation of Paneth cell function is associated with chronic intestinal inflammation in animal models of ileitis and with Crohn's disease in humans (7, 8). Experimentally induced alterations of Paneth cell expression of α-defensins also lead to changes in the composition of the intestinal microbiota and modulation of proinflammatory T-cell populations in the intestinal mucosa (8). Thus, the localization of normally functional Paneth cells adjacent to epithelial stem cells in the crypt renders them ideally positioned to ensure the integrity of the intestinal epithelium, by protecting stem cell viability against luminal bacterial challenge. Additionally, Paneth cells may play a role in stem cell homeostasis by providing signals necessary for maintaining the intestinal stem cell niche.
Despite the critical importance of Paneth cells in maintaining gut homeostasis, knowledge of the pathways regulating Paneth cell differentiation and function has only recently begun to emerge. Studies using transgenic mice or mice with targeted mutations in epithelial regulatory genes, including components of the Wnt signaling pathway (Tcf4, Fz5, Sox9, and Apc), FGFR-3, and PPARβ/δ, have identified these genes as key regulators of Paneth cell differentiation and expression of defensin peptides in vivo (9–14). However, the lack of an adequate intestinal epithelial cell culture system that can recapitulate features of Paneth cell differentiation and maturation has hampered direct investigation of how these signaling pathways may interact in regulating Paneth cell differentiation and functional maturation.
We recently reported that signaling through FGFR-3 in crypt epithelial cells regulates both the number of epithelial stem cells and Paneth cell differentiation during postnatal gut development (13, 15). FGFR-3 is highly expressed along the membranes of cells in the lower portion of the crypt in the developing mouse intestine (15). FGFRs are members of the receptor-tyrosine kinase family. Ligand binding induces dimerization, autophosphorylation, and initiation of a signal transduction cascade that ultimately results in modification of gene expression. Ligands for FGFR-3, FGF1, FGF2, and FGF9, are up-regulated in the postnatal murine small intestine from birth through the suckling weaning transition, when crypt morphogenesis is occurring (15). By postnatal day 21, FGFR-3−/− mice show a marked deficit in a number of Paneth cell markers and a significant reduction in the number of lysozyme-positive Paneth cells. Additionally, these mice also have a reduced number of intestinal crypts compared with wild-type mice that is a reflection of diminished numbers of crypt stem cells (13). These data suggest that FGFR-3-mediated signaling events play a role in the developmental regulation of the stem cell compartment as well as in the commitment of progenitor cells to Paneth cell lineage-specific differentiation.
Although the Wnt pathway has emerged as the master regulator for maintaining the undifferentiated crypt stem cell compartment, paradoxically, signaling through this pathway also regulates differentiation of the Paneth cell lineage (16–19). Paneth cells positioned at the crypt base display a high level of Wnt signaling, although they do not divide (12). Thus, the Wnt signal in Paneth cells, delivered by the Frizzled-5 (Fz5) receptor, drives cellular maturation of Paneth cells that have been allocated to that lineage. Although Wnt is the most well known regulator of TCF4/β-catenin signaling, other growth factors, such as the FGFR-3 ligands FGF2 and FGF9, can also mediate signaling via this pathway (13, 20).
FGFRs can signal through a multitude of different signaling pathways, depending on the cell type and maturational stage of the cell. The best characterized of these pathways are the MAPK pathway, including ERK1/2, p38, and JNK kinases; the PI3K-Akt pathway; and the phospholipase Cγ pathway (21). To investigate whether these signaling pathways interact with the Wnt-mediated TCF4/β-catenin complex in regulating the expression of markers of Paneth cell differentiation, we used Caco2, a colon carcinoma derived epithelial cell line that expresses FGFR-3 (22), as a functional model of small intestinal differentiation. Upon reaching confluence in culture, this cell line expresses markers characteristic of the absorptive cell lineage of the small intestine, mimicking some of the phenotypic changes that occur as enterocytes differentiate, concomitant with the down-regulation of TCF4/β-catenin transcriptional activity (23–25). Here we demonstrate that 1) signaling through FGFR-3 induces de novo expression of markers of the Paneth cell lineage and down-regulates markers characteristic of the absorptive enterocyte lineage; 2) induction of Paneth cell differentiation markers by FGFR-3 is dependent on its ability to maintain high levels of β-catenin mRNA expression and sustained activation of the TCF4/β-catenin signaling pathway; 3) activation of the TCF4/β-catenin signaling pathway by itself is not sufficient to induce the expression of Paneth cell lineage markers; and 4) ERK1/2 and p38 MAPK are required for the expression of markers of Paneth cell differentiation independent of the effects of FGFR-3 on TCF4/β-catenin signaling. This novel Caco2 model of Paneth cell maturation may provide a means to identify and characterize the pathways that play a role in this process and that interact with FGFR-3 to effect Paneth cell-specific gene expression in the intestine.
MATERIALS AND METHODS
Cell Culture
Caco2 cells obtained from the ATCC (Manassas, VA) were grown in a humidified atmosphere with 5% CO2 in T25 flasks. Culture medium was minimal essential medium with Earle's balanced salt solution (Invitrogen) containing 0.1 mm nonessential amino acids and 1.5 g/liter sodium bicarbonate, 0.75 g/liter sodium pyruvate, supplemented with 10% bovine growth serum (Hyclone, Logan, UT). Cultures were used between passages 6 and 16. For all experiments, cells were plated at a subconfluent cell density onto Millicell hanging filter inserts (3-μm pore size, Polyethylene Terephthalate, Millipore, Billerica, MA) and grown for the times indicated in the data figures. Monolayer resistance, measured daily with the EVOM2 ohm meter (World Precision Instruments, Sarasota, FL) was used as a measure of culture confluence. FGF9 (50 ng/ml), FGF2 (10 ng/ml), and FGF18 (50 ng/ml) (R&D Systems, Minneapolis, MN) solubilized in culture medium containing heparin sodium salt (1.25 μg/ml; Sigma) were added to both sides of the filter unless otherwise indicated. FGFs were added daily, beginning at 24 h postplating and until cells were harvested for assay (time points shown in the figures). Small molecule inhibitors for PI3K (10 μm LY 294002), p38 (5 μm SB 203580), and MEK1/2 (5 μm UO126) were purchased from Calbiochem. Inhibitors were added to the culture medium 30 min prior to FGF9 addition and 24 h prior to either luciferase assay or HD5 mRNA expression assayed by quantitative RT-PCR. To inhibit glycogen synthase kinase 3β (GSK3β), LiCl was added to the medium daily at a final concentration of 10 mm. Medium was changed every 24 h for subsequent Western blot and quantitative RT-PCR assays. For luciferase activity, LiCl was added to cells transiently transfected with the TCF4 reporter plasmid, pTOPFlash, in Opti-MEM I (Invitrogen) 24 h after transfection. EGF (50 ng/ml final concentration) added daily beginning at 24 h postplating and until cells were collected after 96 h of EGF treatment was used to stimulate the MAPK pathway independently of FGFR-3. For assessment of phospho-ERK1/2, cultures were incubated with EGF (50 ng/ml) for 5 min before total protein extraction. Some cultures received both EGF and LiCl at the final concentrations given above. To inhibit destruction of ubiquitinated phospho-β-catenin some cultures were treated with the proteasome inhibitor MG132 (Sigma). Twenty-four hours postplating, cells were preincubated for 4 h with MG132 (10 μm), followed by 24 h of treatment with FGF9 (50 ng/ml final) before harvesting.
Transient Transfection Protocol
Caco2 cells grown as described above were trypsinized, recovered by centrifugation, resuspended in Opti-MEM I (Invitrogen), and transfected using siLentFect reagent (Bio-Rad). Cells were transfected with 3 μg of the TCF4 reporter plasmid, pTOPFlash, and 3 μg of pUC18 containing one of the following FGFR-3 constructs (kindly provided by DJ Donoghue): 1) a plasmid (FGFR-3WT) that encodes a myristoylation signal linked to the juxtamembrane and intracellular domains of wild-type FGFR-3 (amino acid residues 399–806) to target this receptor to the plasma membrane, thereby yielding a ligand-independent receptor; 2) FGFR-3K650E, encoding a constitutively active mutant of the FGFR-3WT plasmid described above; or 3) FGFR-3K508R, encoding a kinase dead mutant of the FGFR-3WT plasmid described above (26, 27). Control cells were transfected with pUC18, the empty vector. Some cultures that were transfected with pTOPFlash also received daily additions of FGF9 (final concentration 50 ng/ml) (R&D Systems) starting at 24 h post-transfection and ending at 96 h post-transfection (2 days postconfluence). A plasmid expressing Renilla luciferase was included as an internal control for transfection efficiency. Luciferase activity was assayed with the Dual Glo luciferase assay system (Promega, Madison, WI) at 48, 72, 96, and 120 h post-transfection, at which times cultures were confluent, 1, 2, and 3 days postconfluence, respectively. Samples were read using the VeritasTM microplate luminometer (Turner Biosystems, Sunnyvale, CA). Some cultures were co-transfected with plasmids expressing dominant negative TCF4 (dnTCF4; see supplemental material) or shRNA for β-catenin (plasmids kindly provided by Dr. van de Wetering) (28).
Lentiviral Packaging Protocol
For lentiviral packaging, the coding sequences of FGFR-3WT, FGFR-3K650E, and FGFR-3K508R described above were cloned into the pBOB vector. To insert the FGFR-3 mutant constructs into the pBOB lentiviral vector, restriction enzyme sites AgeI and PstI were used. The FGFR-3 sequences were confirmed to be correct using dideoxynucleotide sequencing. The pBOB vector contains a CMV promoter-driven cassette followed by an IRES and GFP coding sequence, which allows bicistronic expression of GFP with the target gene. This permits infected cells to be visualized by immunofluorescent detection of GFP. HEK293T cells at 50% confluence were used to generate lentivirus particles with the appropriate FGFR-3 constructs as described (29) with modification. The pBOB lentiviral vector and packaging vectors were a kind gift from Dr. Chen Li (University of Virginia, Charlottesville, VA). Briefly, 10-cm dishes were coated with 0.001% poly-l-lysine. Per 10-cm dish, the following amounts of DNA were used: 1) 6.5 μg of pMDL/RRE, 2) 2.5 μg of pRSV.REV, 3) 3.5 μg of pVSVG, and 4) 10 μg of either pBOB, FGFR-3WT, FGFR-3K650E, or FGFR-3K508R. The specified amount of DNA was mixed with 1.5 ml of Opti-MEM I and combined with 30 μl of Lipofectamine 2000 (Invitrogen) mixed with 1.5 ml of Opti-MEM I for 20 min at room temperature. The Lipofectamine/DNA mixture was then combined with 6 × 10⁶ HEK293T cells resuspended in 7 ml of Opti-MEM I, and 24 h later, the medium was replaced with DMEM (containing 10% FBS, Invitrogen). Shed virus was collected by removing the cell medium at 2 and 3 days post-transfection and filtered through a 0.45-μm syringe filter prior to being added directly to Caco2 cells. Infected cells were visualized by anti-GFP indirect immunofluorescence.
Immunofluorescence Microscopy
Cellular expression of β-catenin and GFP was examined in Caco2 cell monolayers fixed in 4% paraformaldehyde/methanol as described (30). Primary antibodies were mouse anti-β-catenin (1:50; Transduction Laboratories, San Jose, CA) and chicken anti-GFP (1:1000; Abcam, Cambridge, MA). Bound anti-β-catenin and anti-GFP were visualized with Alexa Fluor 488 goat anti-mouse (1:500; Invitrogen) and Alexa Fluor 555 goat anti-chicken (1:500; Invitrogen), respectively. Antibody specificities were determined by replacing the primary antibodies with an irrelevant rabbit or mouse IgG (data not shown). Antibody reactions were visualized using a Zeiss Axioskop equipped with epifluorescence optics and a SPOT II digital camera.
Real-time RT-PCR
Expression of APOA1 (apolipoprotein A1), SI (sucrase-isomaltase), TFF3 (trefoil factor 3), AGR2 (anterior gradient homolog 2), MUC1, MUC2, MUC3, chromogranin, secretin, PYY, HD5 (human defensin 5), and HD6 (human defensin 6) mRNA and β-catenin in confluent Caco2 cultures treated with either FGF9, FGF2, or FGF18 and untreated controls was quantified by real-time PCR analysis using the Applied Biosystems validated Celera Assay on Demand kit and the ABI PRISM SDS7000 sequence detection system (Applied Biosystems, Foster City, CA). For reverse transcription, random hexamers (1 μg) and 10 ng of total RNA were used in a final reaction volume of 20 μl containing 200 units of Superscript (Invitrogen). Lysozyme primers were 5′-AAAACCCCAGGAGCAGTTAAT-3′ and 5′-CAACCCTCTTTGCACAAGCT-3′. PCR was performed in triplicate for 40 cycles using 10% of the volume of the first strand synthesis in a total volume of 50 μl that included 25 μl of SYBR Green master mix (Applied Biosystems) and a 250 nm final concentration of primers. The ΔCT method was used to quantify all relative mRNA levels as described (60), using 18 S RNA as the reference and internal standard. The TaqMan primer-probe set for 18 S RNA with the Vic/Tamra detection system was used to measure 18 S RNA in replicate samples to those taken for the above listed mRNA quantifications.
Western Blot Analysis
HD5 proteins were analyzed by immunoblotting as described previously with some modifications (31). Cell culture medium was collected, lyophilized, and reconstituted with non-reducing 3× SDS loading buffer (0.17 m Tris, pH 8.8, 6% SDS, 23% glycerol). The sample was resolved on a 10–20% Tris-Tricine4 gel (Bio-Rad) and transferred to a polyvinylidene fluoride microporous membrane (Immobilon-P transfer membrane, Millipore, Billerica, MA) for 20 min at 25 V using a Bio-Rad semidry transfer apparatus. Proteins were fixed to the membrane for 30 min with 0.05% gluteraldehyde in Tris-buffered saline (TBS). To prevent nonspecific antibody binding to membranes, blots were treated for 30 min at room temperature with 1× PBS, 0.1% Tween. HD5 was detected by anti-HD5 (1:1000 (32)) and visualized by HRP-conjugated anti-rabbit IgG (1:2000; ECL kit, Amersham Biosciences). Antibodies were diluted in 1× PBS, 0.1% Tween, 5% dried milk.
Phospho-ERK1/2, phospho-GSK3β, and phospho-β-catenin were assessed in total protein sample isolated by lysing cells in 10 mm Tris, pH 7.5, 150 mm NaCl, 1% Triton X-100, 0.5 Nonidet P-40, 1.5 mm MgCl2 1 mm EGTA, 1 mm EDTA, complete protease inhibitor (Roche Applied Science), 1 mm PMSF, 200 mm sodium orthovanadate, 1 mm microcystin and incubated for 30 min on ice. After centrifugation at 10,000 × g for 10 min at 4 °C, the supernatant was recovered, and the protein concentration was determined by a Bradford assay. Proteins were resolved by SDS-PAGE and transferred to polyvinylidene fluoride microporous membranes (Immobilon-P Transfer membrane, Millipore, Billerica, MA) for 1 h at 100 V. Western blotting was performed for phospho-ERK1/2 (phospho-p42/44 MAPK (Thr202/Tyr204) at 1:1000; Cell Signaling Technology), total ERK (ERK2, 1:5000; Santa Cruz Biotechnology, Inc. (Santa Cruz, CA)), phospho-GSK3β (Ser9) and total GSK3β (both antibodies at 1:1000; Cell Signaling Technology), phospho-β-catenin (Ser33/Ser37/Thr41; 1:1000; Cell Signaling Technology), and total β-catenin (1:5000; BD Transduction Laboratories). To prevent nonspecific antibody binding to the membranes, blots were treated for 1 h at room temperature with 1× PBS, 0.1% Tween containing 5% dry milk solids. All primary antibodies were incubated overnight at 4 °C. Secondary antibodies were incubated for 1 h at room temperature, and the reaction was detected using Amersham Biosciences ECL PlusTM (GE Healthcare). Bands were visualized using the Molecular Image® ChemiDocTM XRS+ imaging system (Bio-Rad).
Statistics
Data were analyzed by pairwise t tests using the pooled estimate of variance and Bonferroni's correction of the p values for multiple comparisons. Pairwise Wilcoxon Mann-Whitney tests with Bonferroni's adjustment of p values for multiple comparisons were used for analysis of non-parametric data. Differences were considered statistically significant for p ≤ 0.05.
RESULTS
Ligands for FGFR-3 Induce Expression of Intestinal Paneth Cell Genes in Caco2 Cells
We previously reported that mice globally lacking functional FGFR-3 manifest a deficit in the number of Paneth cells in the small intestine during postnatal gut development, suggesting that FGFR-3 signaling is critical for the differentiation and/or maturation of these cells (13). To assess whether activation of FGFR-3-mediated signaling in intestinal epithelial cells directly affected expression of differentiation markers characteristic of the mature Paneth cell lineage, we first examined whether ligands of FGFR-3 could affect the expression of such markers in several intestinal epithelial cell lines (supplemental Fig. 1). Treatment of cells with FGF9, a high affinity ligand for FGFR-3, induced both Caco2 and T84 cells to express high levels of mRNA encoding HD5, a major Paneth cell-specific α-defensin expressed in the human small intestinal epithelium. However, FGF9 treatment did not stimulate expression of Paneth cell-specific α-defensins in either HT29 cells or nontransformed rat intestinal epithelial cells. Caco2 cells were chosen for further study of FGFR-3 signaling in Paneth cell differentiation because these cells have very low constitutive expression of HD5 under basal culture conditions and are a well characterized model of small intestinal enterocytic differentiation. For these studies, cells were grown on semipermeable membranes and treated for 3 days with FGF2, FGF9, or FGF18, ligands known to activate FGFR-3, and the expression of various intestinal cell lineage-specific differentiation markers was measured after confluence was attained (Fig. 1). As reported by others (33, 34), there was substantial expression of the absorptive cell lineage-specific genes SI and APOA1 in untreated confluent cell monolayers. In contrast, the expression of HD5 and HD6, specific for Paneth cells within the intestine, was either undetected or barely detectable (Fig. 1, A and B). However, the addition of FGF2, FGF9, or FGF18 resulted in a dramatic and significant induction of HD5 and HD6 mRNAs. Further, although untreated Caco2 cells express lysozyme, a significant increase in its expression was also observed in response to FGF treatment (Fig. 1A).
FIGURE 1.

Expression of intestinal lineage differentiation markers by Caco2 cells in response to FGF stimulation. A, Paneth cell markers: HD5 and HD6 and lysozyme. B, enterocyte cell markers: apoA1 and sucrase-isomaltase. C, goblet cell markers: MUC3, AGR2, and TFF3. Caco2 cells were treated with FGF9 (50 ng/ml), FGF2 (10 ng/ml), or FGF18 (50 ng/ml) daily beginning at 24 h postplating until cells were harvested at confluence. Control cells were not treated. mRNA levels were determined by quantitative real-time PCR. Values (mean ± S.D. (error bars)) are expressed relative to 18 S rRNA. †, p ≤ 0.05; *, p ≤ 0.01; **, p ≤ 0.001.
In contrast to the induction of genes expressed in the mature Paneth cell lineage by FGFs, there was a marked suppression of absorptive enterocyte-specific differentiation exemplified by a decrease in both APOA1 and SI mRNA in response to each of the FGFR-3 ligands used (for example, ∼20- and ∼5-fold, respectively, by FGF9) (Fig. 1B). Of the goblet cell markers expressed by Caco2 cells, there was no significant change in mRNA levels of MUC3, AGR2, or TFF3 following FGF treatment of the cultures (Fig. 1C). Finally, there was no detectable expression of multiple markers of neuroendocrine differentiation (chromagranin A and B, PYY, and secretin) (data not shown) in either control or stimulated cultures.
The induction of de novo expression of HD5 mRNA by Caco2 cells required a minimum of 3 days of stimulation by FGF9 (Fig. 2A). Accumulation of secreted precursor HD5 peptide was detected by Western blot analysis in the Caco2 growth medium after 3 consecutive days of FGF9 treatment (Fig. 2B). In contrast, a 10-fold reduction in sucrase-isomaltase expression was seen after only 24 h of treatment with FGF9 (Fig. 2C). Finally, the induction of HD5 mRNA was sustained for at least 72 h following the last addition of FGF9 (Fig. 2D), suggesting that differentiation of the Paneth cell phenotype is stable.
FIGURE 2.

HD5 protein is secreted into the medium of Caco2 cultures stimulated with FGF9. A and C, HD5 and sucrase-isomaltase mRNA levels in Caco2 cells treated with FGF9 (50 ng/ml) for the indicated times. Vehicle represents culture receiving only growth medium. B, Western blot analysis of HD5 secreted into the medium of Caco2 cells treated with FGF9 for 72 h. Control (Ctr) is medium from untreated culture. Recombinant proHD5 is shown for reference. D, HD5 mRNA levels determined at times indicated after the last FGF9 addition and daily medium change. mRNA levels (mean ± S.D. (error bars)) are expressed relative to 18 S rRNA.
Activation of FGFR-3 Alone Is Sufficient to Induce Paneth Cell-specific Gene Expression in Caco2 Cells
The activity of FGFs on target cells is mediated by binding to FGFRs, a family of high affinity cell surface receptors with overlapping ligand-binding specificity. Because we previously observed a defect in the accrual of Paneth cells in mice lacking FGFR-3 (13), we asked whether activation of only FGFR-3 in intestinal epithelial cells was sufficient to induce expression of intestinal Paneth cell-specific genes. The expression of HD5 and HD6 mRNA was determined following infection of Caco2 cells with either the IRES-pBOB lentiviral vector (see “Materials and Methods”), encoding the ligand-independent constitutively active mutant of FGFR-3, FGFR-3K650E (27), or cells infected with the empty vector alone (Fig. 3). Expression of HD5 and HD6 was markedly induced only in Caco2 cells that expressed FGFR-3K650E. Further, FGF7, a ligand with high binding affinity for FGFR-2 but not FGFR-3 (35) was significantly less effective in inducing HD5 mRNA (supplemental Fig. 2) than FGF9. This finding suggests a degree of receptor selectivity within the FGF receptor family for the induction of HD5 expression.
FIGURE 3.
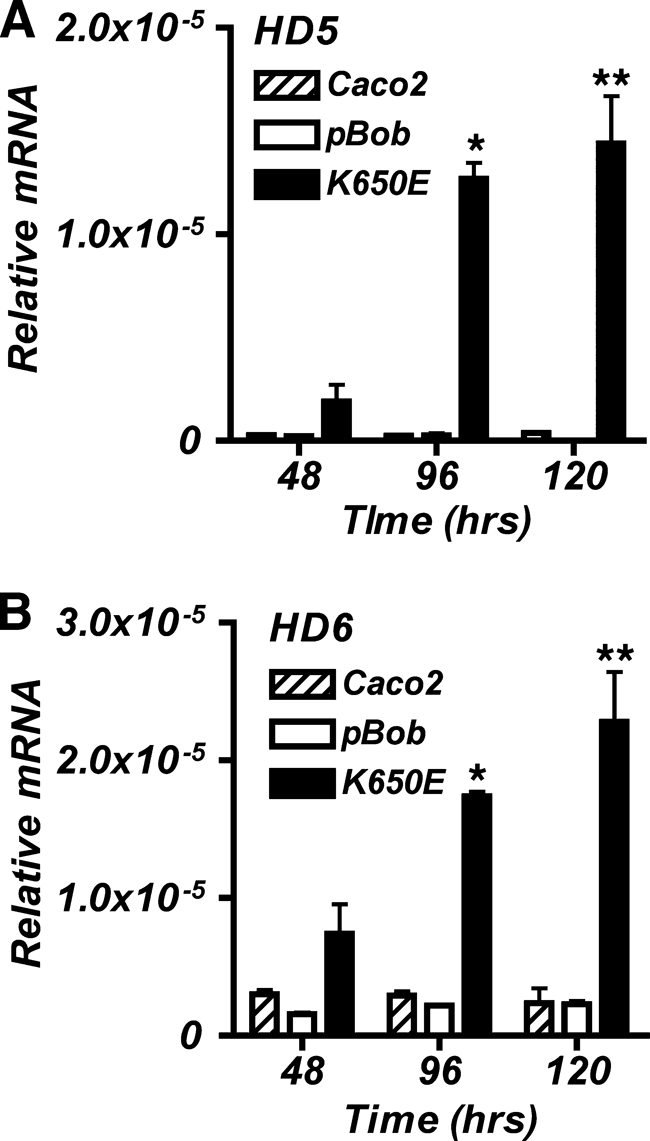
Ligand-independent FGFR-3 signaling induces expression of Paneth cell markers of differentiation. HD5 (A) and HD6 (B) mRNA levels were determined in Caco2 cells expressing a constitutively active receptor construct, FGFR-3K650E, or the control vector pBOB. Cells were harvested for RNA at 48, 96, and 120 h postplating. Levels of mRNA were determined by quantitative real-time PCR and expressed relative to 18 S rRNA. Values are the mean ± S.D. (error bars) of n = 3. *, p ≤ 0.001 for 96 h K650E versus 96 h pBOB; **, p ≤ 0.001 for 120 h K650E versus 120 h pBOB.
Induction of Paneth Cell-specific Gene Expression by FGFR-3 Signaling Is Basolaterally Polarized
Caco2 cells grown on semipermeable supports develop structural and functional polarity, and the resulting monolayer closely resembles transporting epithelia in situ (36). Such cultures showed robust induction of both HD5 and HD6 mRNA in response to FGF9 only when administered to the basolateral aspect of the cultures (Fig. 4). In comparison with the apical application of FGF9, treatment on the basolateral side of the monolayer increased HD5 and HD6 expression ∼5- and ∼2.5-fold, respectively. The differences in apical versus basolateral stimulation of HD5 and HD6 expression suggests basolateral polarization of FGF receptor signaling in these cells.
FIGURE 4.

Paneth cell differentiation response of Caco2 cells to FGF requires basolateral stimulation. Caco2 cells grown on semipermeable membranes were given FGF9 (50 ng/ml) daily on either the apical or the basolateral surface. Cells were harvested at 3 days postconfluence, and total RNA was extracted. HD5 (A) and HD6 (B) mRNA levels were determined by quantitative real-time PCR and expressed relative to 18 S rRNA. Vehicle represents cells receiving only growth medium. Values are the mean ± S.D. (error bars) of n = 3. N.S., not significant.
Induction of Paneth Cell-specific Gene Expression Requires Sustained Activation of the TCF4/β-Catenin Pathway
Because activation of the TCF4/β-catenin transcription complex is critical to Paneth cell differentiation, we hypothesized that signaling through FGFR-3 was effecting Paneth cell differentiation by modulating TCF4/β-catenin activity. Because activation of the TCF4/β-catenin transcriptional complex requires nuclear translocation of β-catenin from cytoplasmic pools and subsequent formation of a complex with TCF4, we first examined whether FGFR-3 activation affected the nuclear localization of β-catenin in Caco2 cells (Fig. 5, A–F). β-Catenin expression and localization determined by immunofluorescence showed that cells expressing the constitutively active FGFR-3K650E, visualized as GFP-positive cells (Fig. 5A), had a marked increase in nuclear localization of β-catenin (Fig. 5, compare B with E) consistent with increased TCF4/β-catenin transcriptional activity (Fig. 5, merged image, compare C with F). Conversely, cells expressing the control vector, pBOB, had little discernable nuclear localization of β-catenin (Fig. 5, E and F).
FIGURE 5.

Activation of FGFR-3 signaling induces TCF4/β-catenin activity. A–F, immunofluorescence of Caco2 cells infected with lentivirus encoding constitutively active FGFR-3K650E (A–C) or pBOB (D–F) containing a CMV-driven cassette with an IRES-GFP for bicistronic expression. Cells were stained with anti-GFP (red; A and D) and anti-β-catenin (green; B and E). Nuclear localization of β-catenin was observed in the FGFR-3K650E-expressing cells (C; merged image; the arrowhead points to cells expressing both GFP and β-catenin) but was rare in the pBOB-expressing cells (F; merged image). G, β-catenin/TCF4-mediated transcriptional activity was assayed in lysates of Caco2 cells transiently transfected with pTOPFlash reporter. Cells were infected with lentivirus for pBOB, FGFR-3WT, K650E, or K508R. Data are shown as individual points, and the bar represents the mean of n = 4. p ≤ 0.001 for K650E versus pBOB. H, TOPFlash reporter activity determined as above in response to inhibition of β-catenin by shRNA in cells infected with the K650E mutant of FGFR-3. I, HD5 mRNA expression level in response to β-catenin shRNA was determined by real-time PCR in total RNA isolated from cells infected with the K650E mutant of FGFR-3. Values are the mean ± S.D. (error bars) of n = 3, and mRNA values (mean ± S.D.) are expressed relative to 18 S rRNA.
Using pTOPFlash reporter to measure TCF4/β-catenin-mediated transcriptional activity, we confirmed that signaling through FGFR-3 alone is sufficient to prolong TCF4/β-catenin activity after cultures reached confluence, a time when this activity normally is in dramatic decline (24, 25). Thus, FGFR-3K650E-expressing cells had ∼4-fold greater pTOPFlash activity than cells expressing either the wild-type myristoylated FGFR-3 (FGFR-3WT); a kinase-dead mutant, FGFR-3K508R; or the empty vector pBOB (Fig. 5G).
To examine whether the FGFR-3 induction of Paneth cell markers of differentiation was also dependent on activity of the TCF4/β-catenin pathway, we established conditions for the down-regulation of TCF4/β-catenin activity in Caco2 cells by expressing a β-catenin shRNA. TCF4/β-catenin activity was again measured using the pTOPFlash luciferase reporter (Fig. 5H). As anticipated, expression of FGFR-3K650E alone was sufficient to increase TCF4/β-catenin activity, whereas co-expression of β-catenin shRNA significantly reduced pTOPFlash activity (∼2.9-fold reduction) in cells expressing FGFR-3K650E (Fig. 5H). Consistent with this finding, expression of β-catenin shRNA also abrogated the increase in pTOPFlash activity seen in FGF9-stimulated cells (supplemental Fig. 3). As expected, the induction of HD5 mRNA resulting from expression of FGFR-3K650E was also significantly diminished (∼2.3-fold reduction) in cells co-transfected with the β-catenin shRNA (Fig. 5I). These results are consistent with our prediction that the induction of intestinal Paneth cell genes by FGFR-3 signaling requires sustained activation of the TCF4/β-catenin pathway.
The Induction of Paneth Cell-specific Gene Expression and Sustained Activation of the TCF4/β-Catenin Pathway by FGFR-3 Signaling Is Modulated by Maintenance of High Levels of β-Catenin mRNA
Canonical Wnt pathway signal transduction is achieved by the stabilization and accumulation of cytoplasmic β-catenin that then translocates to the nucleus to bind TCF4 and affect gene transcription of Wnt pathway responsive genes. Central to this scenario is the obligatory inhibition of the β-catenin destruction complex that, in the absence of Wnt signaling, inhibits the accumulation of β-catenin by tagging it for destruction via a series of dephosphorylation-phosphorylation events (37). Because we found that signaling through FGFR-3 was able to sustain high levels of TCF4/β-catenin activity, we examined whether this was achieved through modulation of components of the β-catenin destruction complex (Fig. 6 and supplemental Fig. 4). GSK3β directly phosphorylates β-catenin, serving to target it for destruction by the proteasome. Phosphorylation of GSK3β, usually in response to Wnt signaling, abrogates the ability of GSK3β to phosphorylate β-catenin. In contrast to our expectations, the level of GSK3β phosphorylation in Caco2 cells treated with FGF9 for 5 or 10 min was not different from that seen in untreated control cultures, although phospho-ERK1/2 showed robust stimulation by 5 min of incubation with FGF9 (Fig. 6A). Furthermore, the level of β-catenin phosphorylation at Ser33/37 and Thr41 was also not altered by FGF9 treatment (Fig. 6B). Although expression of the components known to make up the β-catenin destruction complex, APC, axin, CK1, GSK3β, PPP2CA, and PPP2R1A, was also unaffected by FGF9 treatment of Caco2 cells, β-catenin mRNA expression was dramatically augmented (supplemental Fig. 4). Further, confluent Caco2 cultures, in the absence of FGF9, had less than half of the β-catenin mRNA levels found in subconfluent cultures (Fig. 6C). However, growing cells in the presence of FGF9 significantly sustained β-catenin mRNA expression (Fig. 6C). Expression of β-catenin shRNA abrogated the increase in both β-catenin and HD5 mRNA levels in response to FGF9 (Fig. 6D). Taken together, these data indicate that FGFR-3 signaling sustains TCF4/β-catenin activity by maintaining high levels of β-catenin mRNA expression and not through the inhibition of the β-catenin destruction complex.
FIGURE 6.

Maintenance of β-catenin mRNA levels is required for HD5 expression in response to FGF9. A, Caco2 cells were treated with the FGFR-3 ligand, FGF9 (50 ng/ml), for the times indicated, and total protein preparations were resolved by gel electrophoresis and Western blotted for total and phospho-ERK1/2 and total and phospho-GSK3β as described under “Materials and Methods.” B, Western blot for phospho-β-catenin (Ser31/33 and Thr41) and total β-catenin in total protein extracts from Caco2 cells treated with FGF9 (50 ng/ml) for 24 h in the presence or absence of the proteasome inhibitor, MG132, as described under “Materials and Methods.” The phosphorylation status of neither GSK3β nor β-catenin was altered in response to FGFR-3. C, β-catenin mRNA levels determined by quantitative real-time PCR in total RNA isolated from cells treated with FGF9 (50 ng/ml) for the times indicated. All values are the mean ± S.D. (error bars) of n = 4. D, β-catenin and HD5 mRNA expression levels in response to β-catenin shRNA were determined by quantitative real-time PCR in total RNA isolated from cells treated with FGF9 for 3 days. Values are the mean ± S.D. of n = 3.
Sustained Activation of the TCF4/β-Catenin Pathway Is Necessary but Not Sufficient to Induce the Expression of Markers of Paneth Cell Differentiation
To determine whether the effect of FGFR-3 signaling on Paneth cell differentiation is solely through its up-regulation of TCF4/β-catenin activity, we stimulated the activation of this transcription complex independently of FGFR-3 by treating Caco2 cells with LiCl. LiCl inhibits GSK3β kinase activity in the β-catenin destruction complex, resulting in decreased degradation of β-catenin. As anticipated, LiCl induced TCF4/β-catenin-mediated transcriptional activity ∼3-fold at 96 h, as measured by the pTOPFlash reporter (Fig. 7A). Strikingly, there was no induction of HD5 mRNA expression in cells treated with LiCl, whereas FGF9 induced a robust expression of HD5 mRNA, as observed previously (Fig. 7B). Secreted HD5 propeptide accumulated in the culture medium of Caco2 cells treated only with FGF9 but not in the medium of LiCl-treated cultures (Fig. 7C). Stimulating TCF4/β-catenin activity through the inhibition of GSK3β in the absence of FGFR-3 activation was insufficient to induce HD5 expression, strongly suggesting that FGFR-3 signaling also modulates other effectors and/or pathways that are required to induce Paneth cell HD5 expression in addition to its effects on TCF4/β-catenin activity.
FIGURE 7.

Sustained TCF4/β-catenin activity without FGFR-3 signaling is not sufficient to induce HD5 mRNA expression. Caco2 cells transfected with pTOPFlash were treated with LiCl (10 mm) added to the medium beginning at 24 h post-transfection (A), and luciferase activity was determined at the times indicated. B and C, cells were treated with either LiCl (10 mm) or FGF9 24 h postplating, and HD5 mRNA (B) and protein (C) expression was determined 3 days later. Control (Ctr) represents untreated cultures. N.S., not significant. Error bars, S.D.
FGFR-3-mediated Induction of Intestinal Paneth Cell-specific Gene Expression Requires Activation of ERK1/2 and p38 MAPK Independent of TCF4/β-Catenin Activation
Because TCF4/β-catenin signaling alone was not sufficient to induce HD5 and HD6 expression, and FGFR-3 can initiate multiple signaling cascades upon activation by ligand, we examined which other pathways, in conjunction with TCF4/β-catenin signaling, might be involved in the FGFR-3-mediated regulation of expression of markers characteristic of Paneth cell differentiation in Caco2 cells. For these experiments, we used the small molecule inhibitors for PI3K (LY294002), p38 MAPK (SB 203580), and ERK1/2 (UO126). Treating Caco2 cells with LY294002, SB203580, and UO126 had no significant effect on TCF4/β-catenin activity in response to FGF9 as measured by pTOPFlash (Fig. 8A). However, cells treated with the ERK1/2 and p38 MAPK inhibitors expressed significantly less HD5 mRNA in response to FGF9 (Fig. 8B). These results indicate that although the effects of FGFR-3 activation on TCF4/β-catenin signaling are independent of PI3K, p38 MAPK, and ERK1/2, the up-regulation of intestinal Paneth cell-specific markers in response to FGF9 treatment also required activation of the ERK1/2 and p38 MAPK pathways. Both p38 MAPK and ERK1/2 were phosphorylated in response to the concentration of FGF9 that induced HD5 expression in Caco2 cells (data not shown).
FIGURE 8.
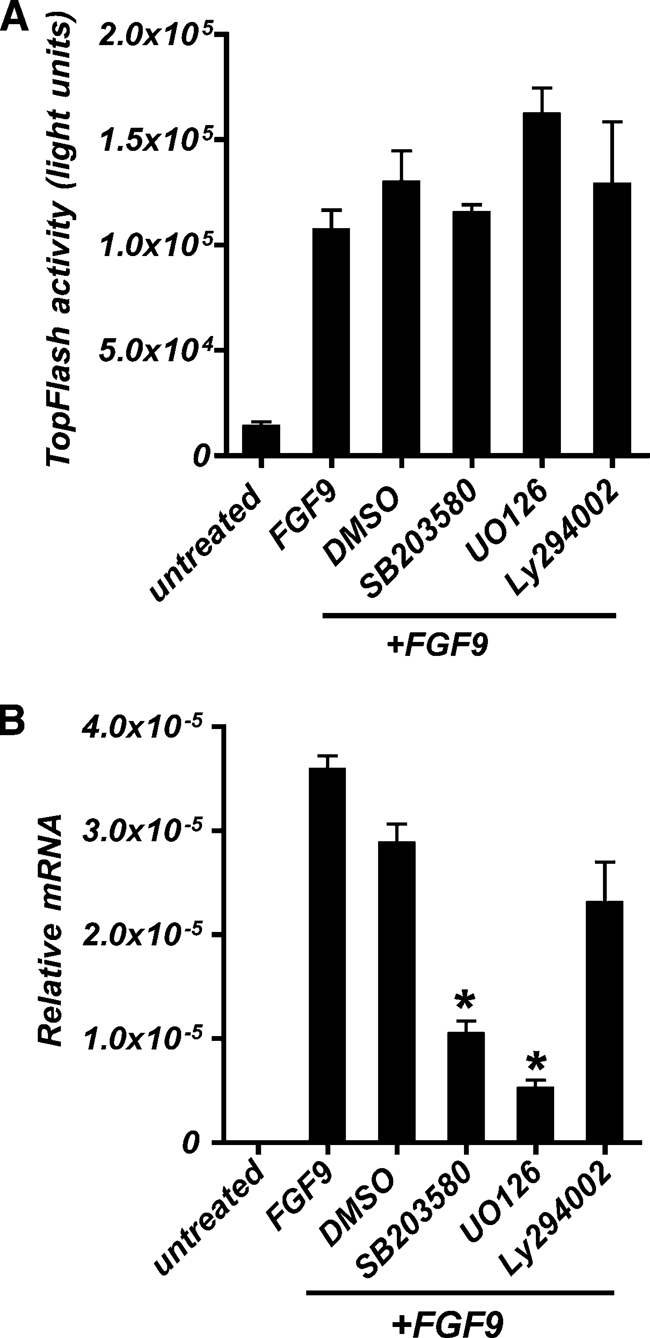
ERK1/2 and p38 MAPK pathways in addition to TCF4/β-catenin signaling are necessary for HD5 expression in response to FGFR-3 signaling. A, β-catenin/TCF4-mediated transcriptional activation was assayed by luciferase activity in Caco2 cells transiently transfected with pTOPFlash and Renilla. B, HD5 mRNA levels were determined by quantitative real-time PCR. A and B, cells were treated for the last 24 h before harvest at 120 h post-transfection with PI3K (LY 294002), p38 MAPK (SB 203580), or ERK1/2 (UO126) inhibitors. FGF9 (50 ng/ml) was added daily beginning at 24 h post-transfection, and cells were harvested at 120 h post-transfection. Values are the mean ± S.D. (error bars) of n = 3. *, p ≤ 0.001.
Activation of Signaling Pathways in Addition to the TCF4/β-Catenin and MAPK Pathways Is Required for Induction of Paneth Cell-specific Gene Expression
Finally, we examined whether sustained activation of the TCF4/β-catenin pathway in conjunction with stimulation of the MAPK pathways independent of FGFR-3 was sufficient to induce expression of HD5 mRNA. Caco2 cells were treated with LiCl, as before, together with EGF at a concentration that stimulated ERK1/2 phosphorylation (Fig. 9). Neither EGF alone nor EGF in combination with LiCl could stimulate HD5 mRNA expression comparable with that seen after FGF9 treatment (Fig. 9B). Taken together, these data strongly suggest that regulation of intestinal Paneth cell-specific differentiation markers in Caco2 cells by FGFR-3 requires the activation of additional pathways parallel to and distinct from those identified by our studies.
FIGURE 9.

Independent induction of TCF4/β-catenin activity and MAPK signaling is insufficient to induce Paneth cell-specific defensin expression. A, Western blot analysis of ERK1/2 phosphorylation in cells treated with EGF (50 ng/ml) or vehicle. Three experimental replicates for each treatment group are shown. B, induction of HD5 mRNA in Caco2 cells treated with LiCl (10 mm), EGF (50 ng/ml), LiCl plus EGF, or FGF9. Although EGF treatment stimulated ERK1/2 phosphorylation, the combination of LiCl and EGF treatment did not induce expression of HD5 mRNA as seen in response to FGF9. ND, not detected. Values are the mean ± S.D. (error bars) of n = 3. *, p < 0.001 versus untreated control.
DISCUSSION
In this study, we report that activation of FGFR-3 in Caco2 cells by ligands or by expression of a ligand-independent, constitutively active mutant of FGFR-3, FGFR-3K650E, results in the coordinately induced expression of multiple genes characteristic of mature intestinal Paneth cells. The induction of intestinal Paneth cell-specific gene expression required the independent activation of the ERK1/2 and p38 pathways by FGFR-3 in addition to the effects of this receptor on maintaining sustained activation of the TCF4/β-catenin pathway. These data are consistent with our prior in vivo observation that mice lacking functional FGFR-3 had a significantly reduced number of Paneth cells and diminished mRNA levels for the intestinal Paneth cell markers MMP-7, lysozyme, and cryptdin-5 in the postnatal developing intestine, along with diminished nuclear localization of β-catenin (13). The sustained activation of TCF4/β-catenin by FGFR-3 signaling that we observe here represents a novel pathway that does not involve regulation of the activity of the β-catenin destruction complex per se; rather, it is dependent on the maintenance of high β-catenin mRNA expression at a time when this mRNA level would have dropped dramatically. Our current results suggest that the effects of FGFR-3 on Paneth cell differentiation require independent activation of multiple signaling pathways downstream of FGFR-3 in undifferentiated epithelial progenitors within the crypt epithelium.
Caco2 cells spontaneously differentiate along the absorptive cell lineage as a function of confluence and time in culture (24, 36, 38). This feature has rendered them a useful model by which to study the phenotypic changes that occur as intestinal cells migrate along the crypt-to-villus axis. However, less attention has been given to their expression of some goblet cell-specific markers and, under certain circumstances, of Paneth cell markers (39–42). Our current work demonstrates that signaling through FGFR-3, which is abundantly expressed by Caco2 cells (43) and possibly other FGFRs can induce the de novo expression of Paneth cell α-defensins HD5 and HD6 in these cells. This induction results from the activation of FGFR-3 by ligand binding or expression of the constitutively active receptor, FGFR-3K650E, and does not require additional interactions with accessory cells, such as fibroblasts. This finding suggests that activation of FGFR-3 at the basal lateral cell surface of undifferentiated crypt epithelial cells is probably sufficient to induce the signaling cascade that ultimately results in expression of Paneth cell markers of differentiation or maturation in vivo.
Paneth cells, located at the base of intestinal crypts in close proximity to stem cells, are key effectors of innate immunity, safeguarding the intestinal stem cell compartment from microbial invasion through their production of microbicidal peptides and enzymes (3, 44). HD5, a major defensin of human Paneth cells, is synthesized as a prepropeptide that must be proteolytically cleaved to generate the fully active mature peptide (2, 45, 46). Paneth cells store proHD5 in their granules. ProHD5 is cleaved either as it exits the cell or in the lumen after it is secreted. Trypsin, also present as an inactive zymogen in Paneth cells, is believed to be the serine protease that converts proHD5 to the mature active form in the intestine (2, 45). Although Caco2 cells produce trypsin, they also express α1-antitrypsin (47, 48). Our finding of only proHD5, and not mature peptide, in the culture medium of cells treated with FGF9 is not surprising in view of their production of α1-antitrypsin and given the additional presence of serum α1-antitrypsin in the growth medium. A current limitation of this model is the fact that under conditions used to induce HD5 expression, proHD5 is not found in intracellular storage granules (data not shown). This finding suggests that Caco2 cells may lack the accessory machinery required to form dense core granules or that other, yet to be identified, signals are required in conjunction with FGFR-3-mediated signaling to fully manifest the mature Paneth cell phenotype.
The present studies show that FGFR-3 signaling resulted in sustained high levels of TCF4/β-catenin-mediated transcriptional activity and that this was necessary for the induction of expression of markers of Paneth cell differentiation in Caco2 cells. This latter effect was primarily dependent on β-catenin binding to TCF4 and not to other possible-binding partners (49) because expression of dnTCF4 virtually negated the FGF9-mediated induction of HD5 mRNA expression. These results are consistent with prior studies showing that the canonical Wnt pathway regulates Paneth cell differentiation and, possibly, specification of the Paneth cell lineage in the intestine through Wnt/Frizzled-5 signaling and through regulation of Sox9, an HMG-box transcription factor expressed in intestinal crypt cells, including Paneth cells (10–12). Our current in vitro results support the hypothesis that the in vivo paucity of Paneth cells previously reported in FGFR-3 null mice was at least in part due to the modulation of TCF4/β-catenin activity by FGFR-3 in crypt progenitor cells (13). It is possible that other members of the FGF receptor family could subserve this role of FGFR-3 under some circumstances because FGFR-3 null mice do not completely lack Paneth cells.
Surprisingly, FGFR-3 signaling did not seem to regulate the stability of intracellular β-catenin per se as indicated by the lack of any changes in either the expression of components of the β-catenin destruction complex or in the phosphorylation levels of GSK3β and β-catenin in response to FGF9. Rather, our current studies strongly suggest that the FGFR-3-mediated sustained activity of the TCF4/β-catenin complex and induction of Paneth cell-specific genes seen in Caco2 cells are accomplished chiefly through maintaining high levels of β-catenin mRNA at times when this expression would be greatly decreased in confluent cultures in the absence of FGF9 treatment. The necessity of sustaining high levels of TCF4/β-catenin activity is in agreement with the studies of Andreu et al. (9). Using hypomorphic β-catenin mutant mice, these authors demonstrated that only the Paneth cell lineage was highly sensitive to changes in overall β-catenin levels. Our demonstration that overexpression of β-catenin mRNA induced by FGFR-3 signaling may be a mechanism for modulating the activity of the TCF4/β-catenin complex is also consistent with these studies. Recent studies of Goentoro and Kirschner (50) afford a second possible interpretation of our findings. These authors suggest that transcription of some Wnt signaling response genes may be sensitive to the Wnt-induced magnitude of change in β-catenin levels rather than the absolute level of β-catenin. These authors suggest a model whereby induced changes in β-catenin levels are more sensitive to perturbations in the rates of β-catenin synthesis than to changes in the activity of the degradation complex. Thus, it is possible that sustained expression of high levels of β-catenin mRNA in response to FGFR-3 renders cells more sensitive to a given level of Wnt signaling. Indeed, RKO cells in which β-catenin was overexpressed were more responsive to Wnt stimulation than control cells (50).
We also found that regulation of Paneth cell differentiation by FGFR-3 signaling probably involves the sequential or parallel induction of multiple downstream signaling cascades. Consistent with this hypothesis, activation of both TCF4/β-catenin-dependent and TCF4/β-catenin-independent signaling cascades downstream of FGFR-3 were required for effective induction of HD5. This conclusion is also supported by the finding that the LiCl-mediated stimulated and sustained TCF4/β-catenin activity, although necessary, was not sufficient in itself to drive de novo HD5 mRNA transcription or protein expression. Because the MAPK pathway (which includes ERK 1/2), p38, JNK kinases, and the PI3K-Akt pathway are key downstream signal transduction pathways responsive to FGFR activation (51), we examined whether some of these pathways were involved in regulating TCF4/β-catenin signaling or Paneth cell gene expression using small molecule inhibitors. Although the inhibition of ERK1/2, p38, and PI3K did not abrogate FGF9 stimulation of TCF4/β-catenin signaling, ERK1/2 and p38 emerged as necessary for the FGFR-3 induction of HD5 expression independent of TCF4/β-catenin signaling. However, HD5 expression in response to MAPK activation in conjunction with TCF4/β-catenin signaling displayed growth factor selectivity. Caco2 cells in which TCF4/β-catenin signaling was stimulated with LiCl and treated with EGF to activate the MAPK pathway did not express significant levels of HD5 as compared with FGF9-treated cells. The observation that EGF-mediated stimulation of MAPK could not substitute for FGF9 in the induction of HD5 suggests the possibility that other signaling pathways activated by FGFR-3 may also be required. Another hypothesis is that induction of Paneth cell-specific differentiation is sensitive to the magnitude of MAPK activity. This possibility is suggested by the studies of Aliaga et al. (52), who demonstrated that both cell cycle progression and differentiation in Caco2 cells were dependent on different levels of MAPK signaling pathway activity. Additionally, active ERK was observed in the intestinal crypts (52). It is plausible that FGFR-3, which is highly expressed along the membranes of cells in the lower third of the intestinal crypt in a region where crypt progenitor and Paneth cells reside, may be readily available to activate ERK in vivo (53). The mechanism by which FGFR-3 signaling interacts with both the TCF4/β-catenin transcription complex and the MAPK pathway to regulate specific Paneth cell differentiation markers remains to be determined.
Our current findings suggest that FGFR-3 signaling may be another pathway that can modulate intestinal epithelial cell fate in addition to the already well described Wnt, Notch, and Hedgehog pathways that are known to regulate crypt stem cell fate, proliferation, and differentiation (19). Of note is the recent demonstration that Paneth cells provide essential signals needed by Lgr5 intestinal stem cells for their survival (54, 55). Consistent with our previous observation that FGFR-3−/− mice have reduced numbers of intestinal crypt stem cells and a paucity of Paneth cells, Sato et al. (54) recently showed that reduction of Paneth cells in an inducible Paneth cell depletion model correlated with a concomitant reduction of crypt stem cells. These recent data strongly support our hypothesis that FGFR-3 signaling may regulate intestinal crypt stem cell numbers by regulating the differentiation of the Paneth cell phenotype.
That distinct downstream signaling pathways activated by FGFR-3 may mediate the coordinate induction of Paneth cell markers of differentiation versus suppression of the absorptive cell phenotype is suggested by the dramatic difference in the time of response to FGFR-3 signaling between sucrase-isomaltase and HD5 expression. These results suggest that FGFR-3 signaling effects are cell- and context-specific, in agreement with prior findings by others (56, 57), and may have distinct effects on different progenitor cell subtypes within the crypt. Although the Notch signaling pathway is predominantly responsible for the in vivo determination of the absorptive versus the secretory cell lineage via its downstream effectors Math1 and Hes1, it is unlikely that FGFR-3 is directly interacting with this pathway. We detected no difference in the expression of intestinal Math1 or Hes1 between wild type and FGFR-3 null mice (data not shown), suggesting that FGFR-3 signaling is acting downstream of Notch to effect Paneth cell differentiation. Determination of whether FGFR-3 signaling exerts context-specific effects on secretory precursors versus enterocytic progenitors in modulating the differentiation of the respective lineages via regulation of diverse signaling cascades will require further study.
We previously found that ligands for FGFR-3 are induced in response to epithelial injury or inflammation in the gut and that induction of Paneth cell hyperplasia in the SAMP1/Yit mouse, a murine model of human Crohn disease, is temporally associated with up-regulation of FGF ligand expression in the surrounding mesenchyme. These observations suggest that FGFR-3 signaling regulates intestinal Paneth cell differentiation or metaplasia under pathophysiologic circumstances in addition to its role in the regulation of Paneth cell differentiation during gut development (53, 58). Although HD5 expression in the intestinal epithelium is restricted to Paneth cells, extraintestinal expression of this defensin gene has also been reported in epithelial cells of the human reproductive tract (31, 59). Whether FGFR-3 has a role in regulating HD5 expression at these extraintestinal sites is currently unknown.
In conclusion, our present studies strongly suggest a novel role for FGFR-3 signaling in regulating intestinal epithelial cell differentiation. Signaling through FGFR-3 induces the expression of markers of Paneth cell differentiation while suppressing markers of the enterocyte lineage. Paneth cell differentiation, mediated by signaling through FGFR-3, required the independent modulation of TCF4/β-catenin activity and activity of the MAPK pathway. Our findings suggest that FGFR-3 may orchestrate this complex interplay of multiple signaling pathways to effect Paneth cell-specific differentiation or maturation during intestinal development as well as in response to intestinal injury and inflammation. Defining the mechanism(s) by which FGFR-3 signaling regulates Paneth cell differentiation will enhance understanding of the role of Paneth cells in the stem cell niche.
Supplementary Material
Acknowledgments
We thank Dr. Thomas Sturgill for helpful advice and Dr. André Ouellette for numerous helpful suggestions and comments and for critically reading the manuscript.
This work was supported, in whole or in part, by National Institutes of Health Grant R01 DK064751 (to S. M. C.) and through the Molecular Biology and Morphology Cores of the University of Virginia National Institutes of Health/NIDDK Digestive Diseases Research Core Center Grant (Grant DK50306).

The on-line version of this article (available at http://www.jbc.org) contains supplemental Figs. 1–4.
- Tricine
- N-[2-hydroxy-1,1-bis(hydroxymethyl)ethyl]glycine (systematic).
REFERENCES
- 1. Cheng H., Leblond C. P. (1974) Am. J. Anat. 141, 537–561 [DOI] [PubMed] [Google Scholar]
- 2. Cunliffe R. N., Rose F. R., Keyte J., Abberley L., Chan W. C., Mahida Y. R. (2001) Gut 48, 176–185 [DOI] [PMC free article] [PubMed] [Google Scholar]
- 3. Ouellette A. J., Bevins C. L. (2001) Inflamm. Bowel Dis. 7, 43–50 [DOI] [PubMed] [Google Scholar]
- 4. Ayabe T., Satchell D. P., Wilson C. L., Parks W. C., Selsted M. E., Ouellette A. J. (2000) Nat. Immunol. 1, 113–118 [DOI] [PubMed] [Google Scholar]
- 5. Cunliffe R. N., Mahida Y. R. (2004) J. Leukoc. Biol. 75, 49–58 [DOI] [PubMed] [Google Scholar]
- 6. Hooper L. V., Stappenbeck T. S., Hong C. V., Gordon J. I. (2003) Nat. Immunol. 4, 269–273 [DOI] [PubMed] [Google Scholar]
- 7. Wehkamp J., Schmid M., Fellermann K., Stange E. F. (2005) J. Leukoc. Biol. 77, 460–465 [DOI] [PubMed] [Google Scholar]
- 8. Salzman N. H., Hung K., Haribhai D., Chu H., Karlsson-Sjöberg J., Amir E., Teggatz P., Barman M., Hayward M., Eastwood D., Stoel M., Zhou Y., Sodergren E., Weinstock G. M., Bevins C. L., Williams C. B., Bos N. A. (2010) Nat. Immunol. 11, 76–83 [DOI] [PMC free article] [PubMed] [Google Scholar]
- 9. Andreu P., Peignon G., Slomianny C., Taketo M. M., Colnot S., Robine S., Lamarque D., Laurent-Puig P., Perret C., Romagnolo B. (2008) Dev. Biol. 324, 288–296 [DOI] [PubMed] [Google Scholar]
- 10. Bastide P., Darido C., Pannequin J., Kist R., Robine S., Marty-Double C., Bibeau F., Scherer G., Joubert D., Hollande F., Blache P., Jay P. (2007) J. Cell Biol. 178, 635–648 [DOI] [PMC free article] [PubMed] [Google Scholar]
- 11. Mori-Akiyama Y., van den Born M., van Es J. H., Hamilton S. R., Adams H. P., Zhang J., Clevers H., de Crombrugghe B. (2007) Gastroenterology 133, 539–546 [DOI] [PubMed] [Google Scholar]
- 12. van Es J. H., Jay P., Gregorieff A., van Gijn M. E., Jonkheer S., Hatzis P., Thiele A., van den Born M., Begthel H., Brabletz T., Taketo M. M., Clevers H. (2005) Nat. Cell Biol. 7, 381–386 [DOI] [PubMed] [Google Scholar]
- 13. Vidrich A., Buzan J. M., Brodrick B., Ilo C., Bradley L., Fendig K. S., Sturgill T., Cohn S. M. (2009) Am. J. Physiol. Gastrointest. Liver Physiol. 297, G168–G178 [DOI] [PMC free article] [PubMed] [Google Scholar]
- 14. Varnat F., Heggeler B. B., Grisel P., Boucard N., Corthésy-Theulaz I., Wahli W., Desvergne B. (2006) Gastroenterology 131, 538–553 [DOI] [PubMed] [Google Scholar]
- 15. Vidrich A., Buzan J. M., Ilo C., Bradley L., Skaar K., Cohn S. M. (2004) Dev. Dyn. 230, 114–123 [DOI] [PubMed] [Google Scholar]
- 16. Clevers H. (2006) Cell 127, 469–480 [DOI] [PubMed] [Google Scholar]
- 17. Fevr T., Robine S., Louvard D., Huelsken J. (2007) Mol. Cell Biol. 27, 7551–7559 [DOI] [PMC free article] [PubMed] [Google Scholar]
- 18. Logan C. Y., Nusse R. (2004) Annu. Rev. Cell Dev. Biol. 20, 781–810 [DOI] [PubMed] [Google Scholar]
- 19. van der Flier L. G., Clevers H. (2009) Annu. Rev. Physiol. 71, 241–260 [DOI] [PubMed] [Google Scholar]
- 20. Holnthoner W., Pillinger M., Groger M., Wolff K., Ashton A. W., Albanese C., Neumeister P., Pestell R. G., Petzelbauer P. (2002) J. Biol. Chem. 277, 45847–45853 [DOI] [PubMed] [Google Scholar]
- 21. Dailey L., Ambrosetti D., Mansukhani A., Basilico C. (2005) Cytokine Growth Factor Rev. 16, 233–247 [DOI] [PubMed] [Google Scholar]
- 22. Podolsky D. K. (1993) Am. J. Physiol. 264, G179–G186 [DOI] [PubMed] [Google Scholar]
- 23. Hara A., Hibi T., Yoshioka M., Toda K., Watanabe N., Hayashi A., Iwao Y., Saito H., Watanabe T., Tsuchiya M. (1993) Jpn. J. Cancer Res. 84, 625–632 [DOI] [PMC free article] [PubMed] [Google Scholar]
- 24. Mariadason J. M., Bordonaro M., Aslam F., Shi L., Kuraguchi M., Velcich A., Augenlicht L. H. (2001) Cancer Res. 61, 3465–3471 [PubMed] [Google Scholar]
- 25. Mariadason J. M., Rickard K. L., Barkla D. H., Augenlicht L. H., Gibson P. R. (2000) J. Cell Physiol. 183, 347–354 [DOI] [PubMed] [Google Scholar]
- 26. Walker E. H., Pacold M. E., Perisic O., Stephens L., Hawkins P. T., Wymann M. P., Williams R. L. (2000) Mol. Cell 6, 909–919 [DOI] [PubMed] [Google Scholar]
- 27. Hart K. C., Robertson S. C., Donoghue D. J. (2001) Mol. Biol. Cell 12, 931–942 [DOI] [PMC free article] [PubMed] [Google Scholar]
- 28. Sturgill T. W., Stoddard P. B., Cohn S. M., Mayo M. W. (2010) Mol. Cancer 9, 104. [DOI] [PMC free article] [PubMed] [Google Scholar]
- 29. Tiscornia G., Singer O., Verma I. M. (2006) Nat. Protoc. 1, 241–245 [DOI] [PubMed] [Google Scholar]
- 30. Brock R., Hamelers I. H., Jovin T. M. (1999) Cytometry 35, 353–362 [DOI] [PubMed] [Google Scholar]
- 31. Porter E., Yang H., Yavagal S., Preza G. C., Murillo O., Lima H., Greene S., Mahoozi L., Klein-Patel M., Diamond G., Gulati S., Ganz T., Rice P. A., Quayle A. J. (2005) Infect. Immun. 73, 4823–4833 [DOI] [PMC free article] [PubMed] [Google Scholar]
- 32. Porter E. M., van Dam E., Valore E. V., Ganz T. (1997) Infect. Immun. 65, 2396–2401 [DOI] [PMC free article] [PubMed] [Google Scholar]
- 33. Van Beers E. H., Al R. H., Rings E. H., Einerhand A. W., Dekker J., Büller H. A. (1995) Biochem. J. 308, 769–775 [DOI] [PMC free article] [PubMed] [Google Scholar]
- 34. Vreugdenhil A. C., Snoek A. M., Greve J. W., Buurman W. A. (2000) J. Immunol. 165, 4561–4566 [DOI] [PubMed] [Google Scholar]
- 35. Zhang X., Ibrahimi O. A., Olsen S. K., Umemori H., Mohammadi M., Ornitz D. M. (2006) J. Biol. Chem. 281, 15694–15700 [DOI] [PMC free article] [PubMed] [Google Scholar]
- 36. Sääf A. M., Halbleib J. M., Chen X., Yuen S. T., Leung S. Y., Nelson W. J., Brown P. O. (2007) Mol. Biol. Cell 18, 4245–4260 [DOI] [PMC free article] [PubMed] [Google Scholar]
- 37. Kimelman D., Xu W. (2006) Oncogene 25, 7482–7491 [DOI] [PubMed] [Google Scholar]
- 38. Mariadason J. M., Arango D., Corner G. A., Arañes M. J., Hotchkiss K. A., Yang W., Augenlicht L. H. (2002) Cancer Res. 62, 4791–4804 [PubMed] [Google Scholar]
- 39. Hollingsworth M. A., Strawhecker J. M., Caffrey T. C., Mack D. R. (1994) Int. J. Cancer 57, 198–203 [DOI] [PubMed] [Google Scholar]
- 40. Niv Y., Byrd J. C., Ho S. B., Dahiya R., Kim Y. S. (1992) Int. J. Cancer 50, 147–152 [DOI] [PubMed] [Google Scholar]
- 41. Ogle C. K., Noel J. G., Guo X., Wells D. A., Valente J. F., Ogle J. D., Alexander J. W. (2002) Crit. Care Med. 30, 428–434 [DOI] [PubMed] [Google Scholar]
- 42. Wehkamp J., Schwind B., Herrlinger K. R., Baxmann S., Schmidt K., Duchrow M., Wohlschläger C., Feller A. C., Stange E. F., Fellermann K. (2002) Digest. Dis. Sci. 47, 1349–1355 [DOI] [PubMed] [Google Scholar]
- 43. Kanai M., Rosenberg I., Podolsky D. K. (1997) Am. J. Physiol. 272, G885–G893 [DOI] [PubMed] [Google Scholar]
- 44. Bevins C. L. (2005) Am. J. Physiol. Gastrointest. Liver Physiol. 289, G173–G176 [DOI] [PubMed] [Google Scholar]
- 45. Ghosh D., Porter E., Shen B., Lee S. K., Wilk D., Drazba J., Yadav S. P., Crabb J. W., Ganz T., Bevins C. L. (2002) Nat. Immunol. 3, 583–590 [DOI] [PubMed] [Google Scholar]
- 46. Porter E. M., Poles M. A., Lee J. S., Naitoh J., Bevins C. L., Ganz T. (1998) FEBS Lett. 434, 272–276 [DOI] [PubMed] [Google Scholar]
- 47. Ducroc R., Bontemps C., Marazova K., Devaud H., Darmoul D., Laburthe M. (2002) Life Sci. 70, 1359–1367 [DOI] [PubMed] [Google Scholar]
- 48. Molmenti E. P., Perlmutter D. H., Rubin D. C. (1993) J. Clin. Invest. 92, 2022–2034 [DOI] [PMC free article] [PubMed] [Google Scholar]
- 49. Xu W., Kimelman D. (2007) J. Cell Sci. 120, 3337–3344 [DOI] [PubMed] [Google Scholar]
- 50. Goentoro L., Kirschner M. W. (2009) Mol. Cell 36, 872–884 [DOI] [PMC free article] [PubMed] [Google Scholar]
- 51. Schlessinger J. (2000) Cell 103, 211–225 [DOI] [PubMed] [Google Scholar]
- 52. Aliaga J. C., Deschênes C., Beaulieu J. F., Calvo E. L., Rivard N. (1999) Am. J. Physiol. 277, G631–G641 [DOI] [PubMed] [Google Scholar]
- 53. Vidrich A., Buzan J. M., Barnes S., Reuter B. K., Skaar K., Ilo C., Cominelli F., Pizarro T., Cohn S. M. (2005) Am. J. Pathol. 166, 1055–1067 [DOI] [PMC free article] [PubMed] [Google Scholar]
- 54. Sato T., van Es J. H., Snippert H. J., Stange D. E., Vries R. G., van den Born M., Barker N., Shroyer N. F., van de Wetering M., Clevers H. (2011) Nature 469, 415–418 [DOI] [PMC free article] [PubMed] [Google Scholar]
- 55. Snippert H. J., van der Flier L. G., Sato T., van Es J. H., van den Born M., Kroon-Veenboer C., Barker N., Klein A. M., van Rheenen J., Simons B. D., Clevers H. (2010) Cell 143, 134–144 [DOI] [PubMed] [Google Scholar]
- 56. L'Hôte C. G., Knowles M. A. (2005) Exp. Cell Res. 304, 417–431 [DOI] [PubMed] [Google Scholar]
- 57. Kannan K., Givol D. (2000) IUBMB Life 49, 197–205 [DOI] [PubMed] [Google Scholar]
- 58. Houchen C. W., George R. J., Sturmoski M. A., Cohn S. M. (1999) Am. J. Physiol. 276, G249–G258 [DOI] [PubMed] [Google Scholar]
- 59. Quayle A. J., Porter E. M., Nussbaum A. A., Wang Y. M., Brabec C., Yip K. P., Mok S. C. (1998) Am. J. Pathol. 152, 1247–1258 [PMC free article] [PubMed] [Google Scholar]
- 60. Applied Biosystems (1997) User Bulletin #2: ABI Prism 7700 Sequence Detection System, Applied Biosystems, Carlsbad, CA [Google Scholar]
Associated Data
This section collects any data citations, data availability statements, or supplementary materials included in this article.