Abstract
The possible roles of Src family kinases in the enhanced malignant properties of melanomas related to GD3 expression were analyzed. Among Src family kinases only Yes, not Fyn or Src, was functionally involved in the increased cell proliferation and invasion of GD3-expressing transfectant cells (GD3+). Yes was located upstream of p130Cas and paxillin and at an equivalent level to focal adhesion kinase. Yes underwent autophosphorylation even before serum treatment and showed stronger kinase activity in GD3+ cells than in GD3− cells following serum treatment. Coimmunoprecipitation experiments revealed that Yes bound to focal adhesion kinase or p130Cas more strongly in GD3+ cells than in GD3− cells. As a possible mechanism for the enhancing effects of GD3 on cellular phenotypes, it was shown that majority of Yes was localized in glycolipid-enriched microdomain/rafts in GD3+ cells even before serum treatment, whereas it was scarcely detected in glycolipid-enriched microdomain/rafts in GD3− cells. An in vitro kinase assay of Yes revealed that coexistence of GD3 with Yes in membranous environments enhances the kinase activity of GD3− cell-derived Yes toward enolase, p125, and Yes itself. Knockdown of GD3 synthase resulted in the alleviation of tumor phenotypes and reduced activation levels of Yes. Taken together, these results suggest a role of GD3 in the regulation of Src family kinases.
Keywords: Ganglioside, Glycolipids, Membrane, Signal Transduction, Tyrosine Protein Kinase (Tyrosine Kinase), Melanoma, Raft
Introduction
Gangliosides, sialic acid-containing glycosphingolipids, are considered to play essential roles in the development and functions of nerve tissues in vertebrates because they are enriched in nervous systems and their composition is well conserved among species (1, 2). Some gangliosides are also expressed in neuroectoderm-derived cancers such as malignant melanomas and neuroblastomas (3). Besides being markers of cancers, it has been recognized that gangliosides play roles as modulators of signaling in cancer cells, on the basis of the genetic manipulation of glycosylation machineries (4). Ganglioside GD3 in particular is thought to play a key role in malignant melanoma.
Using a GD3-defective mutant of the SK-MEL-28 subline N1 cell (5), the effects of re-expression of GD3 in N1 cells on the phenotypes of melanoma cells have been analyzed. The adaptor molecules p130Cas and paxillin were the major molecules activated and involved in the enhanced cell growth and invasion related to GD3 expression (6). Focal adhesion kinase (FAK)3 also undergoes activation under GD3 expression and is involved in the enhanced malignant properties in GD3+ transfectant cells (7). All these experiments were performed by stimulating melanoma cells with FCS after serum starvation. Similar experiments have been performed using fibroblasts (8), hamster melanoma (9) and CHO cells (10), and the same involvement of GD3 has been reported. Opposite effects of GD3 on vascular smooth muscle cells were also reported (11, 12).
Furthermore, the effects of GD3 on cell adhesion were analyzed (13). Expression of GD3 apparently enhanced cell attachment to the extracellular matrix and increased phosphorylation levels of adaptor molecules during adhesion (13). These results suggested that signals mediated via growth factor receptor(s) and those mediated via adhesion receptor integrins might converge in the vicinity of the cell membrane.
In this study, the roles of Src family kinases in the enhancement of the malignant properties of melanoma cells involving GD3 expression have been examined. Although several members of Src family kinases were expressed in the melanoma cells, only Yes was functionally involved in the enhanced signaling that contributes to the malignant phenotypes of melanoma cells. Mechanisms by which Yes is activated under the influence of GD3 were extensively analyzed.
EXPERIMENTAL PROCEDURES
Antibodies
Anti-phosphotyrosine mAb PY20, anti-FAK (mouse mAb IgG1), anti-paxillin (mouse mAb IgG1), anti-Yes (mouse mAb IgG1), anti-Fyn (mouse mAb IgG2b), anti-Lck (mouse mAb IgG2a), anti-Lyn (mouse mAb IgG1), and anti-flotillin-1 (mouse mAb IgG1) were from BD Transduction Laboratories. Anti-flotillin-1 (rabbit IgG, H-104), anti-p130Cas (rabbit IgG, C-20), anti-FAK (rabbit IgG, C-20), anti-c-Src (rabbit IgG, N-16), anti-c-Src (mouse mAb IgG2a), and anti-Lyn (rabbit IgG, 44) were from Santa Cruz Biotechnology, Inc. (Santa Cruz, CA). Anti-phospho-Src family (Tyr-416, rabbit IgG) was from Cell Signaling Technology, Inc. (Beverly, MA). Anti-rabbit IgG conjugated with HRP was purchased from Cell Signaling Technology, Inc. Anti-mouse IgG conjugated with HRP was purchased from Amersham Biosciences. Anti-mouse IgG conjugated with HRP (Mouse TrueBlotTM ULTRA) was purchased from eBioscience, Inc. (San Diego, CA). Anti-mouse IgG1 Alexa Fluor 555, anti-rabbit IgG-Alexa Fluor 488, and anti-mouse IgG3 Alexa Fluor 488 were purchased from Invitrogen. Anti-GD3 mAb R24 was kindly provided by Dr. L. J. Old at Memorial Sloan-Kettering Cancer Center (New York).
Reagents
Protein G-Sepharose or A-Sepharose beads were from Amersham Biosciences. Purified mouse IgG and rabbit IgG were from Millipore (Temecula, CA). RestoreTM Western blot stripping buffer was from Thermo Scientific (Waltham, MA).
Preparation of siRNAs
Several kinds of StealthTM siRNAs against some portion of human Src, Fyn, and Yes cDNA were designed by Invitrogen, and siRNAs against p130Cas, paxillin, and FAK were designed by Dharmacon Research (Lafayette, CO). They were transfected into a transfectant line G5 and a vector control line V9 with Lipofectamine 2000TM (Invitrogen) according to the manufacturer's protocol. As a nonspecific siRNA control, a sequence targeting firefly (Photinus pyralis) luciferase gene (X65324) 153–175 (Dharmacon Research) or StealthTM siRNA negative control Med and Low (Invitrogen) were used. Finally, selected target sequences for knockdown of Src, Fyn, Yes, p130Cas, paxillin, and FAK were as follows: Src, 5′-GGAGACAGACCUGUCCUUCAAGAAA-3′; Fyn, 5′-GAGCGACAGCUAUUGUCCUUUGGAA-3′; Yes 1, 5′-CCAAGUUCAUAUCCUGCUGGUUUAA-3′; Yes 2, 5′-GGCUGCUAAUAUUCUUGUAGGAGAA-3′; p130Cas, 5′-AACCCACAAGCUGGUGUUCAU-3′; paxillin, 5′-AAGAACGACAAGCCUUACUGU-3′; and FAK, 5′-AAGUGAAGACAAGGACAG AAA-3′.
Cell Lines and Transfectant Cells
SK-MEL-28-N1 was established as described previously (5) and maintained in DMEM supplemented with 7.5% FCS at 37 °C in a humidified atmosphere containing 5% CO2. Construction of a cDNA expression vector of human α2,8-sialyltransferase (GD3 synthase) was as described previously (14), and GD3+ transfectant cells were established by transfecting SK-MEL-28-N1 cells with the cDNA expression vectors and selecting G-418-resistant clones in the presence of G418 (400 μg/ml) (Sigma). The transfectant cells were screened by flow cytometry using mAb R24 (anti-GD3) and maintained in DMEM with 7.5% FCS and G418 (400 μg/ml).
Flow Cytometry
The cell surface expression of GD3 was analyzed by flow cytometry (BD Biosciences) as described previously (6). Control samples were usually prepared using non-relevant mAbs with the same subclasses for individual mAbs.
In Vitro Invasion Assays
Invasion assays were performed with a Boyden chamber as described previously (6), with some modifications. In brief, Matrigel (BD Biosciences) was diluted with ice-cold PBS (100 μg/ml). 0.6 ml were then added to each filter (polyethylene terephthalate membrane, 8-μm pore size, 23.1 mm in diameter, Falcon 3093) and left to be polymerized overnight. The membrane was reconstituted with serum-free medium. The lower chamber (6-well plate, Falcon 3502) was filled with the culture medium with or without serum before the chamber was assembled. Cells (1∼8 × 10⁵ cells/well) were added to serum-free medium in the upper chamber and incubated for 24 h. Then the cells on the surface of the filter were stained with Giemsa (Wako, Osaka) and counted under microscopy.
BrdU Uptake
Cells grown on a 60-well plate were incubated in the presence of BrdU for 14 h according to the instructions of the cell proliferation kit (Amersham Biosciences) and then fixed with acid-ethanol for 30 min. The cells were immunostained with anti-BrdU antibody and Alexa 546-conjugated anti-mouse antibody (Molecular Probes, Invitrogen). The BrdU-positive cells were observed by fluorescence microscopy (BX51, Olympus, Tokyo), and the percentage of BrdU-positive cells was calculated.
MTT Assay
Cells (2 × 10³) were seeded in 98-well plates. An MTT assay was performed by assessing the reduction of MTT to formazan on the basis of the absorbance at 590 nm using an ELISA reader Immuno Mini NJ-2300 (System Instruments, Tokyo).
Preparation of Cell Lysates
2 or 6 × 10⁵ cells were plated in a 6- or 10-cm dish, respectively, and serum-starved for 12 h before treatment with FCS. Then, cells were treated with FCS for 0–120 min at 37 °C. Cells were lysed with a lysis buffer (20 mm Tris-HCl (pH7.5), 150 mm NaCl, 1 mm Na2EDTA, 1 mm EGTA, 1% Triton X-100, 2.5 mm sodium pyrophosphate, 1 mm β-glycerophosphate, 1 mm Na3VO4, leupeptin (1 μg/ml), 1 mm PMSF), and then insoluble materials were removed by centrifugation.
Western Immunoblotting
Lysates were separated with SDS-PAGE using 10–15% gels. The separated proteins were transferred onto an Immobilon-PTM membrane (Millipore). Blots were blocked with 3% BSA in PBS containing 0.05% Tween 20 for 1 h. The membrane was first probed with primary antibodies. After being washed, the blots were then incubated with goat anti-rabbit IgGs or goat anti-mouse IgGs conjugated with HRP (1:2000). After washing, bound conjugates were visualized with an ECL detection system (PerkinElmer Life Sciences). HL-60, a promyelocytic leukemia cell line, was used as a positive control for Lyn.
Immunoprecipitation
The lysates were immunoprecipitated with monoclonal or polyclonal antibody bound to protein G-Sepharose or A-Sepharose at 4 °C for 75 min. The beads were washed five times with washing buffer (50 mm Tris-HCl (pH7.5), 150 mm NaCl, 1% Triton X-100, 1 mm Na3VO4, 1 mm EDTA) and finally resuspended in 20 μl of 2× SDS sample buffer. The precipitated proteins were separated using SDS-PAGE and then immunoblotted.
Knockdown of Src, Fyn, Yes, p130Cas, Paxillin, and FAK by siRNA
Melanoma cells were plated at 70∼80% confluency in 3.5- or 6-cm cell culture dishes and were cultured overnight. They were transiently transfected with siRNAs (100 nm) of the target gene or control in Opti-MEM I medium (Invitrogen) with Lipofectamine 2000TM (Invitrogen) following the manufacturer's instructions. Four hours later, the Opti-MEM I medium was replaced by regular culture medium. The efficiency of knockdown against individual gene products and the effects of knockdown on the other molecules were assessed with immunoblotting 48 h after the transfection. For the invasion assay and BrdUrd assay, cells were collected 2 days after the transfection and replated for the assays.
In Vitro Kinase Assay
The lysates prepared from cells treated with FCS were immunoprecipitated using anti-Yes antibody, and the immunocomplexes were washed three times with washing buffer (50 mm Tris-HCl (pH7.5), 150 mm NaCl, 1% Triton X-100, 1 mm Na3VO4, 1 mm EDTA) and twice with kinase buffer (30 mm HEPES (pH7.5), 10 mm MgCl2, 2 mm MnCl2, 10 μm Na3VO4). Then, the immunocomplexes were resuspended in 20 μl kinase buffer with 2.62, 3.00, or 6.99 μg of acid-denatured enolase (Sigma) as a substrate, 1 μm ATP (Sigma), and 10 μCi of [γ-32P]ATP (PerkinElmer Life Sciences). For in vitro kinase assays in the presence of liposome-embedded GD3, GM1, or GD1a, dipalmitoylphosphatidycholine (0.5 μmol) (NOF Corp., Tokyo) and cholesterol (Sigma-Aldrich) (0.5 μmol), GD3, GM1 (1, 2.5, 5, 10, or 20 μg) or GD1a (5, 10, or 20 μg) were mixed in chloroform/methanol (2:1) and dried by evaporation. Then, they were dissolved in 100 μl of the kinase buffer, and liposomes were formed. An aliquot of them (3.6 μl) was added to the immunocomplexes resuspended in 21.4 μl of the kinase buffer containing 3 μg of acid-denatured enolase, 1 μm ATP, and 10 μCi of [γ-32P]ATP. The kinase reaction was carried out at room temperature for 20 min. The final reaction products were denatured in SDS sample buffer and separated by SDS-PAGE using 10% gels. The bands were visualized by TyphoonTM 8600 (Amersham Biosciences).
Isolation of the GEM/Raft Fraction
Glycolipid-enriched microdomains (GEM)/raft membrane microdomains were prepared using a detergent extraction method essentially as described by Mitsuda et al. (15). Cells were plated at a density of 5 × 10⁵ per 15-cm dish (Greiner Bio One, Frickenhausen, Germany) and cultured up to 80% confluency, and six dishes of cells were used for each preparation. After being washed twice with ice-cold PBS, the cells were collected, suspended in 1 ml of TNE/Triton X-100 buffer (1% Triton X-100, 25 mm Tris-HCl (pH7.5), 150 mm NaCl, 1 mm EGTA), Dounce homogenized 20 times, and mixed with an equal volume of 80% sucrose (w/v). Then, samples (2 ml) were placed at the bottom of Ultra-Clear centrifuge tubes (Beckman Instruments, Fullerton, CA). 2 ml of 30% sucrose in TNE buffer without Triton X-100 was laid on top of the samples, and 1 ml of 5% (w/v) sucrose in TNE buffer without Triton X-100 was laid on top. The samples were centrifuged at 105,000 × g in a MLS50 rotor (Beckman Instruments) for 16 h at 4 °C. The entire procedure was performed at 4 °C. From the top of the gradient, 0.5 ml each of fraction was collected to yield 10 fractions. Furthermore, the GEM/raft fraction was prepared using a non-detergent extraction method essentially as described by Nishio et al. (16). Cells were plated at a density of 5 × 10⁵ per 15-cm dish and cultured up to 80% confluency, and six dishes of cells were used for each preparation. After being washed twice with ice-cold PBS, the cells were scraped in 1 ml of 0.5 m sodium carbonate buffer (pH 11.0). The cells were sequentially homogenized using a loose-fitting Dounce homogenizer (10 strokes), a Polytron tissue grinder (three 10-s bursts), and a sonicator (three 20-s bursts). All procedures were carried out at 4 °C. The homogenate (1 ml) was then adjusted to 45% (w/v) sucrose by adding 1 ml of 90% (w/v) sucrose prepared in 2× MNE buffer (25 mm 4-morpholineethanesulfonic acid (pH 6.5), 150 mm NaCl, 5 mm EDTA). The final pH of the mixture was 10.2. A discontinuous sucrose gradient was formed by overlaying 2 ml of 35% (w/v) sucrose onto the mixture and then 1 ml of 5% (w/v) sucrose. Both of these layers were prepared with MNE containing 0.25 m sodium carbonate. The samples were centrifuged at 105,000 × g in a MLS50 rotor (Beckman Instruments) for 16 h at 4 °C. From the top of the gradient, 0.5 ml each of fraction was collected to yield 10 fractions. The components in each fraction were concentrated by centrifugation at 100,000 × g for 2 h at 4 °C in MNE buffer, and precipitates were resolved in the lysis buffer (10 mm Tris-HCl (pH7.4), 150 mm NaCl, 10 mm MgCl2, 0.5% Nonidet P-40, 1 mm Na3VO4) and used for Western immunoblotting. To investigate distribution patterns of phosphorylated Yes inside/outside of GEM/rafts, antibodies on the membranes were stripped using Western blot stripping buffer for 1 h at 37 °C after immunoblotting by an anti-phospho-Src family (Tyr-416) antibody. Then, the membrane was blocked with 3% BSA in PBS containing 0.05% Tween 20 for 1 h and was probed with an anti-Yes antibody.
Immunocytostaining
Cells were fixed in paraformaldehyde (4% in PBS for 10 min) and then incubated with 0.1% Triton X-100 in PBS for 5 min at room temperature. After being washed with PBS, nonspecific binding was blocked with 10% normal goat serum in PBS for 15 min at room temperature. The fixed cells were incubated with primary antibodies in PBS containing 10% normal goat serum overnight at 4 °C. After being washed, nonspecific binding was blocked with 10% normal goat serum in PBS for 15 min at room temperature. They were incubated with anti-mouse IgG1-Alexa Fluor 555 and anti-rabbit IgG-Alexa Fluor 488 or anti-mouse IgG3-Alexa Fluor 488 in PBS containing 10% normal goat serum for 60 min at room temperature. The resulting staining patterns were imaged using a confocal microscope (Fluoview FV500, Olympus).
Knockdown of GD3 Synthase with an shRNAi in Melanoma Cell Line SK-MEL-28
To stably knock down GD3 synthase in SK-MEL-28, we used an shRNAi expression plasmid as described previously (17). After transfection of the anti-GD3 synthase shRNAi vector into SK-MEL-28 and subsequent selection with puromycin (0.4 μg/ml) (Sigma), GD3 knockdown clones were established.
Image Analysis
To analyze the band intensities in immunoblotting and the autoradiograph, bands were scanned by Adobe Photoshop CS2 or TyphoonTM 8600 and quantified using National Institutes of Health Image 1.61.
Statistical Analysis
Statistical significance of data were determined using Student's t test.
RESULTS
Generation of GD3-expressing Lines from SK-MEL-28-N1
As described previously (6), SK-MEL-28-N1 was transfected by an expression vector of GD3 synthase cDNA, resulting in the establishment of GD3+ transfectant cells G5 and G11. As shown in Fig. 1, G5 and G11 showed definite expression of GD3, whereas transfectants of the vector alone, V5 and V9, showed no GD3. In TLC, the transfectant contained 67.1% of GD3 (∼ 0.27 μg/mg wet tissue) compared with that in SK-MEL-28, as shown in the previous report (supplemental Fig. S1) (7). A few faint bands were detected as well as GD3 bands, suggesting that a minor portion of GD3 was converted. SK-MEL-28-N1 and controls derived from it showed no band of GD3 (below 0.005 μg/mg wet tissue) in TLC, as suggested in flow cytometry.
FIGURE 1.
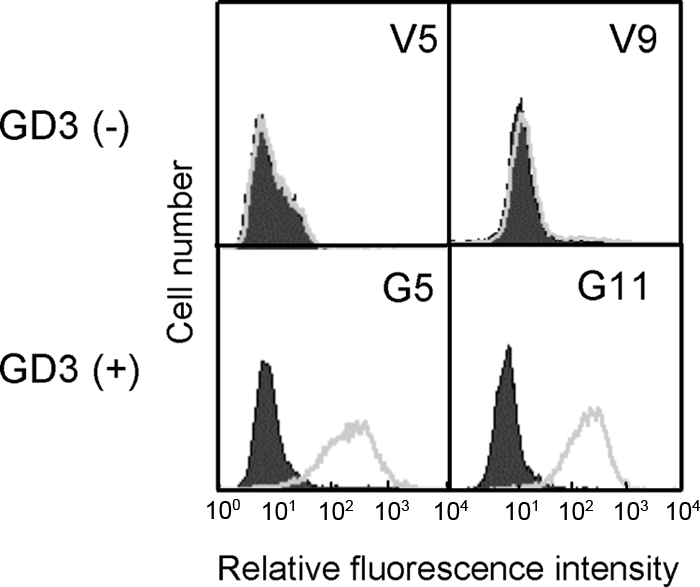
Expression of GD3 on SK-MEL-28 N1-derived transfectant cells. Flow cytometry of GD3 expression on two controls (V5, V9) and two GD3 synthase-cDNA transfectant cells (G5, G11) was performed with mAb R24 and FITC-labeled secondary antibody. Solid peaks represent negative controls prepared using a non-relevant mAb with the same subclass (IgG3).
Expression of Src Family Kinases and Their Involvement in the Malignant Properties of Melanoma Cells
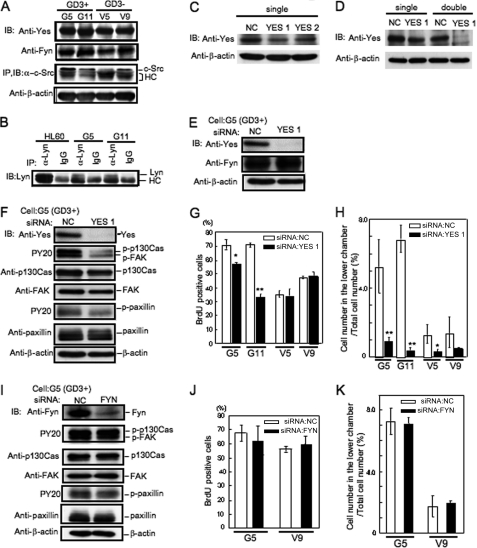
To determine the expression of Src family kinases in melanoma cells, immunoprecipitation and immunoblotting were performed with antibodies for individual Src family kinases. These results showed that the expression levels of Yes and Fyn were fairly high, whereas those of Src and Lyn were low (Fig. 2, A and B). Expression of Lck was not detected (supplemental Fig. S2). Involvement of Src family kinases in cell proliferation and invasion was analyzed by knockdown with siRNAs against individual Src family kinases. Between two siRNAs for the knockdown of Yes, highly effective siRNA (YES1) was selected (Fig. 2C). Because a single knockdown of Yes was not enough, repeated transfection of YES1 siNRA was performed, resulting in sufficient reduction of Yes protein (Fig. 2D). To examine specificity of YES1 siRNA, it was analyzed whether Fyn protein was affected by YES1. Consequently, no effect on Fyn was observed (Fig. 2E). After the transfection of individual siRNAs into GD3+ transfectant cells and GD3− vector control cells, cell proliferation and invasion activity were analyzed with the BrdUrd assay and the Boyden chamber invasion assay, respectively. As shown in Fig. 2F, tyrosine phosphorylation levels of FAK, p130Cas, and paxillin were definitely suppressed by knockdown of Yes, although their total protein amounts were not affected in GD3+ cells. The proliferation and invasion activities were markedly reduced after knockdown of Yes in GD3+ cells (G5 and G11) (Fig. 2, G and H), whereas they showed no change by knockdown of Yes in GD3− cells (V5 and V9). On the other hand, knockdown of Fyn in GD3+ cells did not affect the phosphorylation levels of FAK, p130Cas, and paxillin (Fig. 2I). Furthermore, the proliferation and invasion activity showed no change by knockdown of Fyn (Fig. 2, J and K). (Data of Src are in supplemental Fig. S3).
FIGURE 2.
Expression of Src family kinases and implication of them in the phenotypes of melanoma cells. Immunoblotting (IB) or immunoprecipitation/immunoblotting (IP) were performed with antibodies for individual Src family kinases. A, total cell lysates from two GD3+ and GD3− cells were immunoblotted with an anti-Yes or an anti-Fyn antibody. For c-Src, immunoprecipitates with an anti-c-Src antibody were immunoblotted with anti-c-Src antibody. B, immunoprecipitates with an anti-Lyn antibody were immunoblotted with an anti-Lyn antibody. HC in A and B means IgG heavy chain. C, siRNAs for the knockdown of Yes. Yes suppression after transfection of G5 (GD3+) with siRNAs YES1 or YES2 was examined by immunoblotting. D, G5 (GD3+) was transfected with YES1 twice with an interval of 2 days, and immunoblotting was performed. E, specificity of an anti-Yes siRNA, YES1. The protein level of Fyn was not affected by the knockdown of Yes. F–K, involvement of Src family kinases in the cell proliferation and invasion of melanoma cells. G5, G11 (GD3+), and V5, V9 (GD3−) were transfected with anti-Yes, Fyn, or c-Src siRNAs. The effects of the knockdown of Yes (F) or Fyn (I) on the phosphorylation levels of p130Cas, FAK, and paxillin in G5 (GD3+) were analyzed by immunoblotting as shown in the figures. A significant reduction of the tyrosine phosphorylation levels of FAK, p130Cas, and paxillin by knockdown of Yes was observed, whereas knockdown of Fyn had no effect. Then, BrdU uptake (G and J) and invasion activity (H and K) were examined. The experiments were performed in triplicates, and mean ± S.D. are presented. *, p < 0.05; **, p < 0.01. Note that significant suppression was observed only in G5 and G11 (GD3+) between anti-Yes siRNA- and control siRNA-treated cells. (Data on Src are in supplemental Fig. S3.) NC in C–K means a negative control, StealthTM siRNA negative control (Invitrogen).
Yes Is Located Upstream of p130Cas and Paxillin and in Equal Level to FAK
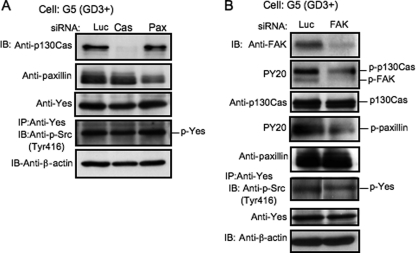
To clarify the position of Yes in the signaling pathway, knockdown of Yes, FAK, p130Cas, and paxillin was performed with siRNAs. As shown in Fig. 3, A and B, after knockdown of p130Cas or paxillin with individual siRNAs, the total amounts of p130Cas or paxillin were definitely suppressed, respectively, whereas tyrosine phosphorylation of Yes was not affected. After knockdown of FAK, the phosphorylation levels of Yes were partially suppressed. On the other hand, after knockdown of Yes, the phosphorylation levels of p130Cas and paxillin were strongly suppressed and that of FAK was partially suppressed (Fig. 2F). These results indicated that Yes was located upstream of p130Cas and paxillin and at an equivalent level to FAK.
FIGURE 3.
Effects of the knockdown of p130Cas, paxillin, or FAK on phosphorylation levels of Yes. A, the effects of the knockdown of p130Cas or paxillin on the phosphorylation levels of Yes in G5 were examined by immunoblotting (IB). The tyrosine phosphorylation level of Yes at Tyr-416 was not affected. IP, immunoprecipitation. B, the effects of the knockdown of FAK on the phosphorylation levels of Yes, p130Cas, and paxillin were examined in G5. The phosphorylation level of Yes at Tyr-416 was partially suppressed, whereas those of p130Cas and paxillin were strongly suppressed.
Enhanced Phosphorylation and Kinase Activity of Yes under GD3 Expression
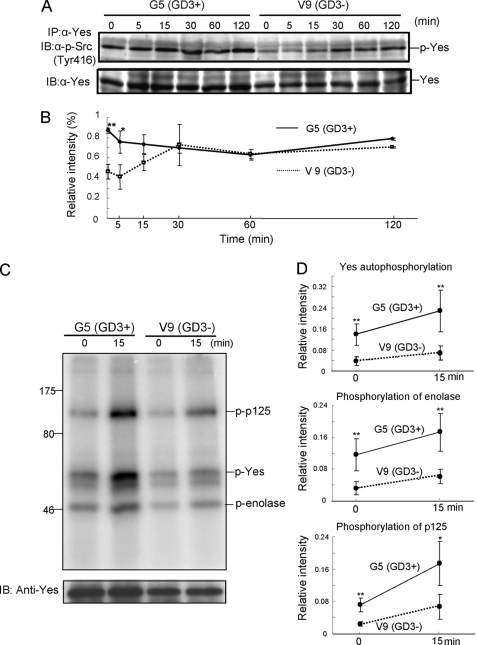
The time course of tyrosine phosphorylation levels of Yes in GD3+ cells and GD3− cells after FCS treatment was analyzed. Cells were treated with FCS after serum starvation for 12 h, and the tyrosine phosphorylation levels of Yes were observed up to 120 min after the addition of FCS (Fig. 4, A and B). Stronger tyrosine phosphorylation of Yes in GD3+ cells than in GD3− cells was observed up to 15 min after stimulation of FCS. Interestingly, the tyrosine phosphorylation level at Tyr-416 was already increased in GD3+ cells even before FCS treatment. Then, in vitro kinase assays were done with enolase as a substrate to determine whether GD3 enhanced kinase activity of Yes. We conducted the in vitro kinase assay using 3 μg of enolase and 1 μm ATP on the basis of the preliminary experiments (supplemental Fig. S4). The bands of autophosphorylated Yes, phosphorylated p125, and phosphorylated enolase were stronger in GD3+ cells than in GD3− cells at both 0 and 15 min after FCS treatment (Fig. 4, C and D), suggesting that Yes is already activated before FCS treatment, although not fully, and activated more strongly by FCS in GD3+ cells.
FIGURE 4.
Tyrosine phosphorylation of Yes at Tyr-416 by FCS treatment. A, G5 (GD3+) and V9 (GD3−) were treated with FCS after serum starvation for 12 h, and Yes was immunoprecipitated (IP) from their lysates at the indicated time points. Then tyrosine phosphorylation of Yes at Tyr-416 was analyzed by an anti-phospho-Src family (Tyr-416) antibody. IB, immunoblotting. B, the relative intensity of bands of p-Yes in A was measured using National Institutes of Health Image 1.61 and plotted after correction with that of Yes. The experiments were performed in triplicates, and mean ± S.D. are presented. *, p < 0.05; **, p < 0.01. C, kinase activity of Yes under GD3 expression. An in vitro kinase assay was done with enolase as a substrate to determine whether GD3 enhances the kinase activity of Yes. G5 (GD3+) and V9 (GD3−) were treated with FCS after serum starvation for 12 h, and Yes was immunoprecipitated from their lysates. Then, an in vitro kinase assay was performed using 3 μg of enolase and 1 μm ATP. D, the relative intensity of bands in C was measured using National Institutes of Health Image 1.61 and plotted after correction with those of Yes. The experiments were performed in triplicates, and mean ± S.D. are presented. *, p < 0.05; **, p < 0.01. Note that the bands of autophosphorylated Yes, phosphorylated p125, and phosphorylated enolase were stronger in GD3+ cells than those in GD3− cells at both 0 min and 15 min after FCS treatment.
GD3 Expression Causes Enhanced Association of Yes with FAK and p130Cas
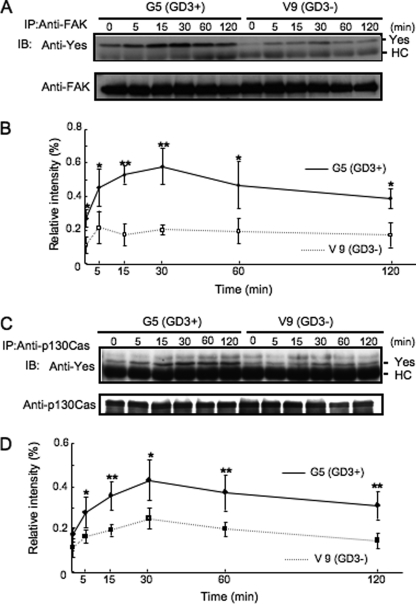
To investigate whether expression of GD3 in melanoma cells is involved in the formation of complexes of Yes with FAK and/or p130Cas after FCS treatment, immunoprecipitation/immunoblotting was performed using lysates from GD3+ and GD3− melanoma cells during the FCS treatment. As shown in Fig. 5, A and B, the band intensities of Yes coprecipitated with FAK from 0 to 120 min were generally higher in GD3+ transfectant cells. p130Cas was also associated with Yes much more in GD3+ transfectants compared with GD3− cells (Fig. 5, C and D). The presence of equivalent amounts of Yes in both types of cells was confirmed (supplemental Fig. S5). Consequently, molecular complexes consisting of Yes and FAK and/or p130Cas were formed more strongly in GD3+ cells than in GD3− cells.
FIGURE 5.
GD3 expression enhanced association of Yes with FAK and p130Cas. A, G5 (GD3+) and V9 (GD3−) were treated with FCS after serum starvation for 12 h, and FAK was immunoprecipitated (IP) from their lysates at the indicated time points. Coprecipitated Yes as well as FAK was immunoblotted (IB) by the individual antibodies. Results of immunoblotting for Yes (upper panel) and FAK (lower panel) are shown. B, the relative intensity of bands in A was measured using National Institutes of Health Image 1.61 and plotted after correction with that of FAK. The experiments were performed in triplicates, and mean ± S.D. are presented. *, p < 0.05; **, p < 0.01. C, G5 (GD3+) and V9 (GD3−) were treated with FCS after serum starvation for 12 h, and p130Cas was immunoprecipitated from their lysates at the indicated time points. Coprecipitated Yes as well as p130Cas was immunoblotted by the individual antibodies. Results of immunoblotting for Yes (upper panel) and p130Cas (lower panel) were shown. D, relative intensity of bands in C was measured using National Institutes of Health Image 1.61 and plotted after correction with that of p130Cas. The experiments were performed in triplicates, and mean ±S.D. are presented. *, p < 0.05; **, p < 0.01.
Localization of Yes in the GEM/Rafts
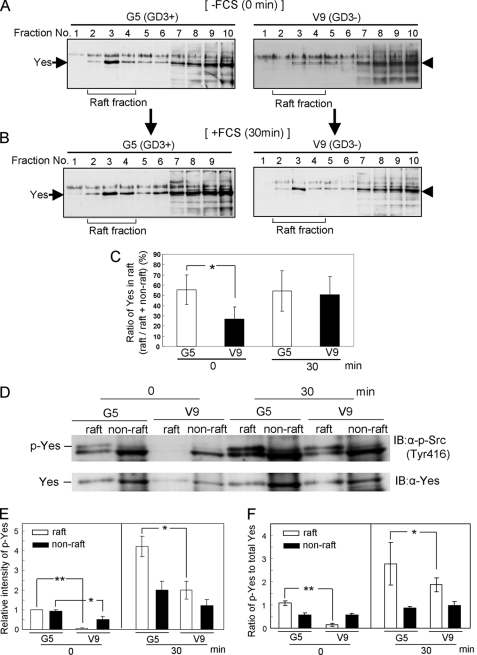
To clarify molecular mechanisms by which kinase activity, phosphorylation of Tyr-416, and complex formation of Yes were increased in GD3+ transfectant cells, the intracellular localization of Yes in the GEM/raft was analyzed. Sucrose density gradient fractionation of Triton X-100 extracts was performed using flotillin-1 as a marker of GEM/rafts. It was detected in fractions 2–4 (supplemental Fig. S6). Bands of Yes were found at much higher levels in GEM/raft fractions of the GD3+ cells compared with GD3− cells at time 0, whereas its bands in GEM/raft fractions were found in GD3− control cells at the same level as GD3+ transfectant cells at 30 min after FCS treatment (Fig. 6A–C). Both levels of phosphorylated Yes and ratios of phosphorylated Yes to total Yes in GEM/raft fractions were significantly higher in GD3+ transfectant cells than in GD3− control cells both at time 0 and 30 min (Fig. 6, D–F). On the other hand, ratios of phosphorylated Yes to total Yes in non-GEM/raft fractions of GD3− cells were almost equivalent to those in GD3+ cells both at time 0 and 30 min. These results suggested that Yes in GEM/raft fractions might be constitutively activated in GD3+ cells. Furthermore, similar patterns of Yes localization were observed when a non-detergent method was used for the preparation (supplemental Fig. S7).
FIGURE 6.
Alteration in the floating patterns of Yes in sucrose density gradient fractions. Floating patterns of Yes in the extracts from G5 (GD3+) and V9 (GD3−) at 0 and 30 min after FCS treatment were shown. Triton X-100 extracts were fractionated by sucrose density gradient ultracentrifugation, and each fraction was used for immunoblotting by an anti-Yes antibody. A, results for G5 (GD3+) and V9 (GD3−) before FCS treatment. B, results for G5 (GD3+) and V9 (GD3−) at 30 min after FCS treatment. Note that definite bands of Yes were found in GEM/raft fractions of the GD3+ cells compared with GD3− cells at time 0. C, bands in A and B were measured using National Institutes of Health Image 1.61, and the relative intensities in GEM/raft fractions (fractions 2–4) against those in GEM/raft fractions plus non-GEM/raft fractions (fractions 6–10) were plotted. The experiments were performed in triplicates, and mean ± S.D. are presented. *, p < 0.05. D, the GEM/raft fractions at 0 and 30 min after FCS treatment were isolated using Triton X-100 extracts. GEM/raft fractions (fraction 2, 3, and 4) and non-GEM/raft fractions (fractions 6–10) were used for immunoblotting by an anti-phospho-Src family (Tyr-416) antibody (upper panel) and an anti-Yes antibody (lower panel). Antibodies on the membranes were stripped using Western blot stripping buffer after immunoblotting by an anti-phospho-Src family (Tyr-416) antibody, and the membrane was immunoblotted by an anti-Yes antibody. E, the relative intensity of bands of phosphorylated Yes was measured using National Institutes of Health Image 1.61. F, the ratios of phosphorylated Yes to total Yes was measured using National Institutes of Health Image 1.61. The experiments were performed in triplicates, and mean ± S.D. are presented. *, p < 0.05; **, p < 0.01.
Yes Colocalizes with GD3 and Flotillin-1 before FCS Treatment in GD3+ Cells
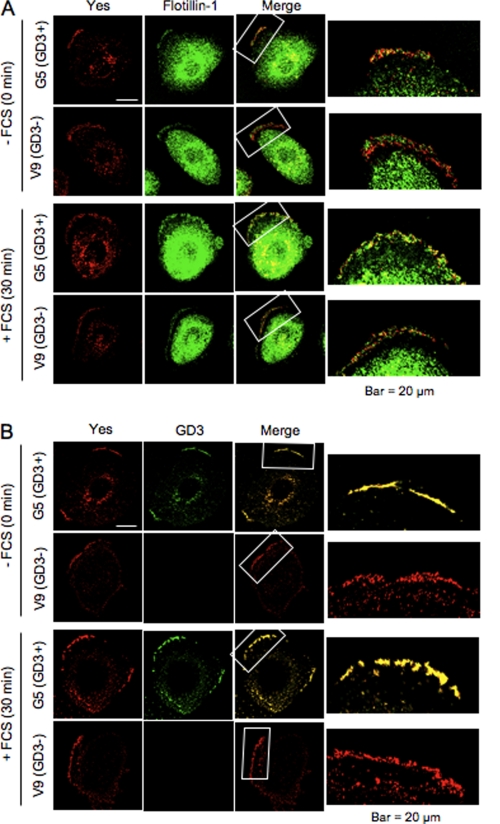
Yes colocalized with flotillin-1 only in GD3+ cells at time 0, whereas its colocalization was almost equivalent between GD3+ cells and GD3− cells 30 min after FCS treatment (Fig. 7A). Yes colocalized with GD3 in GD3+ cells as expected (Fig. 7B). These results corresponded well with those in Fig. 6.
FIGURE 7.
Immunocytostaining of Yes and flotillin-1 or GD3. Colocalization of Yes, flotillin-1, and GD3 was examined at time 0 and 30 min after FCS treatment. Cells were fixed as described under “Experimental Procedures.” Yes was stained with anti-Yes mouse mAb and anti-mouse IgG1 Alexa Fluor 555. Flotillin-1 was stained with anti-flotillin-1 rabbit antibody and anti-rabbit IgG Alexa Fluor 488 (A). GD3 was stained with mAb R24 and anti-mouse IgG3 Alexa Fluor 488 (B). The staining pattern was analyzed with confocal laser microscopy.
Liposome-embedded GD3 Enhances Kinase Activity of Yes from GD3− Cells
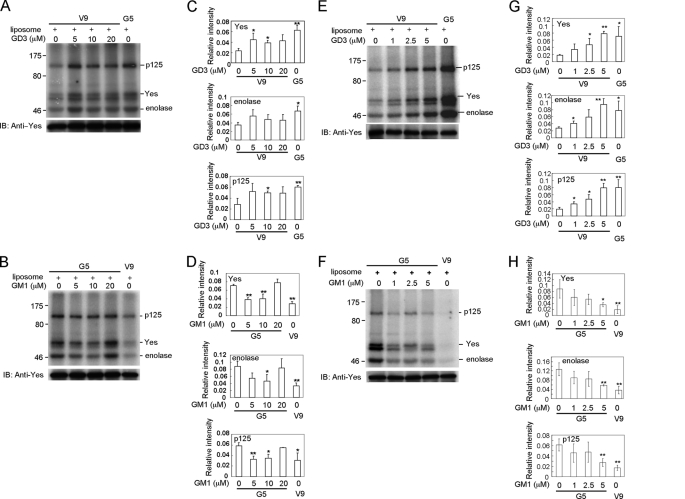
We conducted in vitro kinase assays using immunoprecipitated Yes from GD3− cells in the presence of liposome-embedded GD3 to examine effects of GD3 on the kinase activity in a membrane-like environment. The effects of direct addition of GD3 on the kinase activity of immunoprecipitated Yes are shown in supplemental Fig. S8, showing some increase in its kinase activity at 1–50 μm. As shown in Fig. 8, A, C, E, and G, Yes kinase activity was higher in samples with liposome-embedded GD3 than in samples with liposome only. The effects of GD3-liposome were dose dependent, and the kinase activity of Yes was enhanced particularly at around 5 μm of GD3-liposome. On the other hand, kinase activity of Yes from GD3− cells did not change in the presence of liposome-embedded GM1 or GD1a (supplemental Fig. S9, A–D). Furthermore, kinase activity of Yes from GD3+ cells was significantly reduced in the presence of liposome-embedded GM1 (Fig. 8, B, D, F, and H). The kinase activity was particularly reduced at around 5 μm of GM1-liposome. These results suggested the possibility that kinase activity of Yes was oppositely regulated by GD3 and GM1 in the in vitro kinase assay and probably in melanoma cells.
FIGURE 8.
Liposome-embedded GD3 enhanced kinase activity of Yes from GD3− cells and liposome-embedded GM1 suppressed kinase activity of Yes from GD3+ cells. A, in vitro kinase assays using immunoprecipitated Yes from GD3− cells were performed in the presence of liposome-embedded GD3 (5, 10, and 20 μm). C, the relative intensities of phosphorylation bands of enolase and p125 as well as of Yes were measured using National Institutes of Health Image 1.61 and plotted in graphs after correction with that of Yes. The experiments were performed in triplicates, and mean ± S.D. are presented. *, p < 0.05; **, p < 0.01. B, in vitro kinase assays using immunoprecipitated Yes from GD3+ cells were performed in the presence of liposome-embedded GM1 (5, 10, and 20 μm). D, the relative intensities of phosphorylation bands of enolase and p125 as well as Yes were measured using National Institutes of Health Image 1.61 and plotted in graphs as described in C. The experiments were performed in triplicates, and mean ± S.D. are presented. *, p < 0.05; **, p < 0.01. E, in vitro kinase assays using immunoprecipitated Yes from GD3− cells were performed in the presence of liposome-embedded GD3 (1, 2.5, and 5 μm). G, the relative intensities of phosphorylation bands of enolase and p125 as well as of Yes were measured using National Institutes of Health Image 1.61 and plotted in graphs as described in C. The experiments were performed in triplicates, and mean ± S.D. are presented. *, p < 0.05; **, p < 0.01. F, in vitro kinase assays using immunoprecipitated Yes from GD3+ cells were performed in the presence of liposome-embedded GM1 (1, 2.5, and 5 μm). H, the relative intensities of phosphorylation bands of enolase and p125 as well as Yes were measured using National Institutes of Health Image 1.61 and plotted in graphs as described in C. The experiments were performed in triplicates, and mean ± S.D. are presented. *, p < 0.05; **, p < 0.01. Note that significant suppression of kinase activity of Yes derived from GD3+ cells by liposome-embedded GM1 was observed at around 5 μm.
Effects of GD3 Synthase Knockdown in SK-MEL-28 by shRNAi
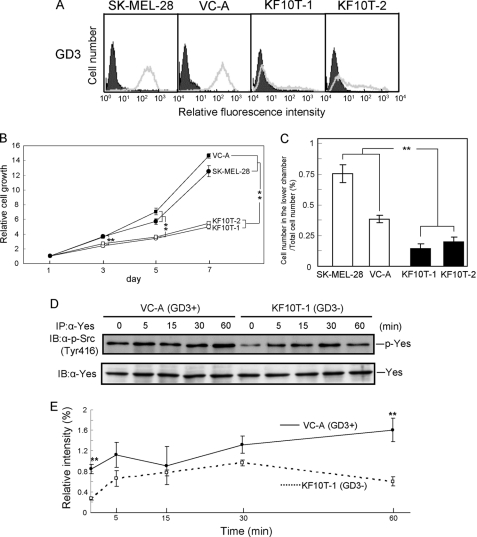
After the transfection of SK-MEL-28 with the shRNAi expression plasmid, two GD3 synthase-knockdown clones (KF10T-1 and KF10T-2) were established. A control clone transfected with PH1-RNA puro alone (VC-A) was also isolated (Fig. 9A). To clarify the effects of GD3 synthase knockdown on cancer properties, an MTT assay and invasion assay were performed. In the MTT assay, the GD3 synthase knockdown cells showed markedly decreased cell growth compared with the control cell and the parent cell line (Fig. 9B). The invasion assay revealed that GD3 synthase knockdown cells had much lower invasion activity than the controls (Fig. 9C), indicating reduced malignant properties in the GD3 synthase knockdown cells.
FIGURE 9.
Effects of GD3 synthase knockdown on cancer properties and phosphorylation levels of Yes. A, expression of GD3 in SK-MEL-28 (parent cell line), a vector control (VC-A), and two GD3 synthase knockdown cell lines (KF10T-1 and KF10T-2). B, results of the MTT assay. Cells (2 × 10³) were seeded in 98-well plates. At days 1, 3, 5, and 7 of culture, the MTT assay was performed. The experiments were performed in triplicates, and mean ± S.D. are presented. **, p < 0.01. C, invasion activity of the GD3 synthase knockdown cells was analyzed by using a Boyden chamber as described under “Experimental Procedures.” The ratios of the cell number in the lower chamber/total cell number applied are shown. The experiments were performed in triplicates, and mean ± S.D. are presented. **, p < 0.01. D, immunoblotting to analyze the phosphorylation levels of Yes. VC-A (GD3+) and KF10T-1 (GD3−) were treated with FCS after serum starvation for 12 h, and Yes was immunoprecipitated from their lysates at the indicated time points. Then tyrosine phosphorylation of Yes at Tyr-416 was analyzed by an anti-phospho-Src family (Tyr-416) antibody. E, the relative intensity of bands of p-Yes in D was measured using National Institutes of Health Image 1.61 and plotted after correction with that of Yes. The experiments were performed in triplicates, and mean ± S.D. are presented. **, p < 0.01.
Suppressed Phosphorylation of Yes by GD3 Synthase Knockdown
The time course of tyrosine phosphorylation levels of Yes in GD3 synthase knockdown cells as well as control cells after FCS treatment was analyzed. Cells were treated with FCS after serum starvation for 12 h, and tyrosine phosphorylation levels of Yes were observed up to 60 min (Fig. 9, D and E). Significantly lower tyrosine phosphorylation of Yes in GD3 synthase knockdown cells than in the control cells was observed before FCS treatment and 60 min after stimulation of FCS. All these results corresponded well with those observed in GD3 synthase overexpression experiments.
DISCUSSION
Following the cloning of cDNAs of glycosyl transferases, such as of GD3 synthase (14), the expression and role of gangliosides in cancer cells has been studied, particularly in malignant melanomas (6, 18), T-cell leukemias (19) and lung cancers (20). In particular, strong enhancement of activation of adaptor molecules such as p130Cas and paxillin and their involvement in the malignant properties of melanomas under GD3 expression have been demonstrated. Roles for FAK in the activation of p130Cas and paxillin were also elucidated (7). However, no molecules interacting with GD3 in the vicinity of the cell membrane to generate strong growth and/or invasion signals have been identified.
The Src family of non-receptor protein tyrosine kinases plays critical roles in the regulation of various biological signals for cell growth, adhesion, motility, survival, and angiogenesis (21). Constitutive activation of Src family kinases often results in the induction of malignant transformation of a wide variety of cell lineages. High levels of expression of Src family kinases are also found in many cancer tissues. They are also associated with progression and metastasis as well as in the evolution of cancers (21).
In particular, Yes has been detected in colon cancers (22) and breast cancers and, less frequently, in gastric cancers (23), and malignant melanomas (24). c-Yes was activated in colorectal carcinoma liver metastases (25), indicating that elevated c-Yes kinase activity in liver metastases was associated with a worse prognosis (25). Differential behaviors between Src and Yes during mitosis of colon carcinoma cells were also reported (26), namely Src activity increased and Yes activity decreased during mitosis. Furthermore, an increase in c-Yes expression level and activity promoted motility but not proliferation of colon cancer cells (22). All these results suggested that Yes is implicated in colon cancers with differential ways of regulation, mechanisms, and resulting effects compared with Src.
In melanomas, an elevated expression of Yes and higher tyrosine kinase activity was detected in a wide range of melanoma cells than in normal melanocytes (24). The average kinase activity of c-Yes was 5-10-fold higher in melanomas than melanocytes, suggesting that derangement of expression of the c-Yes tyrosine kinase might have a role in the malignant progression of the human melanocytes. An intriguing point was that c-Src did not show increased expression. In human brain metastatic melanoma cells, treatment of cells with neurotrophins resulted in the increase of the protein tyrosine kinase activity of c-Yes but not of c-Src (27). These results suggest that c-Yes is mainly activated by either intrinsic or extrinsic factors among Src family kinases in human melanomas and that this signaling causes increased cell growth and/or metastasis of melanoma cells. Actually, c-Yes has been more strongly implicated than c-Src in melanomas and might make a more significant contribution than c-Src in the natures of melanomas.
GEM/rafts have been considered to be platforms for the regulation of various biosignals as well as endocytosis and cholesterol turnover (28). Among molecules localized in GEM/rafts, G-proteins and Src family kinases have been known to be localized at the reverse side of the cell membrane in GEM/rafts (29). Src is known to undergo myristylation, resulting in the membrane anchoring to efficiently express its function (30). Yes also undergoes acylations and plays roles on the cell membrane (31). However, Yes was preferentially localized in lipid rafts, whereas most Src was in non-raft fractions in PC12 cells (32). This difference in the intracellular localization between Yes and Src might explain the results of our knockdown experiments, i.e. only Yes showed significant effects on tumor phenotypes after siRNA treatment (Fig. 2 and supplemental Fig. S3).
The alteration in the location inside/outside of GEM/rafts and in activation levels of Yes under GD3 expression appeared to be critical for the malignant properties of melanoma cells. Here, Yes appeared to be constitutively activated in GD3+ cells, i.e. Yes was already phosphorylated even before treatment with FCS, although not fully. Namely, high levels of GD3 in GEM/rafts should modulate the natures of Yes and activate without extrinsic stimulation. Therefore, already activated Yes in GEM/rafts might be able to induce stronger activation signals upon the stimulation with FCS in GD3+ cells than in GD3− cells. This was reflected in the increased kinase activity of Yes as phosphorylated bands of Yes, p125, and enolase in GD3+ cells (Fig. 4C). Consequently, absolute activation levels of Yes before and during FCS stimulation should be crucial to enhance malignant tumor phenotypes in GD3+ cells.
There is also the possibility that high levels of GD3 might alter the physicochemical nature of GEM/rafts that affects the intracellular localization of signaling molecules and receptors. Changes of Yes localization during GD3 expression might be addressed using an inducible gene expression system. As shown by analysis of GD3 and Lyn in granular cells of the cerebellum, GD3 and Yes might have physical association in the context of cell membrane (33). Association of GD3 and Yes could be observed in preliminary experiments in our laboratory (unpublished data).
Liposomes are cell membrane-mimicking structures useful to form cell membrane-like environments (34). In particular, interaction between glycosphingolipids and other membrane molecules should be examined under the physiological situation based on the re-constitution of “proteo-liposomes” (35). In this study, we attempted to construct artificial environments, including glycolipids and signaling molecules. As we expected, GD3 and GM1 showed differential effects on the biosignals similar to their effects found in the living cells (7, 36, 15). GD1a showed no significant effects on the kinase activity of Yes. All these results are in good agreement with our previous reports. Namely, monosialyl gangliosides such as GM1 and GM2 showed suppressive roles in cell proliferation (15). Anti-metastatic activity in a murine lung cancer cell line was also reported (36), suggesting that monosialyl gangliosides might have an opposite activity with disialyl gangliosides with a tandem sequence, such as GD3.
This kind of approach, as reported in this study, should be effective to analyze glycolipid functions in the context of the cell membrane because complex factors are actually involved in the regulation of signaling molecules with glycolipids embedded into the lipid bilayer containing cholesterol, phospholipids, sphingomyelin, and various proteins. However, reconstitution of artificial lipid rafts containing glycolipids, glycoproteins, and Src family kinases in their native forms needs much more effort and time for technical development.
Supplementary Material
Acknowledgments
We thank Y. Nakayasu and T. Mizuno for technical assistance, Dr. J. Nakano at Tokuyama Hospital and Dr. K. O. Lloyd at Memorial Sloan-Kettering Cancer Center for providing N1 cells, and K. O. Lloyd for reading the manuscript carefully.
This work was supported by a grant-in-aid for scientific research on priority areas from the Ministry of Education, Culture, Sports, Science, and Technology of Japan (MEXT).

The on-line version of this article (available at http://www.jbc.org) contains supplemental Figs. S1–S9.
- FAK
- focal adhesion kinase
- GEM
- glycolipid-enriched microdomain.
REFERENCES
- 1. Wiegandt H. (1985) in Glycolipids (Wiegandt H. ed) pp. 199–260, Elsevier, New York [Google Scholar]
- 2. Ledeen R. W., Yu R. K. (1982) Methods Enzymol. 83, 139–191 [DOI] [PubMed] [Google Scholar]
- 3. Hakomori S. (1981) Annu. Rev. Biochem. 50, 733–764 [DOI] [PubMed] [Google Scholar]
- 4. Furukawa K., Tajima O., Okuda T., Tokuda N., Furukawa K. (2007) in Comprehensive Glycoscience: From Chemistry to Systems Biology (Kamerling J. P., Boons G. J., Lee Y. C., Suzuki A., Taniguchi N., Voragen A. G. J. eds) pp. 149–157, Elsevier, Oxford [Google Scholar]
- 5. Nakano J., Raj B. K., Asagami C., Lloyd K. O. (1996) J. Invest. Dermatol. 107, 543–548 [DOI] [PubMed] [Google Scholar]
- 6. Hamamura K., Furukawa K., Hayashi T., Hattori T., Nakano J., Nakashima H., Okuda T., Mizutani H., Hattori H., Ueda M., Urano T., Lloyd K. O., Furukawa K. (2005) Proc. Natl. Acad. Sci. U.S.A. 102, 11041–11046 [DOI] [PMC free article] [PubMed] [Google Scholar]
- 7. Hamamura K., Tsuji M., Ohkawa Y., Nakashima H., Miyazaki S., Urano T., Yamamoto N., Ueda M., Furukawa K., Furukawa K. (2008) Biochim. Biophys. Acta 1780, 513–519 [DOI] [PubMed] [Google Scholar]
- 8. Zeng G., Gao L., Yu R. K. (2000) Int. J. Cancer 88, 53–57 [DOI] [PubMed] [Google Scholar]
- 9. Birklé S., Gao L., Zeng G., Yu R. K. (2000) J. Neurochem. 74, 547–554 [DOI] [PubMed] [Google Scholar]
- 10. Daniotti J. L., Zurita A. R., Trindade V. M., Maccioni H. J. (2002) Neurochem. Res. 27, 1421–1429 [DOI] [PubMed] [Google Scholar]
- 11. Bhunia A. K., Schwarzmann G., Chatterjee S. (2002) J. Biol. Chem. 277, 16396–16402 [DOI] [PubMed] [Google Scholar]
- 12. Moon S. K., Kim H. M., Lee Y. C., Kim C. H. (2004) J. Biol. Chem. 279, 33063–33070 [DOI] [PubMed] [Google Scholar]
- 13. Ohkawa Y., Miyazaki S., Miyata M., Hamamura K., Furukawa K., Furukawa K. (2008) Biochem. Biophys. Res. Commun. 373, 14–19 [DOI] [PubMed] [Google Scholar]
- 14. Haraguchi M., Yamashiro S., Yamamoto A., Furukawa K., Takamiya K., Lloyd K. O., Shiku H., Furukawa K. (1994) Proc. Natl. Acad. Sci. U.S.A. 91, 10455–10459 [DOI] [PMC free article] [PubMed] [Google Scholar]
- 15. Mitsuda T., Furukawa K., Fukumoto S., Miyazaki H., Urano T., Furukawa K. (2002) J. Biol. Chem. 277, 11239–11246 [DOI] [PubMed] [Google Scholar]
- 16. Nishio M., Nishio M., Fukumoto S., Furukawa K., Ichimura A., Miyazaki H., Kusunoki S., Urano T., Furukawa K. (2004) J. Biol. Chem. 279, 33368–33378 [DOI] [PubMed] [Google Scholar]
- 17. Ko K., Furukawa K., Takahashi T., Urano T., Sanai Y., Nagino M., Nimura Y., Furukawa K. (2006) Oncogene 25, 6924–6935 [DOI] [PubMed] [Google Scholar]
- 18. Yamashiro S., Okada M., Haraguchi M., Furukawa K., Lloyd K. O., Shiku H., Furukawa K. (1995) Glycoconj. J. 12, 894–900 [DOI] [PubMed] [Google Scholar]
- 19. Okada M., Furukawa K., Yamashiro S., Yamada Y., Haraguchi M., Horibe K., Kato K., Tsuji Y., Furukawa K. (1996) Cancer Res. 56, 2844–2848 [PubMed] [Google Scholar]
- 20. Yoshida S., Fukumoto S., Kawaguchi H., Sato S., Ueda R., Furukawa K. (2001) Cancer Res. 61, 4244–4252 [PubMed] [Google Scholar]
- 21. Summy J. M., Gallick G. E. (2003) Cancer Metastasis. Rev. 22, 337–358 [DOI] [PubMed] [Google Scholar]
- 22. Barraclough J., Hodgkinson C., Hogg A., Dive C., Welman A. (2007) Neoplasia 9, 745–754 [DOI] [PMC free article] [PubMed] [Google Scholar]
- 23. Sugawara K., Sugawara I., Sukegawa J., Akatsuka T., Yamamoto T., Morita M., Mori S., Toyoshima K. (1991) Br. J. Cancer 63, 508–513 [DOI] [PMC free article] [PubMed] [Google Scholar]
- 24. Loganzo F., Jr., Dosik J. S., Zhao Y., Vidal M. J., Nanus D. M., Sudol M., Albino A. P. (1993) Oncogene 8, 2637–2644 [PubMed] [Google Scholar]
- 25. Han N. M., Curley S. A., Gallick G. E. (1996) Clin. Cancer Res. 2, 1397–1404 [PubMed] [Google Scholar]
- 26. Park J., Cartwright C. A. (1995) Mol. Cell. Biol. 15, 2374–2382 [DOI] [PMC free article] [PubMed] [Google Scholar]
- 27. Marchetti D., Parikh N., Sudol M., Gallick G. E. (1998) Oncogene 16, 3253–3260 [DOI] [PubMed] [Google Scholar]
- 28. Lingwood D., Simons K. (2010) Science 327, 46–50 [DOI] [PubMed] [Google Scholar]
- 29. Hakomori S. I. (2000) Glycoconj. J. 17, 143–151 [DOI] [PubMed] [Google Scholar]
- 30. Frame M. C. (2002) Biochim. Biophys. Acta 1602, 114–130 [DOI] [PubMed] [Google Scholar]
- 31. McCabe J. B., Berthiaume L. G. (2001) Mol. Biol. Cell 12, 3601–3617 [DOI] [PMC free article] [PubMed] [Google Scholar]
- 32. Kasai A., Shima T., Okada M. (2005) Genes Cells 10, 1175–1187 [DOI] [PubMed] [Google Scholar]
- 33. Kasahara K., Watanabe Y., Yamamoto T., Sanai Y. (1997) J. Biol. Chem. 272, 29947–29953 [DOI] [PubMed] [Google Scholar]
- 34. Evans S. V., Roger, MacKenzie C. (1999) J. Mol. Recognit. 12, 155–168 [DOI] [PubMed] [Google Scholar]
- 35. Osenkowski P., Ye W., Wang R., Wolfe M. S., Selkoe D. J. (2008) J. Biol. Chem. 283, 22529–22540 [DOI] [PMC free article] [PubMed] [Google Scholar]
- 36. Zhang Q., Furukawa K., Chen H. H., Sakakibara T., Urano T., Furukawa K. (2006) J. Biol. Chem. 281, 18145–18155 [DOI] [PubMed] [Google Scholar]
Associated Data
This section collects any data citations, data availability statements, or supplementary materials included in this article.


