Abstract
Ca2+ signaling plays an important role in B cell survival and activation and is dependent on Ca2+ trapped in the endoplasmic reticulum (ER) and on extracellular Ca2+. Epstein-Barr virus (EBV) can immortalize B cells and contributes to lymphomagenesis. Previously, we showed that the ER Ca2+ content of Burkitt lymphoma cell lines was increased following infection with immortalization-competent virus expressing the full set of EBV latency genes (B95–8). In contrast, infection with an immortalization-deficient virus (P3HR-1) not expressing LMP-1 is without effect. LMP-1 protein expression was sufficient to increase the ER Ca2+ content and to increase the cytosolic Ca2+ concentration ([Ca2+]cyt). In this follow-up study, we showed that the resting [Ca2+]cyt of P3HR-1-infected cells was decreased, implying that EBV not only modified the ER homeostasis but also affected the cytosolic Ca2+ homeostasis. Furthermore, even if the store-operated calcium entry (SOCE) of these cells was normal, the [Ca2+]cyt increase after thapsigargin + CaCl2 stimulation was blunted. In contrast, the resting [Ca2+]cyt of B95–8 infected cells was not changed, even if their SOCE was increased significantly. When expressed alone, LMP-1 induced an increase of the SOCE amplitude and the expression of the protein allowing this influx, Orai1, showing the effect of EBV on SOCE of B cells are mediated by LMP-1. However, other hitherto unidentified EBV processes, unmasked in P3HR-1 infected cells, counteract this LMP-1-dependent increase of SOCE amplitude to impair a general and potentially toxic increase of [Ca2+]i. Thus, EBV infection modifies the cellular Ca2+ homeostasis by acting on the ER and plasma membrane transporters.
Keywords: Calcium, Calcium Channels, Endoplasmic Reticulum (ER), Immunology, Lymphocyte, Virus
Introduction
Engagement of the B cell receptor induces a massive Ca2+ ion influx from the extracellular space (1). This influx is mainly due to a store-operated calcium entry (SOCE)3 (also known as capacitative calcium entry or CCE), although other influx pathways do exist in B cells (2, 3). Inositol 1,4,5-trisphosphate is synthesized rapidly after B cell receptor cross-linking and allows Ca2+ ion release from the endoplasmic reticulum (1). STIM1, a transmembrane protein of the ER membrane, senses the intraluminal [Ca2+] decrease and multimerizes and translocates toward the plasma membrane (1). The C terminus of STIM1 is then able to interact directly with Orai1 proteins present in the plasma membrane, inducing their tetramerization in the functional store-operated calcium channel, also known as Ca2+ release-activated channels (4, 5). This calcium influx, together with the Ca2+ release from the ER, induces a massive increase of the cytosolic Ca2+ concentration ([Ca2+]cyt), leading to the activation of key calcium-dependent enzymes involved in cell activation (1, 6).
Epstein-Barr virus (EBV), a human gammaherpesvirus can immortalize primary naïve B lymphocytes, leading to the establishment of permanently growing lymphoblastoid cell lines (LCLs). EBV is involved in the pathogenesis of several malignancies, including Burkitt lymphoma, some NK/T lymphomas, Hodgkin lymphoma, nasopharyngeal carcinomas, or post-transplant lymphoproliferative disease (reviewed in Ref. 7). The viral LMP-1 (latent membrane protein-1) is an oncoprotein that has been implicated in the genesis of many of these EBV-associated tumors. LMP-1 displays functional homology with the activated CD40 receptor (8), leading to activation of NK-κB, ERK, JNK, and p38 MAPKs, and Akt-PI3K pathways and to the downstream phenotypic changes observed during transformation of resting B cells into LCLs. LCLs express about nine EBV proteins, including LMP-1, whose expression is under the control of the EBNA2 virus protein (9).
In a previous study, using the prototype transforming EBV strain (B95–8) and a nontransforming strain deleted for the EBNA2 gene (P3HR-1), we showed that infection of EBV-negative Burkitt's lymphoma cell lines with the virus is able to modify the expression of the proteins responsible for Ca2+ ions uptake in the ER (10). Thus, the immortalizing EBV strain B95–8 increased expression of the “high” Ca2+ affinity SERCA2 and decreases “low” Ca2+ affinity SERCA3. As a consequence, the amount of Ca2+ ions in the lumen of the ER is increased. In contrast, the nonimmortalizing EBV strain P3HR-1 was without effect on the SERCA expression profile (10). Importantly, infection with the P3HR-1 strain of EBV not only resulted in a lack of EBNA2 expression but also to a consequent lack of LMP-1 expression (11).
As a major difference between the two EBV strains is the expression of LMP-1, we used an inducible vector coding for LMP-1 to study the effect of LMP-1 alone in the EBV-negative B lymphoma lines. Such experiments revealed that LMP-1 did not alter SERCA2 expression but did decrease SERCA3 expression and caused an increase of Ca2+ sequestration in the ER lumen (10). Expression of LMP-1 also increased the resting [Ca2+]cyt.
In this follow-up study, we considered the consequences of these events on the activity of SOCE. As activation of SOCE is directly dependent on Ca2+ ion content of the ER and on [Ca2+]cyt, we investigated the calcium influx of various EBV-infected cells or cells expressing only LMP-1 and studied expression of the key SOCE proteins Orai1 and STIM1. We also further elucidated the effects of EBV on Ca2+ ion movement through the plasma membrane. Thus, either EBV strain B95–8 or EBV protein LMP-1 both increased the Ca2+ influx and Orai1 expression, whereas STIM1 expression remained constant. In contrast, the nonimmortalizing EBV strain P3HR-1 is without effect on Ca2+ influx but promotes Ca2+ efflux. The modifications of Ca2+ homeostasis by EBV may be linked to tumorigenesis and altered lymphopoiesis.
EXPERIMENTAL PROCEDURES
Cells
BL-30, BL-41 (12), and BJAB (13) cells are EBV-negative human B lymphoma cells. All of the cell lines were maintained in RPMI 1640 medium (Lonza, Levallois-Perret, France) supplemented with 10% heat-inactivated fetal calf serum and 2 mm l-glutamine at 37 °C in a 5% CO2-humidified atmosphere. B95–8 immortalized B cells from Orai1-deficient and healthy patients were a kind gift of Dr. Picard and Professor Fischer (Study Center of Primary Immunodeficiencies, AP-HP, Hôpital Necker, Paris, France). Written informed consent was obtained from the parents of the patients. The experiments were conducted after approval was given by the institutional review boards at Necker-Enfants Malades Hospital (Paris, France). Cell reagents were from Lonza (Verviers, Belgium).
Induction of LMP-1 Expression by Tetracycline Withdrawal
BJAB-tTA-LMP-1 cells were grown in complete RPMI medium supplemented with 2 mg/ml G418 and 0.5 mg/ml hygromycin B (both purchased from Sigma-Aldrich) and 1 μg/ml tetracycline (Fluka, Steinheim, Germany) as described previously (14). To induce LMP-1 expression, exponentially growing cells cultured in the presence of 1 μg/ml tetracycline were washed as follows; after centrifugation, the cell pellet was resuspended in 10 ml of complete medium containing 10% fetal calf serum without tetracycline, transferred into a new 50-ml tube, containing 35 ml serum-free RPMI 1640 medium and pelleted again. This washing step was repeated three times. Thereafter, cells were resuspended in complete RPMI 1640 culture medium without tetracycline at an initial density of 2 × 10⁵ cells/ml. During the last one or two passages preceding induction of LMP-1 expression and during induction by tetracycline withdrawal, selection antibiotics were omitted. Expression of LMP-1 was tested by Western blot (10).
Measurement of Intracellular Calcium Concentration
The intracellular Ca2+ concentration ([Ca2+]i) was recorded by a fluorimetric ratio technique (15, 16). Cells were pelleted and resuspended at a density of 106 cells/ml in PBS supplemented with 1 mg/ml bovine serum albumin and incubated in the dark with 4 μm Indo-1-AM for 1 h at room temperature under slow agitation. Cells were then washed and resuspended in calcium-free Hepes-buffered saline solution (135 mm NaCl, 5.9 mm KCl, 1.2 mm MgCl2, 11.6 mm Hepes, 11.5 mm glucose adjusted to pH 7.3 with NaOH) prior to measurement. After centrifugation, 5 × 10⁵ to 106 cells were suspended in 3 ml of Hepes-buffered saline solution in a quartz cuvette and inserted into a spectrofluorophotometer (RF-1501 Shimadzu Corp., Kyoto, Japan) connected to a personal computer. A temperature of 37 °C was maintained by circulating water from a bath. Ultraviolet light of 360 nm was used for excitation of Indo-1, and emissions at 405 and 480 nm were recorded. Background and autofluorescence of the cell suspension were subtracted from the recordings. The maximum Indo-1 fluorescence (Rmax) was obtained by adding 1 μm ionomycin to the cell suspension in the presence of 10 mm CaCl2. Minimum fluorescence (Rmin) was determined following depletion of external Ca2+ by 5 mm EGTA. Measurements of resting [Ca2+]i were performed in Hepes-buffered saline solution supplemented with 1 mm CaCl2. [Ca2+]i was calculated according to the equation [Ca2+]i = Kd(R − Rmin)/(Rmax − R), where Kd is the apparent dissociation constant of the Indo-1·calcium complex (230 nm), and R is the ratio of fluorescence value at 405 nm over the one at 480 nm (15). In all the experiments, cells in the quartz cuvette, were pretreated with 1 μm thapsigargin for 10 min to induce the calcium release from the ER and the opening of store-operated channels (16). Next, divalent ions were added (Ca2+, Ba2+, or Mn2+) according to the designed experiment. In the majority of the experiments, 1 mm CaCl2 was added to measure the variation of [Ca2+]i in response to calcium influx (16). To calculate the Ca2+ influx rate (Δ[Ca2+]i), we measure the variation of [Ca2+]i per second during the first 20 s after CaCl2 addition; under these conditions, the activities of the plasma membrane Ca2+ ATPases (PMCA) and of the Na+/Ca2+ exchanger are largely reduced (and the activity of SERCA is already inhibited by thapsigarigin (TG)). Thus, the Δ[Ca2+]i is only due to the Ca2+ ion entry (16).
Ba2+ Uptake and Mn2+-induced Indo-1 Quenching Experiments
To study directly the “Ca2+” influx through store-operated channels, we performed two kinds of experiments with surrogate divalent ions, Mn2+ quenching of Indo-1 and Ba2+ accumulation. Mn2+ ions bind to Indo-1 and quench the 430-nm emission wavelength fluorescence. The decrease of fluorescence is directly dependent on Mn2+ entry through SOC. For measurements, 100 μm MnCl2 was added instead of CaCl2. Ba2+ ions pass through SOC but are not pumped by PMCA. As Ba2+ ions are not pumped to the extracellular medium, they accumulate, and this uptake is dependent directly on the activity of SOC. Ba2+ ions do not exert SOC retroinhibition as Ca2+ ions do (17). In our experiments, after 10 min of TG-pretreatment of the cells, 5 mm BaCl2 was added instead of 1 mm CaCl2. As the Ba2+·Indo-1 complex is less fluorescent than the Ca2+·Indo-1 complex (18), we performed a new calibration for Ba2+ ions; the resting fluorescence ratio (same wavelengths as for Ca2+ ions) before Ba2+ application was used as Rmin. Rmax was obtained at the end of the experiment after addition of 10 mm BaCl2 and 1 μm ionomycin. Kd was assumed to be 2 μm (18). [Ba2+]i was calculated with the same formula used for [Ca2+]i. Resting [Ca2+]i was measured in the same bath to which 1 mm CaCl2 was added, and the values averaged over 10 min. The given values are representative of at least three independent experiments.
Sample Preparation and Western Blot
This was done essentially as described in Ref. 19. Briefly, cells were harvested by centrifugation, resuspended in 1 ml of ice-cold NaCl (150 mm), transferred to round-bottom 2-ml Eppendorf tubes, centrifuged, and washed again by centrifugation with 1 ml of ice-cold NaCl solution. The cell pellet was then resuspended in ice-cold 5% trichloroacetic acid and kept at 4 °C overnight. The formed protein precipitate was centrifuged at 12,000 × g for 10 min at 4 °C, and the supernatant was aspirated. The protein pellet was dissolved in lysis buffer (20) at 30 mg TCA-precipitated protein pellet/ml lysis buffer on a horizontal shaking platform and stored thereafter at −80 °C. SDS-PAGE (60 μg total cellular protein per well) in 10% gels and transfer onto nitrocellulose membranes was done as described in Ref. 20. The presence of equal amounts of total protein per lane was verified by Ponceau S staining and densitometry, as described previously (20, 21). LMP-1 was detected by Western blotting using an anti-LMP monoclonal antibody mixture (clone CS.1–4, code no. M0897; DakoCytomation, Glostrup, Denmark), STIM1 by an anti-STIM antibody (Sigma-Aldrich), Orai1 by an anti-Orai1 (ProSci., Inc., Interchim, Montluçon, France). Luminograms were obtained using the ECL reagent kit of Amersham Biosciences and were quantified with the ScionImage software (Scion Corp.). Acquisition and quantitative analysis of protein expression by Western blotting has been described earlier in detail (19–21).
RESULTS
EBV Modifies Resting [Ca2+]cyt of Infected Cell Lines
In a previous study (10), we showed that the transforming EBV strain B95–8 increased the content of Ca2+ in the ER lumen, whereas the nontransforming EBV strain P3HR-1 was without effect. As the resting [Ca2+]cyt is an equilibrium between an influx of Ca2+ ions to the cytoplasm from the extracellular medium and from the internal stores (and especially the ER) and an efflux from the cytoplasm to the extracellular medium or to the internal stores, we assessed the effect of the EBV B95–8 EBV strain-induced increase of ER Ca2+ concentration on the resting [Ca2+]cyt in chronically infected BL-30 and BL-41 cells.
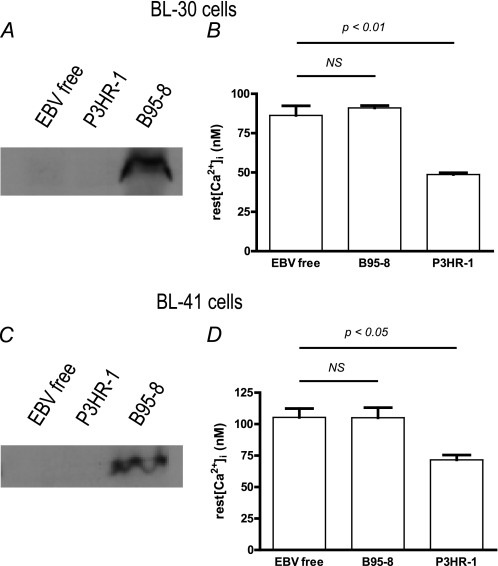
As expected, LMP-1 expression is only detected in the B95–8-infected BL-30 and BL-41 cell lines (Fig. 1, A and C). However, surprisingly the stable infection of either cell line by the EBV B95–8 strain had no effect on their resting [Ca2+]cyt (86 ± 6 nm versus 91 ± 2 nm and 105 ± 7 nm versus 105 ± 8 nm for EBV-negative and B95.8-infected BL30 and BL-41 cells respectively, Fig. 1, B and D). In contrast, the resting [Ca2+]cyt of the cell lines infected by the EBV P3HR-1 strain was decreased significantly in both lines; in BL-30, there was a 43% reduction to 49 ± 1 nm (p < 0.01), and in BL-41, there was a 31% reduction to 72 ± 4 nm (p < 0.05, Fig. 1, B and D).
FIGURE 1.
Resting intracellular Ca2+ concentration is decreased in cell lines stably infected with P3HR-1 strain EBV and not in cell lines stably infected with B95–8 strain EBV. Experiments were done on BL-30 (top panels) and BL-41 cells (bottom panels). A and C, LMP-1 expression was tested by Western blotting (see “Experimental Procedures” for details). B and D, resting (rest) [Ca2+]cyt was measured in 1 mm CaCl2 containing Hepes-buffered saline solution medium during 10 min, and the values were averaged. Each bar represents data from at least five experiments. NS, not significant.
Therefore, in cells infected by EBV, the resting [Ca2+]cyt does not appear to relate to the ER calcium content, as the increase of the ER Ca2+ content in B95–8 infected cells has no consequence on the resting [Ca2+]cyt. Furthermore, the results with P3HR-1 infected cells imply that a process is taking place to remove Ca2+ ions from the cytosolic compartment (inducing a resting [Ca2+]cyt decrease), which is not a result of an increased activity of SERCAs.
EBV Induces Profound Changes in [Ca2+]cyt Variation after TG Treatment
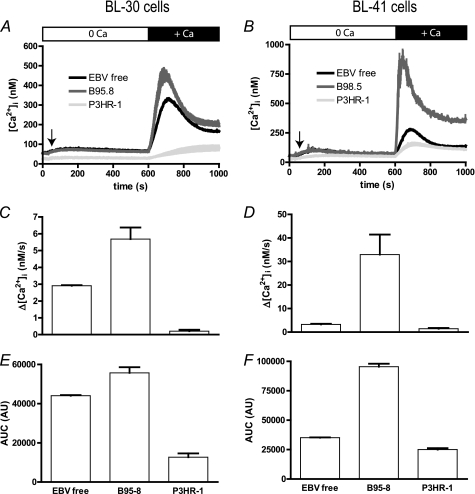
Treatment of BL-30 and BL-41 lines with TG, a noncompetitive inhibitor of SERCAs, induced a Ca2+ release by the ER in both cell lines (10). In the absence of extracellular Ca2+ ions, the [Ca2+]cyt variation (Δ[Ca2+]cyt) is only due to the Ca2+ release (Fig. 2, A and B; 30–600 s), which, in turn, allows the opening of the store-operated calcium channels present in the plasma membrane. When 1 mm CaCl2 is added to the extracellular solution, entry of Ca2+ ions leads to an increase of [Ca2+]cyt. As shown in Fig. 2, A and B, for both BL-30 and BL-41 cells, addition of CaCl2 induced a biphasic increase of [Ca2+]cyt in EBV-free cells (black traces) composed of an increase to 250–300 nm which peaked in 90 s, followed by a decay to a plateau of 200–250 nm.
FIGURE 2.
Infection by EBV B95–8 strain increases [Ca2+]cyt variation of two B cell lines, whereas infection with EBV P3HR-1 blunts it. Experiments were done on BL-30 (left panels) and BL-41 cells (right panels). A and B, cells were treated for 10 min with 1 μm TG in Ca2+-free medium to induce Ca2+ release from the ER and the opening of store-operated channels. At t = 600 s, 1 mm CaCl2 was added, and [Ca2+]cyt was measured according to Indo-1 fluorescence with a Kd = 230 nm, in EBV-free cells (EBV free), in B95–8 infected cells (B95–8), and in P3HR-1 infected cells (P3HR-1). C and D, Ca2+ influx rate was calculated in the first 20 s after CaCl2 addition, as the slope of the curve. E and F, the area under the curve (AUC) was calculated as the sum of [Ca2+]cyt values measured after CaCl2 addition and expressed in arbitrary units (AU).
In both cell lines, stable infection by B95–8 and P3HR-1 strains has an opposite effect on Δ[Ca2+]cyt in response to extracellular Ca2+ (Fig. 2, A and B). Thus, in B95–8 infected cells (blue traces), the increase in [Ca2+]cyt is higher and faster than in EBV-free cells (Ca2+ influx rate ×2 for BL-30 and ×10 for BL-41 cells; Fig. 2, C and D). After reaching a peak of ∼450 and 900 nm, respectively, in BL-30 and BL-41 cells, the [Ca2+]cyt decreased (Fig. 2, A and B) but remained higher than in EBV-free cells, especially in BL-41 cells. The area under the curve, which reflects the amount of Ca2+ uptake, was increased significantly by 26 and 172%, respectively, in BL-30 and BL-41 cells (p < 0.01, Fig. 2, E and F).
In both cell lines, Δ[Ca2+]cyt was blunted in cells infected with the EBV P3HR-1 strain (red traces, Fig. 2, A and B). Thus, [Ca2+]cyt reached a maximum of 81 ± 13 nm and 113 ± 5 nm, respectively, in BL-30 and BL-41 cells. (Ca2+ influx rate significantly decreased by 10× and twice, respectively.) The area under the curve, which reflects the amount of Ca2+ uptake, was decreased significantly by 71% in P3HR1-infected BL-30 cells relative to EBV-free BL30 cells (Fig. 2E) and by 29% P3HR1-infected BL-41 cells relative to EBV-free BL41 cells (Fig. 2F); in both cases, these differences were significant (p < 0.01).
Immortalizing EBV Strain Increases Divalent Ion Influx
As [Ca2+]cyt is a constant equilibrium between Ca2+ influx and efflux, we replaced Ca2+ by Mn2+ or Ba2+ ions. These ions function as Ca2+ surrogates for SOC channels but are poorly, if at all, pumped outside by the cell (18); they therefore allow the direct study of the store-operated ion entry.
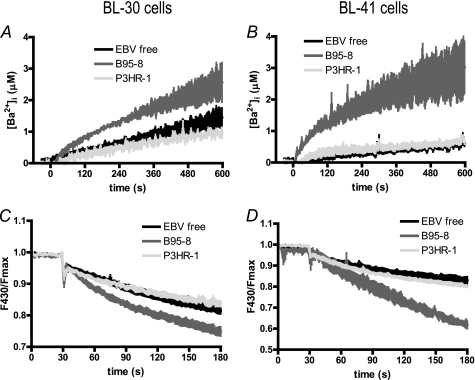
After a 10-min pretreatment with 1 μm TG, the addition of 5 mm BaCl2 resulted in a slow uptake of Ba2+ ions (Fig. 3, A and B) with an initial rate of 2.4 ± 0.4 nm/s in EBV-free BL-30 and 1.6 ± 0.2 nm/s in EBV-free BL-41 cells. After 10 min, [Ba2+]cyt reached a concentration of 1.45 ± 0.17 and 0.61 ± 0.09 μm, respectively, in BL-30 and BL-41 cells.
FIGURE 3.
Ba2+ uptake and Mn2+ quenching of Indo-1 are increased in magnitude and speed in EBV B95–8-infected cells but unchanged in P3HR-1-infected cells. Experiments were done on BL-30 (left panels) and BL-41 cells (right panels). In both experiments, cells were pretreated for 10 min with 1 μm TG in Ca2+-, Ba2+-, and Mn2+-free medium to induce Ca2+ release from the ER and the opening of the store-operated channels. Experiments were done on at least five different batches of noninfected cells (EBV-free), B95–8 infected cells (B95–8), and P3HR-1 infected cells (P3HR-1). A and B, at t = 0 s, 5 mm BaCl2 was added (in the place of 1 mm CaCl2), and [Ba2+]cyt was measured. [Ba2+]cyt was calculated as [Ca2+]cyt, according to Indo-1 fluorescence. C and D, at t = 30 s, 100 μm MnCl2 was added instead of 1 mm CaCl2, inducing the quenching of Indo-1 fluorescence.
In cells chronically infected by the B95–8 EBV strain, the initial rate of Ba2+ uptake was 3.7- and 9.4-fold higher in BL-30 (8.9 ± 0.5 nm/s) and BL-41 cells (15.5 ± 2.1 nm/s), respectively, leading to higher [Ba2+]cyt levels after 10 min: 2.63 ± 0.48 μm in BL-30 cells (p < 0.05, +82%, Fig. 3A) and 3.03 ± 0.82 in BL-41 cells (p < 0.05, +399%, Fig. 3B). In cells chronically infected by the P3HR-1 EBV strain, the initial Ba2+ uptake rate was unchanged relative to EBV-free cells of BL-30 (2.2 ± 0.6 nm/s) and BL-41 cells (2.4 ± 1.0 nm/s) and the [Ba2+]cyt reached similar levels to EBV-free cells after 10 min.
Mn2+ ions quench Indo-1 fluorescence; thus, an increase in the rate of Indo-1 quenching reflects an increase of Mn2+ influx. As shown in Fig. 3, C and D, the B95–8 EBV strain displayed an increased quenching rate relative to EBV-free cells in BL-30 (+33%) and BL-41 (+180%). In contrast, infection by the P3HR-1 strain had no effect on the quenching rate (Fig. 3, C and D).
Similarly to the Δ[Ca2+]cyt in Fig. 2, A and B, infection by the immortalizing B95–8 strain had more effect on Ba2+ and Mn2+ uptake in BL-41 than in BL-30 cells. In contrast, the nonimmortalizing P3HR-1 EBV strain did not modify significantly the divalent ion influx in either cell line. Thus, influx of divalent ions (Ca2+, Ba2+, and Mn2+) through the SOC channels is highly increased in cells infected with the EBV B95–8 immortalizing strain but is unaffected by infection with the P3HR-1 EBV strain.
LMP-1 Expression Increases BJAB Cell [Ca2+]i Variation after TG Treatment
In a previous study, we showed that one protein of EBV, LMP-1, is able to modify the ER Ca2+ homeostasis (10) and could mimic the effects of the B95–8 EBV strain. In contrast, the P3HR-1 EBV strain, not expressing LMP-1 (11), has no effect on ER Ca2+ homeostasis (10). In light of the differences we observed between the two EBV strains on divalent ion influx and with the knowledge that a major difference between these two strains is the expression of LMP-1, we then investigated the direct effect of LMP-1 on divalent ion influx.
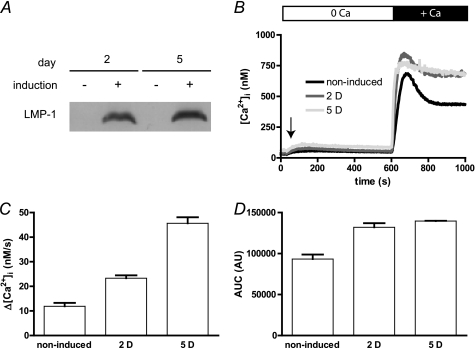
The BJAB-tTA-LMP-1 cells carry an LMP-1 transgene under the control of a tetracycline-repressible promoter. When the cells are grown in the presence of tetracycline, LMP-1 expression is repressed, whereas tetracycline withdrawal results in LMP-1 expression at levels similar to that observed in EBV-infected cells (10, 14). Fig. 4A shows a Western blot for LMP1 protein expression at 0, 2, and 5 days following removal of tetracycline from cultures of the BJAB-tTA-LMP1 cells.
FIGURE 4.
EBV LMP-1 increases [Ca2+]cyt variations in BJAB cells. Expression of LMP-1 was tested by Western blot as described in the legend to Fig. 1. Calcium measurements were performed as described in the legend to Fig. 2. BJAB-tTa-LMP1 cells were grown in presence of tetracycline to repress LMP1 expression (induction −) or in the absence of tetracycline to allow LMP1 expression for up to 5 days (induction +). A, expression of LMP-1 after 2 (2 D) and 5 (5 D) days of induction. B, [Ca2+]i of noninduced cells or after 2 and 5 days of LMP-1 expression induction were measured as described in the legend to Fig. 2. Day 1 experiment was omitted as the Δ[Ca2+]cyt was not different to the control Δ[Ca2+]cyt. Day 3 and 4 experiments were omitted as the Δ[Ca2+]cyt levels were not different to the day 5 Δ[Ca2+]cyt. C, the Ca2+ influx rate was estimated as the slope of the Δ[Ca2+]cyt during the first 20 s. D, the area under the curve was calculated as the sum of [Ca2+]cyt during 400 s after CaCl2 addition. AUC, area under curve; AU, arbitrary units.
In presence of tetracycline, when LMP-1 is not expressed (Fig. 4A), the addition of external Ca2+ ions to BJAB-tTA-LMP-1 cells caused a biphasic increase of [Ca2+]cyt; comprising of a rapid increase from ∼60 to 600–700 nm during the first minute (influx rate of 12 ± 1 nm/s; Fig. 4, B and C), followed by a decay of ∼40% to an elevated plateau of ∼450–500 nm in 3 min. Similar results were obtained on wild type BJAB cells and on BJAB cells transfected with an empty tTA vector (data not shown), indicating that the tetracycline repressor itself has no effect on Ca2+ homeostasis.
Induction of LMP-1 expression by removal of tetracycline from the culture medium for 2 days (Fig. 4A) led to an increase of Δ[Ca2+]cyt After 24 h of induction, no significant difference in Δ[Ca2+]cyt was noticeable, although LMP-1 expression was clearly induced at this time (data not shown). After 48 h of induction of LMP-1, the addition of external Ca2+ caused a clear difference in Δ[Ca2+]cyt relative to uninduced cells; there was a faster and higher increase from ∼90 to 750–800 nm within 30 s, followed by only a slight decay to a plateau at ∼750 nm (Fig. 4B). The Δ[Ca2+]cyt at 3 and 4 days post-induction of LMP-1 (data not shown) were similar to results obtained after 5 days (Fig. 4, B and C). Calculation of the Ca2+ influx rate in the first seconds after adding CaCl2 was faster after 2 days (23 ± 1 nm/s; +98%) and 5 days (46 ± 2 nm/s; +284%) relative to uninduced cells (Fig. 4C). After 5 days, there was no significant decay of [Ca2+]cyt (Fig. 4B). When expressed as area under the curve, the total amount of intracellular Ca2+ uptake was increased by 42 and 50%, respectively, after 2 and 5 days of induction (Fig. 4D).
Thus, the expression of LMP-1 alone allows a significant increase of the Ca2+ influx in B cells and could explain the increase of Ca2+ influx in B95–8-infected BL-30 and BL-41 cells. However, we next performed experiments with surrogate ions to validate the influx increase.
LMP-1 Increases Divalent Ion Influx in BJAB Cells
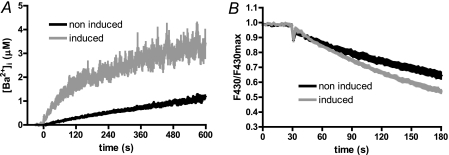
Ba2+ entry was monophasic in BJAB-tTA-LMP-1 cells not expressing LMP-1, with an initial rate of 2.2 ± 0.7 nm/s and reaching a concentration of 1.13 ± 0.09 μm after 10 min (Fig. 5A). In contrast, after 5 days of LMP-1 expression induction, Ba2+ ion initial uptake rate was 10× larger (22.1 ± 3.3 nm/s) and reached a cytosolic concentration of 3.13 ± 0.34 μm after 10 min (Fig. 5A). The reduction in the apparent rate of uptake of Ba2+ after 2 min was most likely due to an increasing saturation of the Indo-1 fluorescence. Similarly, Fig. 5B shows that Mn2+ ion quenching of Indo-1 fluorescence was 50% faster in BJAB-tTA-LMP-1 cells after 5 days of LMP-1 expression (−0.17 ± 0.01 versus −0.12 ± 0.01 arbitrary units).
FIGURE 5.
Ba2+ uptake and Mn2+ quenching of Indo-1 are larger and faster in LMP-1-expressing cells. [Ba2+]cyt measurement and Indo-1 quenching by Mn2+ were done as described in the legend to Fig. 3. Briefly, control BJAB cells, not expressing LMP-1 (non-induced) and LMP-1 expressing BJAB cells were pretreated for 10 min with 1 μm TG to allow the opening of the store-operated channels. Then according to the experiment, either 5 mm BaCl2 (A) or 100 μm MnCl2 (B) was added.
Thus, when LMP-1 is expressed in BJAB cells, the divalent ion influx is faster. These results confirm the difference we observed between Burkitt lymphoma cells infected by the B95–8 or the P3HR1 EBV strains.
LMP-1 Expression Blunts Inhibition of SOCE by Gd3+ and SKF96365
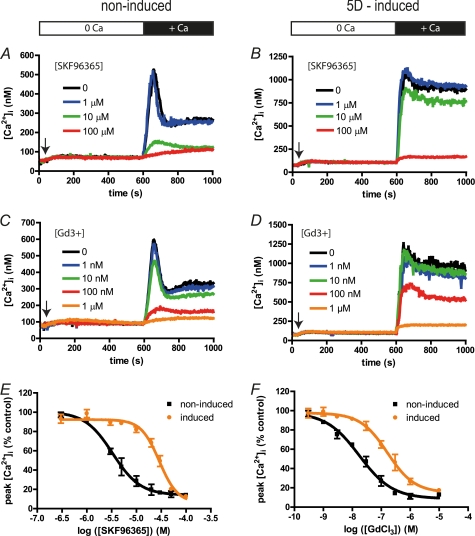
Classical inhibitors of SOCE are lanthanides (such as Gd3+ and La3+ ions) in submicromolar concentrations and SKF96365 (22, 23). We next examined the effect of LMP1 on the inhibition of SOCE by Gd3+ or SKF96365. The results in Fig. 6 show the effects on BJAB-tTA-LMP-1 cells, induced or not to express LMP-1, that were pretreated for 10 min with 1 μm TG in a Ca2+-free medium (open bar) and various concentrations of inhibitors that were added 30 s prior to the addition of 1 mm CaCl2 (black bar).
FIGURE 6.
LMP-1 expressing BJAB cells are 10 times less sensitive to Gd3+ and SKF96365 inhibition. Experiments were done on non-LMP-1 expressing (left panels, non-induced) and 5 days-induced LMP-1 expressing (right panels, induced) cells as described in the legend to Fig. 4. An arrow indicates when 1 μm TG was added to induce Ca2+ release by the ER and the opening of the SOC. Then different concentrations of SKF96365 or GdCl3 were added 30 s prior CaCl2 addition. The white bar indicates recordings made without Ca2+ ions in cell bath, and the black bar indicates the presence of 1 mm CaCl2. A and B, typical [Ca2+]cyt time course obtained from LMP-1 nonexpressing (A) and LMP-1-expressing (B) BJAB cells treated with different concentrations of SKF96365. C and D, typical [Ca2+]cyt time course obtained from LMP-1 nonexpressing (C) and LMP-1 expressing (D) BJAB cells treated with different concentrations of GdCl3. E and F, dose-response curves of the Δ[Ca2+]cyt after CaCl2 addition inhibited by SKF96365 (E) or by GdCl3 (F). The lines were created by fitting the dose-response curves with the Hill equation to calculate Ki for both inhibitors in both conditions. 5D-induced, day 5 induced.
As shown in Fig. 6A, increasing SKF96365 concentrations inhibit the Δ[Ca2+]cyt in a dose-dependent manner following addition of extracellular CaCl2 in LMP-1 nonexpressing BJAB cells; 10 μm SKF96365 almost totally inhibits the Ca2+ influx. The dose-response curve (Fig. 6E) allows the calculation of an inhibition constant Ki of 3 μm. Similarly, in cells induced to express LMP-1 for 5 days, the Ca2+ influx is also inhibited by increasing SKF96365 concentrations (Fig. 6B) but with a weaker Ki of 33 μm (Fig. 6E). In the same way, expression of LMP-1 decreases the ability of Gd3+ ions to block the Ca2+ influx by 10× (Ki 160 nm versus 17 nm, Fig. 6, B, D, and F). Thus, LMP-1 expression confers a decreased sensitivity to two commonly used inhibitors of SOCE.
LMP-1 Expression Induces an Increase of Orai1 Expression
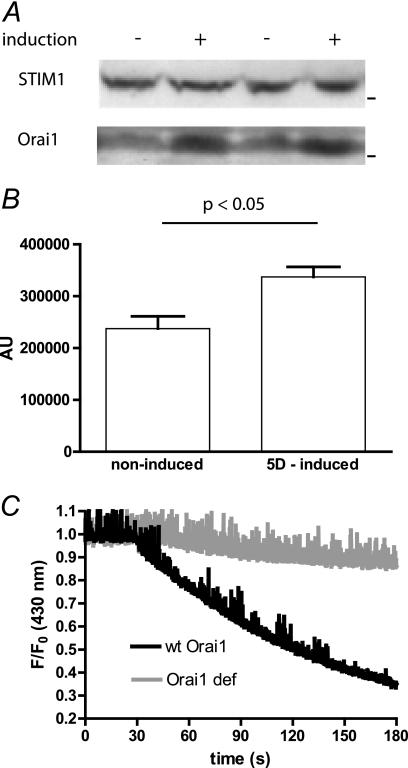
Recently, it was shown that the expression levels of the two main proteins implicated in the formation of the Ca2+ influx in lymphocytes, Orai1 and STIM1, may account for pharmacology and selectivity differences of the influx (24). We therefore analyzed the effect of LMP-1 expression on Orai1 and STIM1 expression. As shown for duplicate samples in Fig. 7A, the use of an anti-STIM1 antibody allowed the detection of a single band with the expected molecular mass of ∼80 kDa by Western blot, and the induction of LMP-1 had no effect on the level of STIM1 expression.
FIGURE 7.
LMP-1 increases the expression of the channel pore protein Orai1. A, expression of the two main components of the SOCE was tested by Western blot on duplicate samples of noninduced (−) and 5 days induced (+) BJAB cells. B, histogram summarizing the quantitation of Orai1 expression densitometry measurements on five replicate Western blots. C, Mn2+ quenching of Indo-1 experiments were performed as in Fig. 5B, on a wild type Orai1-expressing LCL from a healthy patient (wt Orai1) and on an Orai1-deficient LCL from a SCID patient (Orai1 def).
The anti-Orai1 antibody detected several bands, with a main band corresponding to a molecular mass of ∼50 kDa. As the unglycosylated form of Orai 1 has a predicted size of 33 kDa, the 50-kDa band likely corresponds to glycosylated Orai1. In presence of LMP-1, the expression of this Orai1 protein was increased significantly by 66 ± 13% (p < 0.05, duplicate shown in Fig. 7A) without any effects on other, nonspecific bands (Fig. 7, A and B). Thus, the presence of LMP-1 induces an increase of the expression of the pore channel Orai1, whereas the expression of the protein inducing the opening of the channels is unchanged.
Orai1 is the main channel responsible for the SOCE in B cells (25). It has been shown in T cells that Orai2 and Orai3 could be expressed but play no role in the SOCE (26). However, to confirm that the B95–8 EBV strain and especially LMP-1 do not increase the activity of Orai2 and/or Orai3 channels, we performed experiments on B95–8 immortalized LCLs from a patient bearing the heterozygous double missense A103E and L194P mutations (27). These cells did not express any Orai1 protein, and the SOCE was undetectable. We found that the Mn2+ quenching of Indo-1 was almost abolished in Orai1-deficient cells in contrast to LCLs from healthy volunteers (Fig. 7C). Thus, when cells were immortalized by the B95–8 strain and expressed LMP-1, the presence of Orai1 proteins was absolutely required to observe an increase of SOCE.
DISCUSSION
The major finding of this study is that the EBV and especially its transforming protein LMP-1 are able to drastically modify the Ca2+ influx of stimulated B cell lines. As a complement to our previous work, where we showed that LMP-1 modifies the Ca2+ content of the ER, we now provide mechanistic data on how EBV acts on global cell Ca2+ homeostasis.
Calcium signaling plays a critical role in lymphocyte survival and activation. In the last five years, it has been discovered that two proteins play the main roles in T and B cell Ca2+ entry: Orai1 as the pore of the channel and STIM1 as the opener (1). When these proteins are not functional or are absent due to mutations, the Ca2+ entry (known as a store-operated calcium entry) is impaired, and T and B cells cannot be activated (1). Some viruses, like HIV-1, have targeted the SOCE to disturb the immune response (16).
It is likely that the EBV life cycle is regulated by cellular calcium signaling; ionomycin and A23187, two calcium ionophores that allow the entry of external Ca2+ ions, are inducers of EBV reactivation (28). Notwithstanding the role of Ca2+ in the EBV life cycle, data on whether EBV affects SOCE are incomplete, especially in the light of the recent discoveries regarding Orai1 and STIM1.
In a previous work, we showed that the immortalizing strain of EBV, B95–8, increases the Ca2+ ER amount in contrast to the nonimmortalizing EBV strain P3HR-1 (10). Using a B cell line with inducible expression of LMP-1, we could attribute this difference between the EBV strains to the expression of LMP-1. As the activation of the SOCE is directly linked to the Ca2+ ER content, we sought in the present study to examine the Ca2+ entry in EBV chronically infected cells. We now show that EBV also is able to directly modify the fluxes of Ca2+ ions through the plasma membrane. Conditional LMP-1 expression in BJAB-tTA-LMP-1 cells increased the expression of the Orai1 proteins, which form the pore of the store-operated channels of the plasma membrane, allowing a more pronounced entry of Ca2+ ions. In contrast, expression of the STIM1 protein, which induces the opening of Orai1 channels, is not modified, implying that the effects of LMP-1 on the Ca2+ entry specifically target Orai1. Thus, when LMP-1 is expressed in an EBV-negative B cell line, it drastically modifies the Ca2+ homeostasis of the cell through increasing Ca2+ release from the ER (10) and increasing Ca2+ influx from the extracellular milieu (present study). As a consequence, the resting [Ca2+]cyt of LMP-1-expressing cells rises. As the ratio of Orai1 and STIM1 expression is known to modify the kinetics and pharmacology properties of the HEK293 cell SOCE (24), the decrease of sensitivity to Gd3+ and SKF96365 inhibition could be attributed to the observed increased Orai1/STIM1 expression ratio.
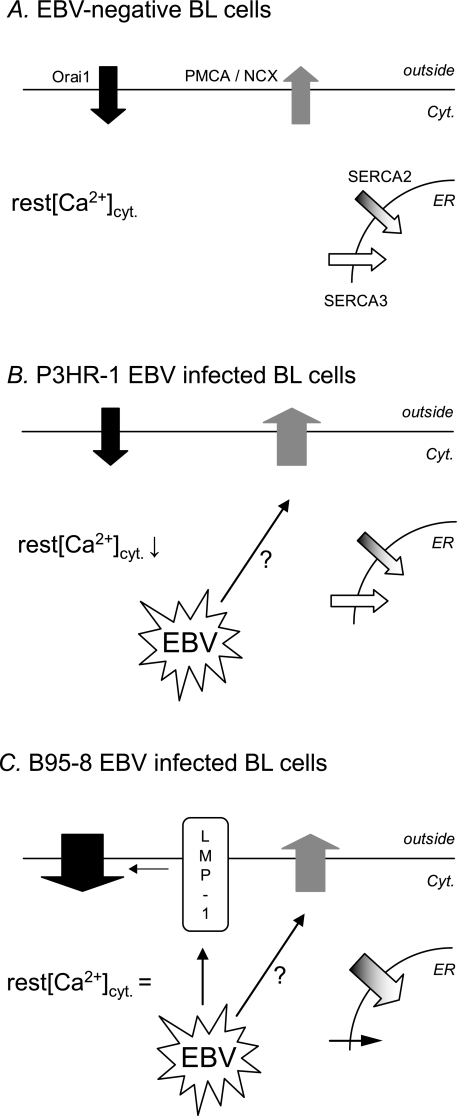
However, the use of cell lines infected with EBV strains draws a more complex picture and shows that LMP-1 is not the only EBV protein to act on Ca2+ transporters (Fig. 8). Cells infected with the P3HR-1 EBV strain, which do not express LMP-1, have normal Ca2+ influx (Fig. 8B). However, their resting [Ca2+]cyt is decreased significantly, indicating that a process to remove Ca2+ ions from the cytosol is active. This cannot be due to SERCA activity as the expressions of the SERCA2 and SERCA3 are not modified by the P3HR-1 infection (10). Furthermore, when cells are treated with TG, an inhibitor of SERCAs, the increase of [Ca2+]cyt following addition of extracellular Ca2+ is blunted, confirming that the Ca2+ ion removal from the cytosol is not linked to the SERCA and is probably due to plasma membrane transporters (possibly plasma membrane Ca2+ ATPases and/or Na+/Ca2+ exchanger). Further experiments are needed to confirm that P3HR-1 induces a Ca2+ efflux increase and to identify the transporters involved.
FIGURE 8.
Proposed mechanism of EBV-induced disturbance of [Ca2+]cyt and Ca2+ influx. A, in EBV-negative BL cells, [Ca2+]cyt is an equilibrium between Ca2+ entry by Orai1 channels and Ca2+ exit by PMCA, Na+/Ca2+ exchanger (NCX), and SERCA2 and -3. B, in P3HR-1 EBV-infected cells, a yet unknown process induces an increase of PMCA-Na+/Ca2+ exchanger activity. As there is no increase of Ca2+ influx, [Ca2+]cyt decreases. C, in B95–8 EBV-infected cells, LMP-1 is expressed, inducing an increase of Orai1 expression, and an increase of the Ca2+ influx (as shown in LMP-1 expressing BJAB cells). As we showed previously, there is also an EBV-induced increase of SERCA2 expression and a decrease of SERCA3 expression (10). As the PMCA-Na+/Ca2+ exchanger activity is also increased, [Ca2+]cyt levels cannot rise and appear unchanged by the infection.
When cells are infected by the B95–8 EBV strain, which induces the expression of LMP-1, the Ca2+ influx is increased, but the resting [Ca2+]cyt is unchanged (Fig. 8C). Thus, we can hypothesize that the LMP-1-induced Ca2+ entry increase is counteracted to abrogate a rise in the resting [Ca2+]cyt. Although not formally demonstrated, we hypothesize that the efflux increase observed in P3HR-1 infected cells is also present in B95–8 infected cells and could avoid the increase of resting [Ca2+]cyt. Thus, an EBV protein other than LMP-1 is able to increase the activity of the efflux transporters and should be explored. One possible candidate for this effect is LMP-2A, another EBV signaling protein expressed during type III latency, which is known to decrease Ca2+ mobilization of LCLs stimulated by the B cell receptor or CD19 receptor (29).
LMP-1 is known to activate several signaling pathways (reviewed in Ref. 30). The balance of signaling events induced by LMP-1 appears to be dependent upon its level of expression, and this is reflected in downstream biological functions because at high concentrations, LMP-1 inhibits cell proliferation, whereas at lower concentrations, LMP-1 seems to favor cell proliferation. The level of LMP1 influences autophagy (31), which is a well known Ca2+-dependent process: according to the cell type, autophagy is dependent on Ca2+ release from the ER or dependent on the Ca2+ influx (32–34). Thus, one consequence of EBV increasing the Ca2+ influx through Orai1 channels could be to favor the autophagy to regulate its proliferative/cytostatic balance and to modulate immune recognition. As the SOCE is tightly regulated by the cells through many regulatory proteins, it is possible that EBV-encoded proteins in addition to LMP-1 could also be implicated.
Orai proteins have a clear link with cell proliferation in various tissues, and Orai1 is known to play a key role in breast tumor cell migration and metastasis (35). Thus, the difference of Orai protein expression and SOCE pharmacology could constitute a new interesting target for the modulation of virus-induced activation, immortalization of B cells, and associated disorders.
This work was supported in part by INSERM and the Association pour la Recherche contre le Cancer.
- SOCE
- store-operated calcium entry
- ER
- endoplasmic reticulum
- [Ca2+]cyt
- cytosolic calcium concentration
- Δ[Ca2+]cyt
- [Ca2+]cyt Variation
- EBV
- Epstein-Barr virus
- LCL
- EBV-transformed lymphoblastoid cell line
- PMCA
- plasma membrane Ca2+ ATPase(s)
- SERCA
- sarcoplasm endoplasmic reticulum Ca2+ ATPase
- TG
- thapsigargin
- SOC
- store-operated channel(s).
REFERENCES
- 1. Feske S. (2007) Nat. Rev. Immunol. 7, 690–702 [DOI] [PubMed] [Google Scholar]
- 2. Dellis O., Dedos S. G., Tovey S. C., Taufiq-Ur-Rahman, Dubel S. J., Taylor C. W. (2006) Science 313, 229–233 [DOI] [PubMed] [Google Scholar]
- 3. Morita T., Tanimura A., Baba Y., Kurosaki T., Tojyo Y. (2009) J. Cell Sci. 122, 1220–1228 [DOI] [PubMed] [Google Scholar]
- 4. Penna A., Demuro A., Yeromin A. V., Zhang S. L., Safrina O., Parker I., Cahalan M. D. (2008) Nature 456, 116–120 [DOI] [PMC free article] [PubMed] [Google Scholar]
- 5. Ji W., Xu P., Li Z., Lu J., Liu L., Zhan Y., Chen Y., Hille B., Xu T., Chen L. (2008) Proc. Natl. Acad. Sci. U.S.A. 105, 13668–13673 [DOI] [PMC free article] [PubMed] [Google Scholar]
- 6. Oh-hora M., Rao A. (2008) Curr. Opin. Immunol. 20, 250–258 [DOI] [PMC free article] [PubMed] [Google Scholar]
- 7. Kawa K. (2000) Int. J. Hematol. 71, 108–117 [PubMed] [Google Scholar]
- 8. Eliopoulos A. G., Young L. S. (2001) Semin. Cancer Biol. 11, 435–444 [DOI] [PubMed] [Google Scholar]
- 9. Sinclair A. J., Farrell P. J. (1992) Cell Growth Differ. 3, 557–563 [PubMed] [Google Scholar]
- 10. Dellis O., Arbabian A., Brouland J. P., Kovàcs T., Rowe M., Chomienne C., Joab I., Papp B. (2009) Mol. Cancer 8, 59. [DOI] [PMC free article] [PubMed] [Google Scholar]
- 11. Wang F., Tsang S. F., Kurilla M. G., Cohen J. I., Kieff E. (1990) J. Virol. 64, 3407–3416 [DOI] [PMC free article] [PubMed] [Google Scholar]
- 12. Calender A., Billaud M., Aubry J. P., Banchereau J., Vuillaume M., Lenoir G. M. (1987) Proc. Natl. Acad. Sci. U.S.A. 84, 8060–8064 [DOI] [PMC free article] [PubMed] [Google Scholar]
- 13. Menezes J., Leibold W., Klein G., Clements G. (1975) Biomedicine 22, 276–284 [PubMed] [Google Scholar]
- 14. Floettmann J. E., Ward K., Rickinson A. B., Rowe M. (1996) Virology 223, 29–40 [DOI] [PubMed] [Google Scholar]
- 15. Grynkiewicz G., Poenie M., Tsien R. Y. (1985) J. Biol. Chem. 260, 3440–3450 [PubMed] [Google Scholar]
- 16. Dellis O., Gangloff S. C., Paulais M., Tondelier D., Rona J. P., Brouillard F., Bouteau F., Guenounou M., Teulon J. (2002) J. Biol. Chem. 277, 6044–6050 [DOI] [PubMed] [Google Scholar]
- 17. Prakriya M., Lewis R. S. (2001) J. Physiol. 536, 3–19 [DOI] [PMC free article] [PubMed] [Google Scholar]
- 18. Owen C. S. (1993) Anal. Biochem. 215, 90–95 [DOI] [PubMed] [Google Scholar]
- 19. Robert C., Delva L., Balitrand N., Nahajevszky S., Masszi T., Chomienne C., Papp B. (2006) Cancer Res. 66, 6336–6344 [DOI] [PubMed] [Google Scholar]
- 20. Brouland J. P., Gélébart P., Kovàcs T., Enouf J., Grossmann J., Papp B. (2005) Am. J. Pathol. 167, 233–242 [DOI] [PMC free article] [PubMed] [Google Scholar]
- 21. Gélébart P., Kovács T., Brouland J. P., van Gorp R., Grossmann J., Rivard N., Panis Y., Martin V., Bredoux R., Enouf J., Papp B. (2002) J. Biol. Chem. 277, 26310–26320 [DOI] [PubMed] [Google Scholar]
- 22. Chung S. C., McDonald T. V., Gardner P. (1994) Br. J. Pharmacol. 113, 861–868 [DOI] [PMC free article] [PubMed] [Google Scholar]
- 23. Putney J. W., Jr. (2001) Mol. Interv. 1, 84–94 [PubMed] [Google Scholar]
- 24. Scrimgeour N., Litjens T., Ma L., Barritt G. J., Rychkov G. Y. (2009) J. Physiol. 587, 2903–2918 [DOI] [PMC free article] [PubMed] [Google Scholar]
- 25. Feske S., Giltnane J., Dolmetsch R., Staudt L. M., Rao A. (2001) Nat. Immunol. 2, 316–324 [DOI] [PubMed] [Google Scholar]
- 26. Feske S., Gwack Y., Prakriya M., Srikanth S., Puppel S. H., Tanasa B., Hogan P. G., Lewis R. S., Daly M., Rao A. (2006) Nature 441, 179–185 [DOI] [PubMed] [Google Scholar]
- 27. McCarl C. A., Picard C., Khalil S., Kawasaki T., Röther J., Papolos A., Kutok J., Hivroz C., Ledeist F., Plogmann K., Ehl S., Notheis G., Albert M. H., Belohradsky B. H., Kirschner J., Rao A., Fischer A., Feske S. (2009) J. Allergy Clin. Immunol. 124, 1311–1318 [DOI] [PMC free article] [PubMed] [Google Scholar]
- 28. Faggioni A., Zompetta C., Grimaldi S., Barile G., Frati L., Lazdins J. (1986) Science 232, 1554–1556 [DOI] [PubMed] [Google Scholar]
- 29. Miller C. L., Longnecker R., Kieff E. (1993) J. Virol. 67, 3087–3094 [DOI] [PMC free article] [PubMed] [Google Scholar]
- 30. Li H. P., Chang Y. S. (2003) J. Biomed. Sci. 10, 490–504 [DOI] [PubMed] [Google Scholar]
- 31. Lee D. Y., Sugden B. (2008) Oncogene 27, 2833–2842 [DOI] [PubMed] [Google Scholar]
- 32. Cloonan S. M., Williams D. C. (2011) Int. J. Cancer 128, 1712–1723 [DOI] [PubMed] [Google Scholar]
- 33. Høyer-Hansen M., Bastholm L., Szyniarowski P., Campanella M., Szabadkai G., Farkas T., Bianchi K., Fehrenbacher N., Elling F., Rizzuto R., Mathiasen I. S., Jäättelä M. (2007) Mol. Cell 25, 193–205 [DOI] [PubMed] [Google Scholar]
- 34. Harr M. W., Distelhorst C. W. (2010) Cold Spring Harb. Perspect. Biol. 2, a005579. [DOI] [PMC free article] [PubMed] [Google Scholar]
- 35. Yang S., Zhang J. J., Huang X. Y. (2009) Cancer Cell 15, 124–134 [DOI] [PubMed] [Google Scholar]


