Abstract
Accumulation of vitamin A-derived lipofuscin fluorophores in the retinal pigment epithelium (RPE) is a pathologic feature of recessive Stargardt macular dystrophy, a blinding disease caused by dysfunction or loss of the ABCA4 transporter in rods and cones. Age-related macular degeneration, a prevalent blinding disease of the elderly, is strongly associated with mutations in the genes for complement regulatory proteins (CRP), causing chronic inflammation of the RPE. Here we explore the possible relationship between lipofuscin accumulation and complement activation in vivo. Using the abca4−/− mouse model for recessive Stargardt, we investigated the role of lipofuscin fluorophores (A2E-lipofuscin) on oxidative stress and complement activation. We observed higher expression of oxidative-stress genes and elevated products of lipid peroxidation in eyes from abca4−/− versus wild-type mice. We also observed higher levels of complement-activation products in abca4−/− RPE cells. Unexpectedly, expression of multiple CRPs, which protect cells from attack by the complement system, were lower in abca4−/− versus wild-type RPE. To test whether acute exposure of healthy RPE cells to A2E-lipofuscin affects oxidative stress and expression of CRPs, we fed cultured fetal-derived human RPE cells with rod outer segments from wild-type or abca4−/− retinas. In contrast to RPE cells in abca4−/− mice, human RPE cells exposed to abca4−/− rod outer segments adaptively increased expression of both oxidative-stress and CRP genes. These results suggest that A2E accumulation causes oxidative stress, complement activation, and down-regulation of protective CRP in the Stargardt mouse model. Thus, Stargardt disease and age-related macular degeneration may both be caused by chronic inflammation of the RPE.
Keywords: ABC Transporter, Complement, Inflammation, Oxidative Stress, Retinoid, Stargardt Disease, Age-related Macular Degeneration, Lipofuscin, Recessive Stargardt Macular Degeneration, Retinal Metabolism
Introduction
Age-related macular degeneration (AMD)5 is the leading cause of severe vision loss in the elderly. The pathogenesis of AMD is complex, with inflammation, oxidative stress, and phototoxicity all playing etiologic roles (1, 2). Susceptibility factors include advancing age, cigarette smoking, and family history. Several years ago the gene for complement factor H (CFH), was shown to be a strong susceptibility locus for AMD (3–6). More recently, the genes for other CRPs were shown to be associated with AMD including complement factor H-related 1 and 3 (CFHR1 and CFHR3) (7, 8), complement factor B (CFB), complement factor 2 (C2) (9), and complement factor 3 (C3) (10–12). In AMD, complement system dysregulation due to CRP dysfunction results in chronic inflammation of the retinal pigment epithelium (RPE) (13). This cell monolayer is critical for sustained viability of the adjacent photoreceptors. A pathological hallmark of AMD is the formation of extracellular deposits called drusen within Bruch's membrane, beneath the RPE (14).
Another etiologic feature of AMD is oxidative damage (15). Malondialdehyde (MDA) and 4-hydroxynonenal (HNE), generated from oxidation of polyunsaturated fatty acids, are two abundant products of lipid peroxidation. HNE-derived protein modifications in retinal tissue occur as the result of light damage and age (16). In addition, peroxidized lipids have been shown to accumulate with age in Bruch's membrane (17). Moreover, protein modifications by the lipid-peroxidation product, carboxyethylpyrrole, were detected in drusen isolated from AMD eyes (18).
Recessive Stargardt macular degeneration is a central blinding disease similar to AMD, with an age of onset during the first or second decade of life. In contrast to AMD, Stargardt exhibits simple Mendelian transmission and is caused by mutations in the ABCA4 gene (19–21). Pathologically, Stargardt is characterized by deposition of autofluorescent lipofuscin pigments in RPE cells (22). Lipofuscin deposits precede macular degeneration and visual loss in Stargardt patients (23). The ABCA4 gene encodes an ATP binding cassette transporter located in the rims of rod and cone outer segment (OS) discs (24). ABCA4 functions as a flippase for N-retinylidene-phosphatidylethanolamine, the Schiff-base condensation product of all-trans-retinaldehyde and phosphatidylethanolamine across disc membranes (25). Similar to Stargardt patients, mice with a knock-out mutation in the abca4 gene deposit fluorescent lipofuscin granules in the RPE (26). The major fluorophore of lipofuscin is the bis-retinoid pyridinium salt A2E, which exhibits several modes of cytotoxicity in RPE cells (27). Blue-light irradiation of A2E-containing RPE cells induces formation of A2E-oxiranes (epoxides) and other oxidation products (28–30). We previously showed in the abca4−/− mouse that exposure to high intensity cyclic light results in formation of A2E oxidation products (31). Moreover, increased light exposure leads to age-dependent retinal degeneration in albino abca4−/− mice (32). Accumulation of lipofuscin fluorophores in the RPE is critical to the etiology of Stargardt macular dystrophy (33). However, lipofuscin accumulation is less commonly seen in AMD. A2E and related lipofuscin pigments have been shown to activate complement in cultured RPE cells after light exposure (34, 35).
In the current study we explored the possibility that dysregulation of the complement system may play a role in the etiology of Stargardt disease. Using the albino abca4−/− mouse as a model, we show that accumulation of lipofuscin fluorophores is associated with increased oxidative stress and complement activation in vivo. These observations suggest that chronic inflammation of the RPE due to local activation of complement represents a common etiologic feature of AMD and Stargardt disease.
MATERIALS AND METHODS
Mice
Wild-type (BALB/c) and abca4−/− albino mice were raised under a 12-h cyclic light (20–40 lux in cages) and fed a standard rodent diet (NIH-31, 7013 Harlan Teklad, Madison, WI). All mice were homozygous for the wild-type (Leu-450) allele of the rpe65 gene. Mouse studies were done in adherence to guidelines established by the UCLA Animal Research Committee and The Association for Research in Vision and Ophthalmology statement for the Use of Animals in Ophthalmic and Vision Research.
Preparation of Eyecups
Mice were dark-adapted overnight, and all tissue manipulations were performed under dim red light (Eastman Kodak Co. Wratten 1A filter). After euthanasia, eyes were removed and hemisected. The anterior portion containing the cornea, lens, and vitreous was discarded. Eyecups containing retina, RPE, choroid, and sclera were frozen in liquid N2 and stored at −80 °C for further processing. For some analyses, retinas were removed, and the homogenates were prepared from eyecups containing RPE/choroid/sclera only.
Analysis of Lipofuscin Fluorophores by Normal-phase Liquid Chromatography
Single eyecups or 400-μl samples of crude rod outer segments (ROS) (see preparation below) were homogenized in 1.0 ml of PBS. Four ml of chloroform/methanol (2:1, v/v) were added, and the samples were extracted with the addition of 4.0 ml of chloroform and 3.0 ml of distilled H2O followed by centrifugation at 1000 × g for 10 min. The extraction was repeated with the addition of 4.0 ml of chloroform. The organic phases were pooled, dried under a stream of argon, and dissolved in 100 μl of 2-propanol. Analysis of A2E and A2E precursors was done by normal phase on a silica column (Agilent-Zorbax-Sil 5 μm, 250 × 4.6 mm) in an Agilent model 1100 high performance liquid chromatograph equipped with a photodiode array detector (Agilent Technologies, Wilmington, DE). The mobile phase was hexane, 2-propanol, ethanol, 25 mm potassium phosphate, glacial acetic acid (485:376:100:45:0.275 v/v) and was filtered before use. The flow rate was 1.0 ml/min. Column and solvent temperatures were maintained at 40 °C. Absorption units corresponding to the A2E peak at 435 nm were converted to pmol using a calibration curve with an authentic A2E standard and the published molar extinction coefficient for A2E (36).
Immunoblot Analysis
Age-matched BALB/c (WT) and albino abca4−/− (KO) mouse eyecups containing RPE (without retina, vitreous, lens, and cornea) were flash-frozen before homogenization in CompleteTM EDTA-free protease inhibitor mixture (Roche Applied Science). Protein concentrations in the homogenates were determined by a BCA protein assay reaction (Micro BCATM Protein Assay kit, Pierce from Thermo Fisher Scientific). Protein extracts from mice of different ages were tested for C3/C3b, CRRY, CFH, SOD1, CAT1, monocyte chemoattractant protein-1 (MCP-1), and C-reactive protein. Briefly, 20–30 μg of protein was separated using a 7% Tris acetate (C3), 4% Tris-glycine (CFH), 10% Bis-Tris (CAT1), and 12% Bis-Tris (SOD1, MCP-1, CRRY, C-reactive protein) gels in MOPS running buffer, then transferred onto a polyvinylidene difluoride membrane (Millipore). Membranes were blocked overnight at 4 °C with Odyssey blocking buffer (LiCor) followed by incubation at room temperature for 1 h with goat anti-mouse C3 (Cappel, 1:500), rabbit polyclonal C-reactive protein (Abnova, 1:200), SOD1 (Assay Design, 1:200), CAT1 (Abcam, 1:200), MCP-1 (Cell Signaling, 1:100), GAPDH (Sigma, 1:10,000), sheep polyclonal CFH (Novus Biological, 1:200), mouse anti-rat CRRY (BD Biosciences, 1:500), and mouse monoclonal anti-α-tubulin (Sigma, 1:10,000) in 0.5% normal donkey serum. Bands were detected with fluorescent-labeled donkey anti-goat 680 (LI-COR Biosciences, 1:50,000), goat anti-rabbit 680 (LI-COR Biosciences, 1:10,000), goat anti-rat 680 (LI-COR Biosciences, 1:10,000), goat anti-mouse 680 (LI-COR Biosciences, 1:10,000), and donkey anti-sheep (Rockland, 1:10,000) using the Odyssey Infrared Imaging System (LI-COR Biosciences). Band intensities were then quantified and normalized to mouse anti-α-tubulin antibody for SOD1, CAT1, CFH, and C3/C3b or GAPDH antibody for CRRY, MCP-1, and C-reactive protein (CRP). Quantification was done in three independent experiments using four to six eyes for each time point for each group of mice, and the average data were presented with S.D. Statistical analyses were done using the Student's t test.
Thiobarbituric Acid Reactive Substance Assay for MDA Quantification
Mouse eyecups were homogenized in 1.0 ml of PBS buffer. A 100-μl aliquot of the homogenate was removed for protein BCA assay (Micro BCATM protein assay kit, Pierce from Thermo Fisher Scientific). The tissue homogenates (800 μl) were mixed with 26 μl of 4.4 mm butylated hydroxytoluene and 13.6 μl of 10 m NaOH. The reaction mix was incubated under continuous shaking at 60 °C for 30 min. The samples were allowed to cool down at room temperature (RT) and reacted with 227 μl of a mixture of 38% trichloroacetic acid (TCA) and 2% KI followed by mixing and incubation on ice for 10 min. After centrifugation at 7000 × g at 4 °C for 10 min, 500 μl of the supernatant was removed and transferred to a new tube containing an equal volume of 0.66% 2-thiobarbituric acid. After incubation at 95 °C for 30 min, each sample was cooled to RT. The amount of MDA was determined on a Shimadzu UV160U spectrophotometer (Shimadzu Scientific Instruments) at 534 nm (ϵMDA = 157,000 m−1cm−1) using water as reference. The data represent the means with S.D. and were reported as nmol/μg of total protein.
ELISA for HNE Quantification
Tissue preparation and protein quantification were done as described above. The homogenate samples were diluted to 10 μg/ml in PBS. 100-μl aliquots of each sample (10 μg/ml) or the reduced HNE-BSA standards (OxiSelectTM HNE-His Adduct ELISA kit, Cell Biolabs Inc.) were added to a 96-well protein binding plate and incubated at 37 °C for 4 h. All wells were washed twice with 250 μl of PBS dried by gently tapping on a paper towel. Each well received 200 μl of the Assay Diluent, and the plate was incubated for 2 h at RT on an orbital shaker. Wells were washed 3 times with 250 μl of Wash Buffer followed by thorough aspiration. The samples were incubated with 100 μl of diluted anti-HNE-His antibody at RT for 1 h on an orbital shaker. Wells were washed 3 times with 250 μl of Wash Buffer followed by thorough aspiration. Diluted secondary antibody/HRP conjugate was added to each well followed by incubation and washing steps. After an additional two washes with the Wash Buffer, 100 μl of the Substrate Solution was added to each emptied well and incubated on an orbital shaker for 5–20 min at RT. The enzyme reaction was quenched by the addition of 100 μl of Stop Solution. Absorbance of each well was detected in a SPECTRA max 340PC microplate reader (Molecular Devices Corp.) using 450 nm as the primary wavelength and the reduced HNE-BSA standard as reference. The average data were presented as μg per ml with S.D. For both thiobarbituric acid reactive substance and ELISA assays, three independent experiments with three eyes were analyzed for each time (n = 9).
Electron Microscopy
Mice were euthanized under anesthesia and fixed by intracardiac perfusion with 2% formaldehyde and 2.5% glutaraldehyde in 0.1 m sodium phosphate buffer, pH 7.2. The nasal and temporal hemispheres of each eyecup were fixed additionally in 1% osmium tetroxide dissolved with 0.1 m sodium phosphate then dehydrated in a graded series of alcohols. The temporal hemispheres were embedded in an Epon/Araldite mixture (5 parts/3 parts) for light microscopy (data not shown). The nasal hemispheres were cut into quadrants and embedded in Araldite 502 (Ted Pella, Redding, CA) for electron microscopy. Ultrathin sections for electron microscopy were cut on a Leica Ultracut ultramicrotome. The sections were collected on 200-mesh copper grids and stained with uranium and lead salts before viewing on a Zeiss 910 electron microscope. Electron microscopic images were acquired from the inferior-nasal quadrant sections. Three images of RPE cells from each experimental group were photographed at the same magnification using a Keenview TM digital camera. From each image, three measurements of Bruch's membrane and RPE basal infoldings were taken. Each measurement was considered as n = 1 so a total of n = 9 were collected. AnalySIS software was used to measure Bruch's membrane thickness and basal infoldings. The results were presented as the means with S.D. Statistical analysis was performed using Student's t test.
Electron Microscopic Immunocytochemistry
Mice were euthanized under anesthesia and fixed by intracardiac perfusion with 4% formaldehyde and 0.2% glutaraldehyde in 0.1 m sodium phosphate buffer, pH 7.2. The eyes were dissected into quadrants. The quadrants were dehydrated in a graded series of alcohols, infiltrated, and embedded in LR White Resin medium grade (Electron Microscopy Sciences). Ultrathin sections (100 nm) were cut on a Leica Ultracut microtome and collected on 200-mesh Formvar carbon-coated nickel grids. The sections were processed for EM immunocytochemistry using anti C3/C3b (Cell Science) as the primary antibody (1:50) and 12-nm colloidal gold affinity-purified goat anti-rat IgG (Jackson ImmunoResearch) as a secondary antibody (1:20). The sections are stained with uranium salts and viewed at 6300× magnification on a Zeiss 910 transmission electron microscope. AnalySIS software was used to count the number of gold particles per area. The mean of the gold particles was calculated from 10 images of each group. Statistical analysis was performed using Student's test.
Immunofluorescence Analysis
Mice were euthanized under anesthesia, the eyes were removed, anterior segments were dissected away, and the eyecups were fixed overnight at 4 °C in 0.1% PBS and 4% paraformaldehyde. Eyecups were infiltrated with 10% sucrose in PBS for 1 h and 20% sucrose in PBS for 2 h, then embedded in optimal cutting temperature compound (Sakura). 10-μm cryostat sections were cut and mounted on Superfrost Plus slides. The sections were warmed to room temperature and fixed briefly with 4% formaldehyde for 5 min and then washed with PBS 3 times. The sections were blocked with goat serum or donkey serum (0.5%, Sigma) and 1% BSA in PBS for 1 h followed by incubation with primary antibodies, rat anti-C3a (1:50), rat anti-iC3b (1:50, Cell Science), or goat anti-C-reactive protein (1:50, Santa Cruz Biotechnology). The sections were rinsed three times and then incubated in goat anti-rat or donkey anti-goat IgG secondary antibodies conjugated with rhodamine red (1:200, Invitrogen) for 1 h followed by rinsing. The sections were mounted with 5% n-propylgallate in 100% glycerol mounting medium. The images of the mouse retina sections were captured with a Zeiss LSM510 confocal microscope under a 63× oil objective using an excitation wavelength of 488 and 543 nm with emission wavelengths of 505–530 and 560–615 nm, respectively. The immunostaining of CRRY was performed with the Vector M.O.M immunodetection kit (Vector Laboratories, Inc.). A mouse monoclonal anti-CRRY (1:50, BD Bioscience) and the prolong Gold antifade reagent with DAPI (Molecular Probes) were used, and the images were captured with an Olympus FluoView FV1000 confocal laser-scanning microscope under 60× oil objective with an excitation wavelength of 488 nm and emission wavelength of 560–615 nm. The average fluorescein pixel intensity of each section was counted. 17 sections from the Balb/C and 16 sections of the abca4−/− mice retina were compared. The results were presented as the means with S.D. Statistical analysis was performed using Student's t test.
Mouse ROS Preparation
BALB/c and abca4−/− retinas of 3–6-month-old mice were collected in 45% sucrose in Hanks' balanced salt solution (Invitrogen). Crude ROS were obtained by gentle vortexing followed by sedimentation at 10,000 × g for 10 min at 4 °C. The pellet was discarded, and the supernatant was diluted 1:4 (vol:vol) with Hanks' balanced salt solution. Crude ROS were pelleted down after spinning for 10,000 × g for 10 min at 4 °C. The ROS pellet was washed two times with Hanks' balanced salt solution and re-suspended in DMEM (Sigma) for fetal human RPE incubation.
Fetal Human RPE Cultured Cells
Human RPE cells on Y402 variant for CFH gene were collected from the eyes of aborted fetuses of 18 weeks gestation. The dissociated RPE cells were resuspended in Eagle's minimum essential medium without calcium (Joklik, Sigma) with the addition of 54 μm CaCl2, amino acid supplements, and other additives as described previously (37). The RPE culture reached confluence and released RPE daughter cells in the medium in ∼10 days. Non-attached cells were collected and seeded at a density of 2 × 10⁵ cells onto Millicell-HA culture wells (Millipore) coated with mouse laminin (Collaborative Research). The RPE cells were then grown and maintained in Chee's essential replacement medium (40) containing 1% calf serum and 1.8 mm CaCl2 (minimum essential medium, Irvine Scientific) for two months before use. 400 μl of freshly prepared mouse ROS (from four mouse retinas) in DMEM were added to the apical compartment. The basal compartment received 400 μl of DMEM, and the cells were incubated at 37 °C for 2 h. The filters containing the RPE cells were washed twice in 1× PBS and harvested for RNA extraction and cDNA synthesis for quantitative real-time PCR analysis.
Quantitative Real-time PCR
Total RNA was extracted from the eyecups containing RPE of BALB/c (WT) and albino abca4−/− (KO) mice or fetal human RPE cells using Absolutely RNA Miniprep kit (Stratagene) with DNase treatment and was reverse-transcribed to cDNA using SuperScript III (Invitrogen) according to the manufacturer's instructions. Quantitative real-time PCR (qRT-PCR) was done on a DNA Engine Opticon2 (MJ Research-Bio-Rad) using a two-step kit with SYBR Green (Invitrogen) and mouse gene-specific primer sets for complement regulator protein and oxidative stress genes DAF1 (NM_010016.2, AATGCGAGGGGAAAGTGAC (forward) and TGAGGGGGTTCCTGTACTTG (reverse)), DAF2 (NM_007827.2, GTCATCACCACCACTGCTGCTG (forward) and ATTAGGAATGTCTGGAGGTGGGC (reverse)), CRRY (NM_013499.2, CCAGCAGTGTGCATTGTCAGTCC (forward) and CCCCTTCTGGAATCCACTCATCTC (reverse)), CD59a (NM_001111060.1, GAGCATGAGCACAGTCACTGGCG (forward) and GAACACAGCCAGAAGCAGCAGGAG (reverse)), CD59b (NM_181858.1, GAGCCAAACAACGCAGAAACTTCC (forward) and GGGCATCCAGGATGACTTAGAAGC (reverse)), CFH (NM_009888.3, ACCACATGTGCCAAATGCTA (forward) and TGTTGAGTCTCGGCACTTTG (reverse)) (38), MCP-1 (NM_011333.3, AGGTCCCTGTCATGCTTCTG (forward) and TCTGGACCCATTCCTTCTTG (reverse)), glutathione S-transferase τ (NM_008185.3, TGTACCTGGATCTGCTGTCG (forward) and TGTGTGCCAGGTAGAGCAAG (reverse)), glutathione S-transferase mu (NM_010358.5, AGAACCAGGTCATGGACACC (forward) and ACTTGGGCTCAAACATACGG (reverse)), SOD1 (NM_011434.1, GAGACCTGGGCAATGTGACT (forward) and GTTTACTGCGCAATCCCAAT (reverse)), catalase-1 (CAT1, NM_009804.2, ACATGGTCTGGGACTTCTGG (forward) and CAAGTTTTTGATGCCCTGGT (reverse)), and heme oxygenase-1 ((forward) GCATGCCCCAGGATTTGTC and CTGGCCCTTCTGAAAGTTCCTCATG (reverse) (39)) or human gene specific primer sets CD46 (NM_002389.4, CCAAAGTGTCTTAAAGTGCTGCCTC (forward) and CTAGGACCTGAGGCACTGGACG (reverse)), CD55 (NM_000574.3, AGGCATTTTCATCTTTCCTTCGGG (forward) and CCTTATCACCATCAACACCCCTGG (reverse)), CD59 (NM_000611.5, GAGCCCAGGGAGGGAAAGGTTC (forward) and CGAGGTTAAGGCAAAACCCTACGG (reverse)) (38), CFH (NM_000186.3, CAGCAGTACCATGCCTCAGA (forward) and GGATGCATCTGGGAGTAGGA (reverse)), glutathione S-transferase mu (NM_000561.3, ATGCCCATGATACTGGGGTA (forward) and GTGAGCCCCATCAATCAAGT (reverse)), SOD1 (NM_000454.4, AGGGCATCATCAATTTCGA (forward) and ACATTGCCCAAGTCTCCAAC (reverse)), heme oxygenase-1 (NM_002133.2, TCCGATGGGTCCTTACACTC (forward) and TAAGGAAGCCAGCCAAGAGA (reverse)), and CAT1 (NM_001752.3, AGCTTAGCGTTCATCCGTGT (forward) and TCCAATCATCCGTCAAAACA (reverse)). Both mouse and human cDNA templates were normalized to 18 S rRNA using the same primers set (NR_003278.1, (forward) TTTGTTGGTTTTCGGAACTGA and (reverse) CGTTTATGGTCGGAACTACGA). Fluorescence data were analyzed with the Opticon2 software (Bio-Rad) using the following PCR conditions: 94 °C for 20 s, 60 °C for 30 s, and 72 °C for 40 s, 40 cycles total. Three mice of each genotype (4 weeks old) were analyzed, and all samples were run in triplicate. The experiment was repeated three times. For human RPE cells the experiment was done twice with each sample run in quadruplicate. Data were normalized to 18 S rRNA Ct values for each sample. Relative mRNA levels for each gene were determined from the ΔCt values. The results were presented as the means with S.D.
RESULTS
Age-dependent Accumulation of A2E and A2E Precursor (A500 nm) in Albino abca4−/− Eyes
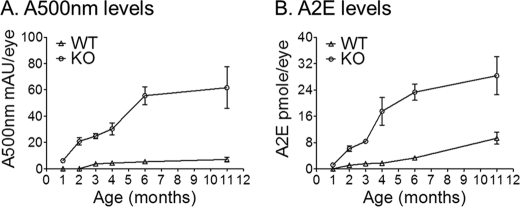
We quantified the lipofuscin-fluorophore (A2E and A500 nm) levels by normal-phase chromatography. Eyecups from 1, 2, 3, 4, 6, and 11-month-old BALB/c (WT) and albino abca4−/− (KO) mice were analyzed. We observed a significant age-dependent A2E and A500 nm (A2E major precursor) increase in albino abca4−/− eyes (Fig. 1). Accumulation began as early as four postnatal weeks in the abca4−/− mice and appeared to slow down after six months as shown in Fig. 1. This is not surprising considering that early signs of photoreceptor degeneration are observed at seven months (data not shown) and about 40% of the cells are lost in 11-month-old albino abca4−/− mice (32).
FIGURE 1.
Increased A500 nm and A2E levels in albino abca4−/− (KO) mice. A, A500 nm is expressed as milliabsorbance units per eye (mAU). B, A2E is expressed as pmol per eye. Each value corresponds to the mean obtained from eyecups of four different mice at the indicated ages; error bars are shown as S.D. (n = 4).
Elevated Oxidative Stress Gene Expression in abca4−/− Mice
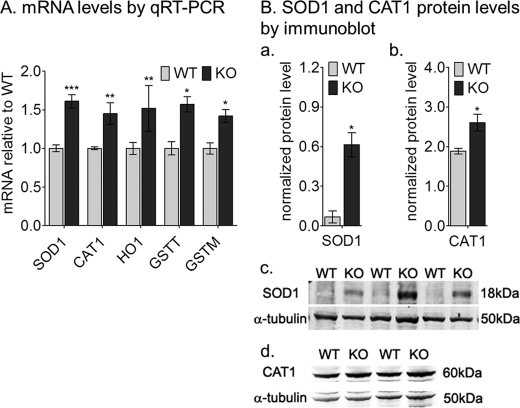
The potentially increased oxidative environment in abca4−/− RPE cells due to continuous formation and accumulation of A2E prompted us to analyze the expression profile of anti-oxidative genes in 4-week-old mice. By qRT-PCR, SOD1, glutathione S-transferase-τ and -μ, heme oxygenase-1, and CAT1 mRNA levels in abca4−/− mice were about 1.5-fold elevated when compared with age-matched wild-type samples (Fig. 2A). By quantitative immunoblotting the SOD1 and CAT1 protein levels were about 9- and 1.5-fold, respectively, higher in abca4−/− homogenates compared with the wild-type (Fig. 2B, a–d).
FIGURE 2.
Elevated oxidative stress levels in albino abca4−/− (KO) RPE cells. A, quantitation of oxidative stress gene mRNAs by qRT-PCR is shown. The histogram shows the relative SOD1, CAT1, heme oxygenase-1 (HO1), and glutathione S-transferase τ and -μ (GSTT and GSTM) mRNA levels by qRT-PCR from 4-week-old mice. Each mRNA level was normalized to 18 S rRNA (n = 9, *, p < 0.005; **, p < 0.05; and ***, p < 0.0005). B, histograms show SOD1 (a) and CAT1 (b) normalized protein levels by quantitative immunoblot using α-tubulin as internal control (n = 4; *, p < 0.007). Representative immunoblots are shown for SOD1 (c), CAT1 (d), and α-tubulin (c and d) with 20 μg of mouse RPE homogenate per lane.
Increased MDA and HNE Levels in abca4−/− RPE Homogenate
MDA and HNE are natural byproducts of lipid peroxidation. These oxidative stress markers were analyzed in eyecup homogenates from 1, 2, and 3-month-old abca4−/− and wild-type mice. Both compounds were significantly higher in three-month-old albino abca4−/− compared with wild-type (BALB/c) and pigmented abca4−/− mice (Fig. 3 and data not shown).
FIGURE 3.
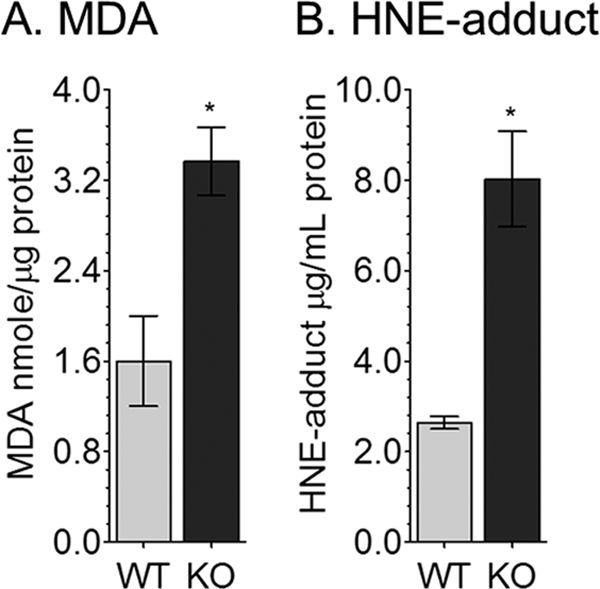
MDA and HNE-adduct levels are increased in albino abca4−/− (KO) RPE homogenates. A, MDA levels by thiobarbituric acid reactive substance assay were normalized to total protein content. Data are presented as nmol/μg of protein. B, HNE levels determined by ELISA are reported as μg/ml of RPE homogenate. Error bars represent S.D. (n = 9; *, p < 0.00005).
Complement Activation in Albino abca4−/− Eyes
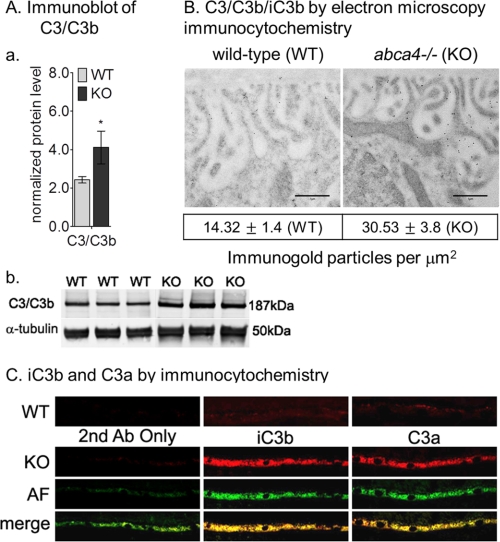
Previously, we showed that albino abca4−/− mice have higher levels of A2E oxidation products such as A2E epoxides (31). Because A2E and A2E precursor are elevated (Fig. 1) and oxidative stress markers are increased (Figs. 2 and 3), we evaluated complement system reactivity in abca4−/− eyes. C3/C3b components were 1.7-fold increased in 3-month-old abca4−/− versus wild-type eyes by quantitative immunoblotting (Fig. 4A, a and b). Electron microscopic immunogold labeling showed 2-fold increased C3b immunogold deposition on the basal infoldings of RPE from abca4−/− compared with wild-type mice (Fig. 4B). To assay for complement activation, we employed immunocytochemistry using specific antibodies against iC3b and C3a fragments. As shown in Fig. 4C, significantly higher C3a and iC3b immunoreactivity was present in abca4−/− versus wild-type RPE at 3 months of age. Interestingly, C3a and iC3b co-localized with lipofuscin autofluorescence within RPE cells, suggesting a lysosomal localization for these ingested complement fragments. Autofluorescence was undetectable in the age-matched wild-type RPE (data not shown).
FIGURE 4.
Complement activation in albino abca4−/− mice. Aa, a histogram shows C3/C3b protein levels in 3-month-old BALB/c (WT) and albino abca4−/− (KO) by immunoblot analysis. The C3b/C3 immunoreactivity band was normalized to α-tubulin band. Error bars indicate S.D. (n = 6; *, p < 0.005). b, representative immunoblots for C3/C3b and α-tubulin of WT and KO RPE homogenates (30 μg/lane) are shown. B, representative electron microscopic images are viewed under 6300× magnification of WT and KO RPE cells. Scale bar = 1 μm. Note the 2-fold increased immunogold particles within KO basal infoldings. The mean of the gold particles/μm2 was calculated from 10 images of each group, p = 0.0046. C, complement break-down fragments (iC3b and C3a) immunocytochemistry in WT and KO are shown. Representative RPE sections KO show strong immunoreactivity for both iC3b and C3a antibodies (Ab) that co-localize with the autofluorescence. Age-matched WT RPE sections (top panels) show slight immunoreactivity for the complement fragments. No autofluorescence (AF) was detected in 3-month-old WT mice.
Complement Regulatory Proteins Are Down-regulated in the abca4−/− Mice
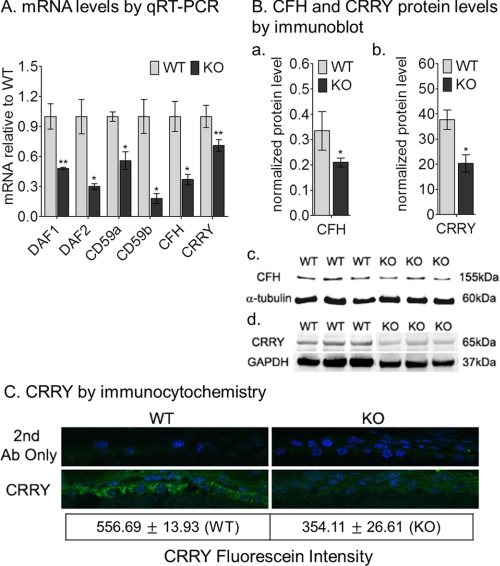
Complement activation is blocked in host tissues through expression of soluble (complement factor H) and membrane-associated CRP (MCP or CD46), decay-accelerating factor (DAF or CD55), and membrane inhibitor of reactive lysis (MIRL or CD59)). Mice have undergone a duplication of the CD55 (daf1, daf2) and CD59 (cd59a, cd59b) genes (38). Rodents, including mice, additionally express a unique transmembrane protein called complement-receptor 1-related gene/protein y (crry) with both CD46 and CD55 activities. Crry is considered a functional homologue of human CD46 (40). We measured CRP mRNA levels in 4-week-old wild-type and abca4−/− RPE by qRT-PCR. Expression of all the CRP was reduced in abca4−/− versus wild-type RPE (Fig. 5). In particular, we observed reductions of 2-fold for daf1 and CD59a, 3-fold for daf2 and CFH, 5-fold for CD59b, and ∼1.5-fold for crry mRNAs in abca4−/− versus wild-type RPE (Fig. 5A). By quantitative immunoblotting, the CFH and CRRY protein levels were decreased by 1.67- and 2-fold, respectively, in abca4−/− RPE homogenates compared with wild-type (Fig. 5B, a–d). The immunoblotting results were consistent with reduced expression of CRRY by immunocytochemistry (Fig. 5C). Altered expression of these protective CRPs may explain the excessive complement activation observed in abca4−/− RPE cells (Fig. 4).
FIGURE 5.
Reduced complement negative regulatory protein genes expression levels in albino abca4−/− mice. A, a histogram shows the relative DAF1, DAF2, CFH, CD59a, CD59b, and CRRY mRNA levels by qRT-PCR from 4-week-old BALB/c (WT) and abca4−/− (KO) mice. Each mRNA level was normalized to 18 S rRNA (n = 9; *, p < 0.005, and **, p < 0.05). B, a histogram shows CFH (a) and CRRY (b) protein levels in 4-week-old mice by quantitative immunoblot analysis. The CFH (c) and CRRY (d) immunoreactivity bands were normalized to α-tubulin (c) and GAPDH (d) bands, respectively. 30- and 20-μg protein amounts were loaded on CFH and CRRY blots, respectively. Error bars indicate S.D. (n = 5; *, p < 0.003). C, immunocytochemistry shows CRRY (green) immunoreactivity in 4-week-old RPE cells of WT (left panels) and KO (right panels). Nuclei are stained with DAPI. There is ∼35% reduction in CRRY-fluorescein intensity in KO RPE sections (n = 17 for the WT and n = 16 for the KO; *, p < 0.00005).
Down-regulation of Monocyte Chemoattractant Protein-1 in abca4−/− Eyes
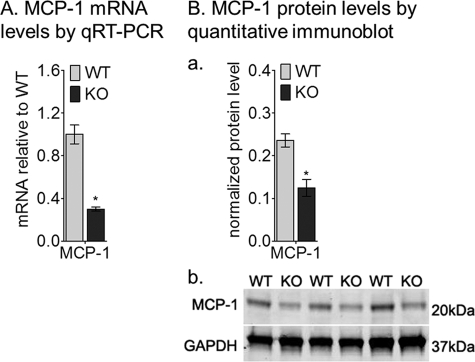
Mice deficient in MCP-1 or ccl-2 and its cognate receptor (ccr-2) manifest AMD-like features including age-dependent lipofuscin accumulation, drusen formation, photoreceptor degeneration, and choroidal neovascularization (41). Accumulation of lipofuscin fluorophores in RPE cells is seen in 4-week-old abca4−/− mice. Clearance of this lipofuscin may depend on macrophage activity in the eye. We measured expression of MCP-1 in abca4−/− RPE cells. Interestingly, the MCP-1 mRNA (Fig. 6A) and protein (Fig. 6B, a and b) levels were 3- and 2-fold lower, respectively, in 4-week-old abca4−/− versus wild-type eyes. These results provide further evidence for immune dysfunction in RPE cells after accumulation of lipofuscin.
FIGURE 6.
MCP-1 mRNA and protein levels are reduced in the albino abca4−/− (KO) mice. A, relative MCP-1 mRNA levels by qRT-PCR from 4-week-old BALB/c (WT) and KO mice are shown; each mRNA level was normalized to 18 S rRNA (n = 9; *, p < 0.0005). Ba, a histogram shows the MCP-1 protein levels after normalization to GAPDH (n = 4; *, p = 0.00025). b, shown are representative immunoblots for MCP-1 and GAPDH antibodies using 20 μg of mouse RPE homogenate per lane.
Increased C-reactive Protein Immunoreactivity in abca4−/− Mice
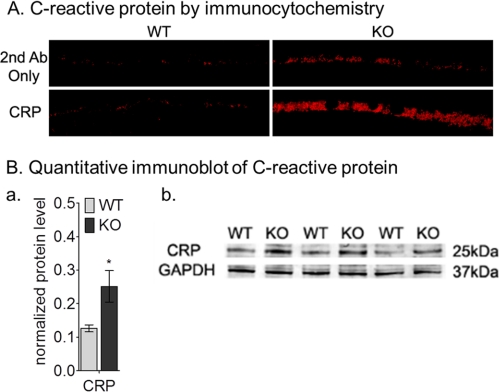
C-reactive protein, an acute-phase reactant, is widely used as a systemic biomarker for chronic inflammation (42). C-reactive protein is also associated with the cardiovascular risk profile and AMD (43). We measured levels of C-reactive protein in the eyes of wild-type and abca4−/− mice by immunocytochemistry and immunoblotting. By both analyses, C-reactive protein levels were dramatically higher in 9-month-old abca4−/− eyes (Fig. 7). By quantitative Western blot analysis, there was about a 2-fold increase of C-reactive protein levels in the abca4−/− RPE homogenates compared with age-matched wild-type (Fig. 7B, a and b).
FIGURE 7.
Increased C-reactive protein immunoreactivity in 9-month-old BALB/c (WT) and albino abca4−/− (KO) mice. A, immunocytochemistry shows C-reactive protein immunoreactivity in WT (left panels) and KO (right panels) RPE cells. Control WT and KO images with secondary antibody (2nd Ab) only are shown in the top panels. Ba, a histogram shows the C-reactive protein levels after normalization to GAPDH (n = 3; *, p = 0.012). b, representative immunoblots for C-reactive protein and GAPDH antibodies using 30 μg mouse RPE homogenate per lane.
Increased Bruch's Membrane Thickness in abca4−/− Mice
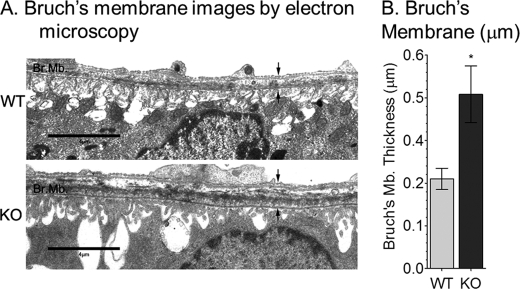
Beside the accumulation of lipofuscin pigment granules in the RPE, 11-month-old albino abca4−/− mice showed a 40% reduction in outer nuclear layer thickness compared with age-matched wild-type mouse, indicating slow photoreceptor degeneration (32). To further characterize the morphological abnormalities in older abca4−/− eyes, we examined Bruch's membrane by electron microscopy. Bruch's membrane, which contains the basement membrane for RPE cells, was ∼2-fold thicker in 1-year-old abca4−/− versus wild-type mice (Fig. 8B). This increase was largely due to the presence of basal laminar deposits. We also observed distortion of RPE basal infoldings in abca4−/− mice (Fig. 8A).
FIGURE 8.
Bruch's membrane thickness in 1-year-old BALB/c (WT) and albino abca4−/− mice. A, representative electron microscopic images of RPE/Bruch's membrane from WT (top) and KO (bottom) mice are shown. B, a histogram shows Bruch's membrane thickness (between the arrows) in WT and KO measured by electron microscopy. Scale bar = 4 μm. Values are shown as S.D. (n = 9; *, p < 0.00005).
Increased Expression of Complement Regulatory and Oxidative Stress Proteins in Fetal Human RPE Cells Treated with abca4−/− Outer Segments
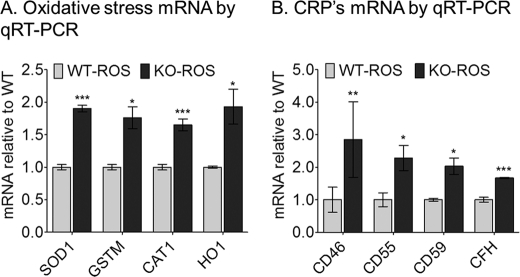
The down-regulation of CRP mRNA levels in the abca4−/− mouse prompted us to test the response of normal RPE cells treated with ROS from BALB/c or abca4−/− mice. The A500 nm A2E precursor was abundantly present in abca4−/− ROS but was undetectable in ROS from wild-type mice (data not shown). We incubated cultured fetal human RPE cells with wild-type or abca4−/− ROS for 2 h. After harvesting the cells, we extracted RNA and analyzed for expression of oxidative genes by qRT-PCR. SOD1, glutathione S-transferase τ, heme oxygenase-1, and CAT1 were all up-regulated in the RPE cells after incubation with abca4−/− but not wild-type ROS (Fig. 9A). We also observed increased expression of the CRP mRNA, CD46, CD55, CD59, and CFH in these normal RPE cells after exposure to abca4−/− but not wild-type (Fig. 9B). These data suggest that the abca4−/− ROS containing A500 nm A2E precursor leads to acute oxidative stress in normal RPE cells. This stress leads to the adaptive up-regulation of oxidative-stress and CRP gene expression.
FIGURE 9.
Oxidative stress (A) and complement negative regulatory protein genes (B) expression levels in cultured human RPE cells after challenging with BALB/c (WT-ROS) or albino abca4−/− (KO-ROS) outer segments. Relative SOD1, GSTM, CAT1, heme oxygenase-1 (HO1) mRNA (A) and CD46, CD55, CD59, and CFH mRNA (B) levels by qRT-PCR are shown. Each mRNA level was normalized to 18 S rRNA (n = 8; *, p < 0.005; **, p < 0.05; ***, p < 0.0005).
DISCUSSION
AMD and recessive Stargardt disease have some similar clinical features. However, the causes of these diseases were thought to be unrelated. The etiology of AMD is complex, with a strong inflammatory component due to genetic dysregulation of the complement system. Light-induced oxidative stress is also thought to play a role in AMD. On the other hand, Stargardt is caused by the loss of a transporter for N-retinylidene-phosphatidylethanolamine in rod and cone outer segment discs, with accumulation of retinaldehyde condensation products, such as A2E, in the RPE. In the current work we showed complement activation and reduced expression of CRPs in the RPE of abca4−/− mice. The RPE of these mice also exhibit biochemical evidence for light-induced oxidative stress and chronic inflammation. These observations suggest a common pathway in the etiologies of AMD and Stargardt.
Because retinal degeneration occurs slowly in albino abca4−/− mice (32), we analyzed mice at different ages to establish a correlation between light exposure, A2E formation, oxidative stress, and complement system activation. First, we showed that A2E and its major precursor (A500 nm) are present in 1-month-old abca4−/− mouse eyecups (Fig. 1). Accumulation of both vitamin A-based fluorophores is age-dependent (Fig. 1) and influenced by light intensity (31). In vitro preliminary studies have shown that the A500 nm compound is highly unstable, undergoing chemical rearrangements leading to release of hydrogen peroxide (data not shown). Moreover, A500 nm is oxidized and hydrolyzed in the RPE to yield A2E (44). All of these reactions could increase oxidative stress in abca4−/− RPE. Consistently, we observed increased expression of multiple oxidative stress genes in 4-week-old abca4−/− eyecups (Fig. 2). Previously, we showed that oxidation products of A2E (A2E oxiranes) are increased in both pigmented and albino abca4−/− mice exposed to bright cyclic light, with higher levels in the albinos (31). We also analyzed two oxidative stress markers in eyecup homogenates from abca4−/− and wild-type mice. MDA and HNE, both natural byproducts of lipid peroxidation, were significantly higher in albino abca4−/− compared with albino wild-type and pigmented abca4−/− mice (Fig. 3 and data not shown). Differences between the albino and the pigmented abca4−/− mice provide evidence for the role of melanin pigments in scavenging the reactive oxygen species that form under oxidative conditions (45). These data support the notion that oxidative stress is a cause of retinal degeneration in albino abca4−/− mice.
Hollyfield et al. (46) reported that inflammatory changes induced by oxidative damage cause AMD-like lesions in wild-type mice. An important function of the RPE is phagocytosis and digestion of distal rod and cone OSs (47). These membranes contain high concentrations of polyunsaturated fatty acids (48). In AMD, peroxidation of OS lipids induces damage, leading to death of RPE cells and accumulation of extracellular materials in the form of drusen and increased thickness of Bruch's membrane (49, 50). Here, we show that 1-year-old abca4−/− mice exhibit a 2-fold increase in Bruch's membrane thickness (Fig. 8), suggesting a similar inflammatory process.
Activation of complement (C3) by A2E oxidation products was previously shown in cultured RPE cells after light exposure (34, 35). Here, we analyzed the in vivo effect of lipofuscin bis-retinoids and their oxidation products on the complement system. Activation of complement was evidenced by accumulation of C3/C3b and its break-down fragments (iC3b and C3a) in abca4−/− RPE cells (Fig. 4). We also observed increased deposition of C3b immunogold particles on the abca4−/− RPE basal infoldings (Fig. 4B). Throughout the body, complement fragments are typically eliminated by macrophage activity. Ingestion of complement fragments by the RPE is consistent with their role as macrophages in the retina (47). These observations suggest ongoing complement activation in abca4−/− RPE. Unexpectedly, we observed significantly lower levels of CRP mRNAs in abca4−/− RPE cells (Fig. 5). One interpretation is that the lipofuscin pigments directly activate the complement system in abca4−/− RPE and that the reduced expression of CRP is an adverse effect of inflammatory damage. Alternatively, lipofuscin accumulation and oxidative stress in abca4−/− RPE may impair expression of CRPs, leading to complement activation and further inflammatory damage. Reduced CFH expression may also affect its interaction with C-reactive protein (51), leading to chronic complement activation. C-reactive protein, an inflammatory biomarker associated with AMD, was significantly elevated in albino abca4−/− eyes by immunoblotting and immunocytochemistry (Fig. 7). In addition, MCP-1 mRNA and protein levels were significantly down-regulated in young abca4−/− eyes (Fig. 6), indicating further impairment of the abca4−/− ocular immune response.
The paradoxically reduced expression of CRPs in abca4−/− RPE probably results from oxidative and inflammatory stress triggered by accumulation of small amounts of vitamin A fluorophores. To explore the response of a healthy RPE to acute stress, we challenged primary cultured human RPE cells (37) to a single exposure of OSs from wild-type and abca4 −/− mice. Within 2 h, we observed dramatically increased expression of mRNAs for both oxidative stress and complement regulatory proteins in cells exposed to abca4−/− but not wild-type OS (Fig. 9). The major difference between these OS preparations is the presence of the A2E precursor, A500 nm, in abca4−/− OS (44). These results suggest that A500 nm is a potent oxidative stressor and activator of complement. The observed up-regulation of anti-oxidative and complement regulatory protein mRNAs in normal RPE cells represents an adaptive response. With ongoing oxidative and inflammatory damage in abca4−/− mice and Stargardt patients, RPE cells may lose the capacity to protect themselves from complement attack by maintaining high expression of complement regulatory proteins. This result suggests that forced overexpression of one or more complement regulatory proteins in the RPE of Stargardt patients may slow disease progression.
In summary, we have shown increased oxidative stress and complement activation in abca4−/− RPE cells. This was accompanied by paradoxically reduced expression of complement regulatory proteins. Given the striking biochemical similarities of the abca4−/− mouse to Stargardt patients (44), these changes may also be present in Stargardt RPE cells. The results presented here suggest that the etiologies of AMD and recessive Stargardt disease are convergent. Chronic inflammation of the RPE cells caused by dysregulation of the complement system appears to represent a common pathway.
Acknowledgment
We thank Scott Fish for outstanding technical assistance.
This work was supported, in whole or in part, by National Institutes of Health Grants EY00331 (NEI; to D. B.) and R24 EY017404. This work was also supported by grants from the American Health Assistance Foundation (to R. A. R.), the Macula Vision Research Foundation (to D. B. and G. H. T.), and the Foundation Fighting Blindness (to D. B. and G. H. T.) .
- AMD
- age-related macular degeneration
- CFH
- complement factor H
- C3
- complement factor 3
- RPE
- retinal pigment epithelium
- MDA
- malondialdehyde
- HNE
- 4-hydroxynonenal
- OS
- outer segment
- ROS
- rod OS
- RT
- room temperature
- qRT-PCR
- quantitative real-time-PCR
- CAT1
- catalase-1
- SOD1
- superoxide dismutase 1
- MCP-1
- monocyte chemoattractant protein-1
- CRP
- C-reactive protein
- Bis-Tris
- 2-[bis(2-hydroxyethyl)amino]-2-(hydroxymethyl)propane-1,3-diol.
REFERENCES
- 1. Donoso L. A., Kim D., Frost A., Callahan A., Hageman G. (2006) Surv. Ophthalmol. 51, 137–152 [DOI] [PMC free article] [PubMed] [Google Scholar]
- 2. Beatty S., Koh H., Phil M., Henson D., Boulton M. (2000) Surv. Ophthalmol. 45, 115–134 [DOI] [PubMed] [Google Scholar]
- 3. Klein R. J., Zeiss C., Chew E. Y., Tsai J. Y., Sackler R. S., Haynes C., Henning A. K., SanGiovanni J. P., Mane S. M., Mayne S. T., Bracken M. B., Ferris F. L., Ott J., Barnstable C., Hoh J. (2005) Science 308, 385–389 [DOI] [PMC free article] [PubMed] [Google Scholar]
- 4. Hageman G. S., Anderson D. H., Johnson L. V., Hancox L. S., Taiber A. J., Hardisty L. I., Hageman J. L., Stockman H. A., Borchardt J. D., Gehrs K. M., Smith R. J., Silvestri G., Russell S. R., Klaver C. C., Barbazetto I., Chang S., Yannuzzi L. A., Barile G. R., Merriam J. C., Smith R. T., Olsh A. K., Bergeron J., Zernant J., Merriam J. E., Gold B., Dean M., Allikmets R. (2005) Proc. Natl. Acad. Sci. U.S.A. 102, 7227–7232 [DOI] [PMC free article] [PubMed] [Google Scholar]
- 5. Edwards A. O., Ritter R., 3rd, Abel K. J., Manning A., Panhuysen C., Farrer L. A. (2005) Science 308, 421–424 [DOI] [PubMed] [Google Scholar]
- 6. Haines J. L., Hauser M. A., Schmidt S., Scott W. K., Olson L. M., Gallins P., Spencer K. L., Kwan S. Y., Noureddine M., Gilbert J. R., Schnetz-Boutaud N., Agarwal A., Postel E. A., Pericak-Vance M. A. (2005) Science 308, 419–421 [DOI] [PubMed] [Google Scholar]
- 7. Hughes A. E., Orr N., Esfandiary H., Diaz-Torres M., Goodship T., Chakravarthy U. (2006) Nat. Genet. 38, 1173–1177 [DOI] [PubMed] [Google Scholar]
- 8. Hageman G. S., Hancox L. S., Taiber A. J., Gehrs K. M., Anderson D. H., Johnson L. V., Radeke M. J., Kavanagh D., Richards A., Atkinson J., Meri S., Bergeron J., Zernant J., Merriam J., Gold B., Allikmets R., Dean M. (2006) Ann. Med. 38, 592–604 [DOI] [PubMed] [Google Scholar]
- 9. Gold B., Merriam J. E., Zernant J., Hancox L. S., Taiber A. J., Gehrs K., Cramer K., Neel J., Bergeron J., Barile G. R., Smith R. T., Hageman G. S., Dean M., Allikmets R. (2006) Nat. Genet. 38, 458–462 [DOI] [PMC free article] [PubMed] [Google Scholar]
- 10. Yates J. R., Sepp T., Matharu B. K., Khan J. C., Thurlby D. A., Shahid H., Clayton D. G., Hayward C., Morgan J., Wright A. F., Armbrecht A. M., Dhillon B., Deary I. J., Redmond E., Bird A. C., Moore A. T. (2007) N. Engl. J. Med. 357, 553–561 [DOI] [PubMed] [Google Scholar]
- 11. Maller J. B., Fagerness J. A., Reynolds R. C., Neale B. M., Daly M. J., Seddon J. M. (2007) Nat. Genet. 39, 1200–1201 [DOI] [PubMed] [Google Scholar]
- 12. Hecker L. A., Edwards A. O., Ryu E., Tosakulwong N., Baratz K. H., Brown W. L., Charbel Issa P., Scholl H. P., Pollok-Kopp B., Schmid-Kubista K. E., Bailey K. R., Oppermann M. (2010) Hum. Mol. Genet. 19, 209–215 [DOI] [PMC free article] [PubMed] [Google Scholar]
- 13. Richards A., Kavanagh D., Atkinson J. P. (2007) Adv. Immunol. 96, 141–177 [DOI] [PubMed] [Google Scholar]
- 14. Young R. W. (1987) Surv. Ophthalmol. 31, 291–306 [DOI] [PubMed] [Google Scholar]
- 15. Shen J. K., Dong A., Hackett S. F., Bell W. R., Green W. R., Campochiaro P. A. (2007) Histol. Histopathol. 22, 1301–1308 [DOI] [PubMed] [Google Scholar]
- 16. Tanito M., Elliott M. H., Kotake Y., Anderson R. E. (2005) Invest Ophthalmol. Vis. Sci. 46, 3859–3868 [DOI] [PubMed] [Google Scholar]
- 17. Kapphahn R. J., Giwa B. M., Berg K. M., Roehrich H., Feng X., Olsen T. W., Ferrington D. A. (2006) Exp Eye Res. 83, 165–175 [DOI] [PubMed] [Google Scholar]
- 18. Gu X., Meer S. G., Miyagi M., Rayborn M. E., Hollyfield J. G., Crabb J. W., Salomon R. G. (2003) J. Biol. Chem. 278, 42027–42035 [DOI] [PubMed] [Google Scholar]
- 19. Allikmets R., Singh N., Sun H., Shroyer N. F., Hutchinson A., Chidambaram A., Gerrard B., Baird L., Stauffer D., Peiffer A., Rattner A., Smallwood P., Li Y., Anderson K. L., Lewis R. A., Nathans J., Leppert M., Dean M., Lupski J. R. (1997) Nat. Genet. 15, 236–246 [DOI] [PubMed] [Google Scholar]
- 20. Bither P. P., Berns L. A. (1988) J. Am. Optom. Assoc. 59, 106–111 [PubMed] [Google Scholar]
- 21. Maugeri A., Klevering B. J., Rohrschneider K., Blankenagel A., Brunner H. G., Deutman A. F., Hoyng C. B., Cremers F. P. M. (2000) Am. J. Hum. Genet. 67, 960–966 [DOI] [PMC free article] [PubMed] [Google Scholar]
- 22. Delori F. C., Staurenghi G., Arend O., Dorey C. K., Goger D. G., Weiter J. J. (1995) Invest. Ophthalmol. Vis. Sci. 36, 2327–2331 [PubMed] [Google Scholar]
- 23. Cideciyan A. V., Aleman T. S., Swider M., Schwartz S. B., Steinberg J. D., Brucker A. J., Maguire A. M., Bennett J., Stone E. M., Jacobson S. G. (2004) Hum. Mol. Genet. 13, 525–534 [DOI] [PubMed] [Google Scholar]
- 24. Illing M., Molday L. L., Molday R. S. (1997) J. Biol. Chem. 272, 10303–10310 [DOI] [PubMed] [Google Scholar]
- 25. Sun H., Molday R. S., Nathans J. (1999) J. Biol. Chem. 274, 8269–8281 [DOI] [PubMed] [Google Scholar]
- 26. Weng J., Mata N. L., Azarian S. M., Tzekov R. T., Birch D. G., Travis G. H. (1999) Cell 98, 13–23 [DOI] [PubMed] [Google Scholar]
- 27. Sparrow J. R., Zhou J., Ben-Shabat S., Vollmer H., Itagaki Y., Nakanishi K. (2002) Invest. Ophthalmol. Vis. Sci. 43, 1222–1227 [PubMed] [Google Scholar]
- 28. Wang Z., Keller L. M., Dillon J., Gaillard E. R. (2006) Photochem. Photobiol. 82, 1251–1257 [DOI] [PubMed] [Google Scholar]
- 29. Dillon J., Wang Z., Avalle L. B., Gaillard E. R. (2004) Exp. Eye Res. 79, 537–542 [DOI] [PubMed] [Google Scholar]
- 30. Avalle L. B., Wang Z., Dillon J. P., Gaillard E. R. (2004) Exp. Eye Res. 78, 895–898 [DOI] [PubMed] [Google Scholar]
- 31. Radu R. A., Mata N. L., Bagla A., Travis G. H. (2004) Proc. Natl. Acad. Sci. U.S.A. 101, 5928–5933 [DOI] [PMC free article] [PubMed] [Google Scholar]
- 32. Radu R. A., Yuan Q., Hu J., Peng J. H., Lloyd M., Nusinowitz S., Bok D., Travis G. H. (2008) Invest. Ophthalmol. Vis. Sci. 49, 3821–3829 [DOI] [PMC free article] [PubMed] [Google Scholar]
- 33. Boon C. J., Jeroen Klevering B., Keunen J. E., Hoyng C. B., Theelen T. (2008) Vision Res. 48, 2569–2577 [DOI] [PubMed] [Google Scholar]
- 34. Zhou J., Kim S. R., Westlund B. S., Sparrow J. R. (2009) Invest Ophthalmol. Vis. Sci. 50, 1392–1399 [DOI] [PMC free article] [PubMed] [Google Scholar]
- 35. Zhou J., Jang Y. P., Kim S. R., Sparrow J. R. (2006) Proc. Natl. Acad. Sci. U.S.A. 103, 16182–16187 [DOI] [PMC free article] [PubMed] [Google Scholar]
- 36. Parish C. A., Hashimoto M., Nakanishi K., Dillon J., Sparrow J. (1998) Proc. Natl. Acad. Sci. U.S.A. 95, 14609–14613 [DOI] [PMC free article] [PubMed] [Google Scholar]
- 37. Hu J., Bok D. (2001) Mol. Vis. 7, 14–19 [PubMed] [Google Scholar]
- 38. Yang P., Tyrrell J., Han I., Jaffe G. J. (2009) Invest. Ophthalmol. Vis. Sci. 50, 3473–3481 [DOI] [PubMed] [Google Scholar]
- 39. Kurth I., Thompson D. A., Rüther K., Feathers K. L., Chrispell J. D., Schroth J., McHenry C. L., Schweizer M., Skosyrski S., Gal A., Hübner C. A. (2007) Mol. Cell. Biol. 27, 1370–1379 [DOI] [PMC free article] [PubMed] [Google Scholar]
- 40. Li B., Sallee C., Dehoff M., Foley S., Molina H., Holers V. M. (1993) J. Immunol. 151, 4295–4305 [PubMed] [Google Scholar]
- 41. Ambati J., Anand A., Fernandez S., Sakurai E., Lynn B. C., Kuziel W. A., Rollins B. J., Ambati B. K. (2003) Nat. Med. 9, 1390–1397 [DOI] [PubMed] [Google Scholar]
- 42. Young B., Gleeson M., Cripps A. W. (1991) Pathology 23, 118–124 [DOI] [PubMed] [Google Scholar]
- 43. Seddon J. M., George S., Rosner B., Rifai N. (2005) Arch. Ophthalmol. 123, 774–782 [DOI] [PubMed] [Google Scholar]
- 44. Mata N. L., Weng J., Travis G. H. (2000) Proc. Natl. Acad. Sci. U.S.A. 97, 7154–7159 [DOI] [PMC free article] [PubMed] [Google Scholar]
- 45. Wang Z., Dillon J., Gaillard E. R. (2006) Photochem. Photobiol. 82, 474–479 [DOI] [PubMed] [Google Scholar]
- 46. Hollyfield J. G., Bonilha V. L., Rayborn M. E., Yang X., Shadrach K. G., Lu L., Ufret R. L., Salomon R. G., Perez V. L. (2008) Nat. Med. 14, 194–198 [DOI] [PMC free article] [PubMed] [Google Scholar]
- 47. Young R. W., Bok D. (1969) J. Cell Biol. 42, 392–403 [DOI] [PMC free article] [PubMed] [Google Scholar]
- 48. Fliesler S. J., Anderson R. E. (1983) Prog. Lipid Res. 22, 79–131 [DOI] [PubMed] [Google Scholar]
- 49. Okubo A., Rosa R. H., Jr., Bunce C. V., Alexander R. A., Fan J. T., Bird A. C., Luthert P. J. (1999) Invest. Ophthalmol. Vis. Sci. 40, 443–449 [PubMed] [Google Scholar]
- 50. Booij J. C., Baas D. C., Beisekeeva J., Gorgels T. G., Bergen A. A. (2010) Prog. Retin. Eye Res. 29, 1–18 [DOI] [PubMed] [Google Scholar]
- 51. Johnson P. T., Betts K. E., Radeke M. J., Hageman G. S., Anderson D. H., Johnson L. V. (2006) Proc. Natl. Acad. Sci. U.S.A. 103, 17456–17461 [DOI] [PMC free article] [PubMed] [Google Scholar]


