Abstract
Smad2 is a critical mediator of TGF-β signals that are known to play an important role in a wide range of biological processes in various cell types. Its role in the development of the CNS, however, is largely unknown. Mice lacking Smad2 in the CNS (Smad2-CNS-KO) were generated by a Cre-loxP approach. These mice exhibited behavioral abnormalities in motor coordination from an early postnatal stage and mortality at approximately 3 weeks of age, suggestive of severe cerebellar dysfunction. Gross observation of Smad2-CNS-KO cerebella demonstrated aberrant foliations in lobule IX and X. Further analyses revealed increased apoptotic cell death, delayed migration and maturation of granule cells, and retardation of dendritic arborization of Purkinje cells. These findings indicate that Smad2 plays a key role in cerebellar development and motor function control.
Keywords: Ataxia, Gene Knock-out, Mouse, Neurodevelopment, SMAD Transcription Factor, Granule Cell, Purkinje Cell, Smad2
Introduction
The TGF-β superfamily encompasses >40 kinds of ligands, which control a wide variety of cellular processes, including cell differentiation, proliferation, apoptosis, and developmental fate specification (1). All TGF-β signals are mediated by the intracellular signal transducers, Smad proteins. Smad proteins are classified into three groups. The first group, receptor-regulated Smad proteins (R-Smad), consists of Smad1, -2, -3, -5, and -8, which are further divided into two subgroups, with Smad2 and -3 responding to TGF-βs and activins, and Smad1, -5, and -8 to bone morphogenetic proteins. The second group, inhibitory Smad proteins (I-Smad), consists of Smad6 and -7, which negatively regulate R-Smad proteins to suppress TGF-β signaling. The last group, common Smad (Co-Smad), consists of Smad4 only, which binds to phosphorylated R-Smad proteins and translocates into the nucleus to regulate transcription of TGF-β target genes (1–4).
Smad proteins contain a Mad homology 1 (MH1) domain at the N terminus and an MH2 domain at the C terminus. The MH1 domain allows DNA binding and subsequent regulation of target gene expression. Although the MH1 domain of Smad2 is interrupted by exon3, a splice variant of Smad2 lacking exon3 (Smad2-Δe3) assumes features of Smad3 and can directly bind to DNA (5, 6). Interestingly, Smad2-Δe3 is strongly expressed in the mouse brain during early postnatal stages (7). Additionally, constitutively phosphorylated Smad2 has been shown to localize to the nuclei of neuronal cells (8–10). These findings suggest that Smad2-mediated TGF-β signaling plays critical roles in development, function, and/or maintenance of neuronal cells and the brain. Indeed, Smad2 has been shown to regulate proliferation and differentiation of cultured hippocampal granule neurons (11) along with axonal morphogenesis of cultured cerebellar granule neurons (10). SMAD2 has also been suggested to be involved in the pathogenesis of Tau-related neurodegenerative diseases in humans, such as Alzheimer disease (8, 12, 13) and Pick disease (14). Despite its implications in the pathogenesis of various neurodegenerative diseases, the role of TGF-β signals mediated by Smad2 in the CNS is still unclear.
Smad3 knock-out mice do not exhibit neurological abnormalities, suggesting that Smad3 is not involved in CNS development (15). In contrast, Smad2 knock-out mice exhibit early embryonic lethality within 7.5–12.5 days of gestation (16–19). The role of Smad2 in mammalian neurons in vivo has therefore remained largely unexplored. Here, we report that mice lacking Smad2 in the CNS exhibit ataxic behaviors, abnormal cerebellar foliation, and deficits in granule cell (GC)2 maturation and Purkinje cell (PC) dendritogenesis. These results strongly support the key role of Smad2 in mouse cerebellar development.
EXPERIMENTAL PROCEDURES
Generation of Conditional Knock-out Mice Lacking Smad2 in CNS
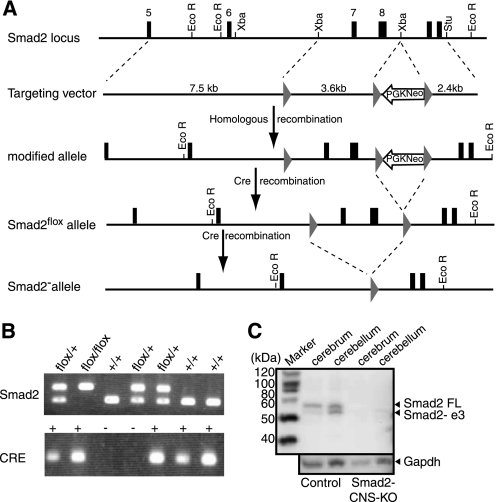
Mouse experiments were performed according to guidelines set by the animal ethics committee of Kyushu University Graduate School of Medicine. DNA fragments flanking exon6 were as follows: StuI-XbaI (7.5 kb) and XbaI-StuI (2.4 kb) as the 5′ and 3′ arms, respectively, were isolated from a 129sv mouse-derived genomic library and subcloned into a pflox vector. Flanked loxP sites and a neomycin-resistant cassette were introduced as shown in (see Fig. 1A). The targeting vector was linearized with XhoI and transfected into mouse ES cells. Of the 196 G418-resistant ES cell clones, 11 showed correct targeting when analyzed by Southern blot hybridization. To excise the neomycin-resistant cassette, Smad2-modified ES cells were transfected with a Cre expression plasmid. The Smad2flox/+ ES cells were injected into C57BL/6 blastocysts, and subsequent chimeric mice were crossed with C57BL/6 mice to obtain Smad2flox/+ offspring. Smad2flox/+ mice were backcrossed with C57BL/6 mice for eight generations and used for the following experiments.
FIGURE 1.
Conditional Smad2 targeting allows neural-cell specific Smad2 knock-out. A, a schematic representation of the Smad2 conditional targeting strategy. The upper panel shows a partial genomic map of the wild-type Smad2 gene used in the creation of the target vector. PGK-neo-poly(A) cassette flanked by loxP sites were introduced downstream of exon8. An additional loxP site was introduced upstream of exon7. Arrows indicate selection of the homologous recombinants and Cre-mediated deletion of exons7 and 8. B, genotyping of the Smad2-CNS-KO mice and their littermates. By using the Lox-3S and Lox-2R primers, the 500-bp band was generated from the flox allele, whereas the 351-bp band was generated from the control allele. By using Cre forward and reverse primers, the 100-bp band was generated. C, ablation of Smad2 proteins in Smad2-CNS-KO mice. Western blotting in the cerebrum and cerebellum detected Smad2 in wild-type mice but not in Smad2 mutant mice at P8 (upper panel). The upper band detected the full-length (FL) isoform of Smad2 (58 kDa), and the lower band detected the short isoform of Smad2 lacking exon3. GAPDH was used as an internal control (lower panel).
Female Smad2flox/+ mice were crossed with male transgenic mice expressing Cre recombinase under the control of nestin regulatory elements (Nes-Cre) to obtain Smad2flox/+;Nes-Cre mice. Then, Smad2flox/+;Nes-Cre mice were crossed with Smad2flox/+ mice. Mice lacking Smad2 in the CNS (Smad2flox/flox; Nes-Cre) were generated at the expected Mendelian ratio. Mice were genotyped for the Smad2 conditional allele and the Nestin-Cre transgene using PCR with the following primers: Lox-3S, 5′-TGAGACTTCTCTGTACCCGAT-3′; and Lox-2R, 5′-CATCAGATTCCATTAGAGATGG-3′; and Cre forward, 5′-GCGGTCTGGCAGTAAAAACTATC-3′; and Cre reverse, 5′- GTGAAACAGCATTGCTGTCACTT-3′, respectively.
Preparation of Cerebellar Lysates and Immunoblotting
Mouse brain tissues were homogenized in lysis buffer (25 mm Tris, 150 mm NaCl, 5 mm EDTA, 1% (v/v) Triton X-100, 0.5% (w/v) deoxycholate, protease inhibitors), and the protein contents were measured with a BCA Protein Assay kit (Thermo Fisher Scientific, Rockford, IL). Samples (20 μg) were dissolved in Laemmli sample buffer (Bio-Rad) with 5% (v/v) mercaptoethanol, heat-denatured at 100 °C for 2 min, electrophoresed on 10% (v/v) polyacrylamide gels (Bio-Rad), and electroblotted onto a PVDF membrane (Millipore, Billerica, MA). The PVDF membrane was blocked with 4% (v/v) Block Ace in TBS containing 0.1% (v/v) Tween 20 at room temperature for 5 h and incubated with the primary antibody at 4 °C overnight. The primary antibodies used were rabbit anti-Smad2 (1:250 dilution; Cell Signaling Technology, Danvers, MA) and rabbit anti-synaptophysin (1:1000 dilution; Zymed Laboratories Inc., San Francisco, CA); secondary antibodies were peroxidase-conjugated antibodies (1:1000 dilution; Cell Signaling); and the internal control antibody was rabbit anti-mouse GAPDH antibody (1:1000 dilution; Santa Cruz Biotechnology, Santa Cruz, CA). Protein bands were visualized with the ECL Plus Western blotting Detection System (GE Healthcare).
Behavioral Analysis
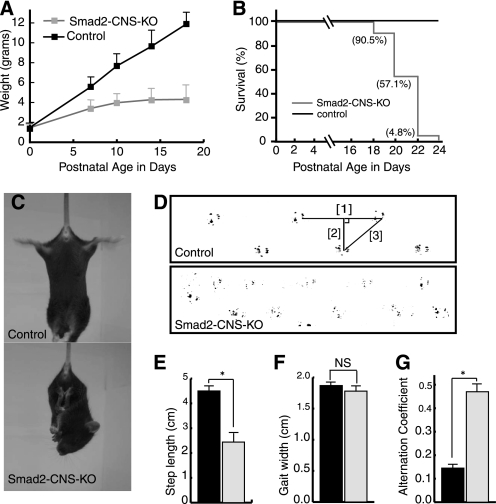
Footprint analysis was carried out as described previously (20–22). Briefly, 18-day-old mice with hind limbs coated with nontoxic ink were allowed to walk on paper through a tunnel (50 cm long, 9 cm wide, and 8 cm high). The subsequent footprint patterns were evaluated on three parameters; step length is the average longitudinal distance between alternate steps (step 1), gait width is the average lateral distance between left and right steps measured by the perpendicular distance of a given step to a line connecting its opposite preceding and succeeding steps (step 2); and the alternation coefficient is the uniformity of step alternation calculated by the mean of the absolute value of 0.5 minus the ratio of right-left distance to right-right step distance for every left-right step pair (as 0.5 − (step 3/step 1)).
Histology, Immunohistochemistry, and Terminal Deoxynucleotidytransferase-mediated UTP End Labeling
Embryonic and postnatal brains were dissected and fixed by immersion in 4% (w/v) paraformaldehyde overnight at 4 °C. Brains collected after postnatal day 5 (P5) were transcardially perfused with 0.1 m phosphate buffer followed by 4% (w/v) paraformaldehyde. Tissue was embedded in paraffin according to standard methods and sectioned at 10 μm. For consistency, sections analyzed from the vermis were limited to the most medial 100–200 μm. For histology, sections were deparaffinized, washed with water, stained with Mayer's hematoxylin solution for 5 min, washed with water, counterstained with 0.5% (v/v) eosin alcohol solution for 2 min, dehydrated, and mounted. Antibody staining was performed according to standard protocols. The primary antibodies used were rabbit anti-Smad2 (1:100 dilution; Cell Signaling Technology), rabbit anti-calbindin (1:200 dilution; Cell Signaling Technology), mouse anti-proliferating cell nuclear antigen (PCNA; 1:200 dilution, Dako), mouse anti-NeuN (1:100 dilution, Chemicon), and rabbit anti-synaptophysin (1:200 dilution; Zymed Laboratories Inc.). Sections were incubated with HRP-linked and Alexa Fluor-conjugated secondary antibodies for light and fluorescence microscopy, respectively. Purkinje morphology was assessed by dendritic parameters using a modification of the method described by Sholl (23). To catalogue the dendrites, the branch arising from the perikaryon was designated the primary branch, and the next branch was named the secondary branch. The point between the primary and secondary branch was termed the primary branch point. Using this classification, the number of branch points was calculated.
DNA fragmentation in cells, a hallmark of apoptosis, was detected by in situ labeling with the TUNEL assay kit (Chemicon, Temecula, CA), followed by counterstaining with 0.5% (w/v) methyl green (Wako, Osaka, Japan). Sections were analyzed with a BZ-8000 microscope (Keyence, Osaka, Japan).
Total RNA Isolation
Total RNA was isolated from P7 mouse cerebella using TRIzol reagent (Invitrogen) and purified using a SV Total RNA Isolation System (Promega Corp., Madison, WI) according to the manufacturer's instructions. RNA samples were quantified by an ND-1000 spectrophotometer (NanoDrop Technologies, Wilmington, DE), and the quality was confirmed with an Experion System (Bio-Rad).
Semiquantitative RT-PCR
Total RNAs obtained from P7 mouse cerebella were reverse transcribed with a QuantiTect Reverse Transcription Kit (Qiagen, Hilden, Germany) according to manufacturer's instructions. The resulting cDNAs were amplified in 25 μl of GoTaq Green Master Mix (Promega Corp.). The following primers were used: Gabra6-RT-F, 5′-TCAGTGCTCGGCACTCTCTA-3′ and Gabra6-RT-R, 5′-GCCTTTCAGCCTTCTGTGAC-3′; Gabra2-RT-F, 5′-CCACGACTCCTCAAGCTCTC-3′ and Gabra2-RT-R, 5′-CTTGTTGCCAAAGCTGAACA-3′; and Gabrd-RT-F, 5′-TATGGCTCCCTGACACCTTC-3′ and Gabrd-RT-R, 5′-GTACTTGGCGAGGTCCATGT-3′. As an internal control, the β-actin region was amplified using the following primers: β-actin-F, 5′-CTGTATTCCCCTCCATCGTG-3′ and β-actin-R, 5′-CCATCACAATGCCTGTGGTA-3′. The PCR products were separated on a 1.5% (w/v) agarose gel and were visualized by ethidium bromide staining. The gel was photographed and the relative content of each sample was computed and compared with internal consulting with ImageJ software (version 1.43u). All RT-PCR experiments were repeated three times.
RESULTS
Generation of Neural Cell-specific Smad2 Conditional Knock-out Mice
To clarify the role of Smad2 in brain development, NestinCre-Smad2flox/flox (Smad2-CNS-KO) mice lacking Smad2 expression in the CNS were generated (Fig. 1A). Genotyping of littermates through PCR analysis (Fig. 1B) showed prevalence of Smad2-CNS-KO mice at close to the expected Mendelian frequency. Intercross progeny between NestinCre-Smad2flox/+ and Smad2flox/+ comprised 12.8% (21/164) of the NestinCre-Smad2flox/flox mice at birth from 20 litters. Western blot analysis was performed to confirm the loss of Smad2 protein expression, including that of the full-length (Smad2-FL) and short (Smad2-Δe3) isoforms (Fig. 1C) in Smad2-CNS-KO mice. In control mice, both Smad2-FL and Smad2-Δe3 proteins were found in the cerebrum and cerebellum, with Smad2-Δe3 predominantly expressed in the cerebellum. In Smad2-CNS-KO mice, neither isoform was expressed.
Growth Retardation and Ataxic Behaviors in Smad2-CNS-KO Mice
The Smad2-CNS-KO mice were indistinguishable from other littermates at P0 but became identifiable due to their smaller bodies and inability to gain body weight by P7 (Fig. 2A). Smad2-CNS-KO mice survived to ∼3 weeks of age, with lethality occurring at P18. Smad2-CNS-KO mice were unable to survive beyond P24 (Fig. 2B).
FIGURE 2.
Growth retardation and cerebellar ataxia in Smad2-CNS-KO mice. A, Smad2-CNS-KO mice showed growth retardation. Smad2-CNS-KO mice could not gain weight after P5. The diagram compares the body weights of control and Smad2-CNS-KO mice over postnatal development (n = 5). Error bars indicate S.D. B, survival curves for Smad2-CNS-KO (n = 21) mice and control mice (n = 19). 100% of Smad2-CNS-KO mice died at 24 days of age, whereas no control mice died. C, in the tail suspension test, the Smad2-CNS-KO mice often crossed or clasped their hind limbs, whereas wild-type mice usually extended and shook their hind limbs. D, representative footprint patterns. The ink footprint illustrates the broad-based gait of the hind limbs of control and Smad2-CNS-KO mice at P18. E–G, footprint patterns were quantitatively assessed for step length (E), gait width (F), and step alternation uniformity (G) as described under “Experimental Procedures.” Smad2-CNS-KO mice displayed significantly higher irregularity in step alternation than wild-type controls (alternation coefficient 0.47 ± 0.3 versus 0.15 ± 0.02, n = 3). Black and gray bars represent control and Smad2-CNS-KO, respectively (n = 5).
Furthermore, Smad2-CNS-KO mice walked slowly, often losing their balance and stopping (supplemental Movie 1). The first signs of motor dysfunction appeared at approximately 1 week after birth and became fully evident at approximately 2 weeks of age. Smad2-CNS-KO mice walked with tremors and maintained body balance by spreading their limbs farther apart than the control littermates (supplemental Movie 2), and when suspended vertically by the tail, Smad2-CNS-KO mice held their hind limbs clasped against their trunk in an abnormal dystonic posture, whereas the control littermates kept their hind limbs extended (Fig. 2C). The hind limb footprint patterns of Smad2-CNS-KO mice showed ataxic gaiting (Fig. 2D). Footprint analysis revealed that the step length in the Smad2-CNS-KO mice was significantly reduced compared with that in the control littermates (Fig. 2E). The step width in the Smad2-CNS-KO mice was comparable with that in the control mice, although their body size was significantly small (Fig. 2F). Furthermore, Smad2-CNS-KO mice displayed irregular step alternation, indicating reduced motor coordination of the hind limbs (Fig. 2G).
Smad2 Expression Levels Changed during Mouse Cerebellar Development
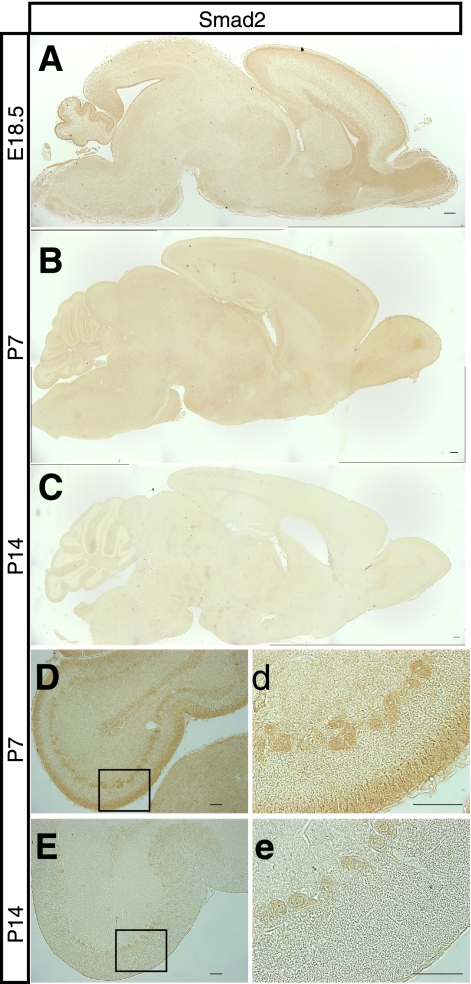
If the lack of Smad2 contributes to ataxia, we reasoned that Smad2 should be expressed in the cerebellum during cerebellar development. We therefore carried out immunostaining using an antibody that specifically recognizes Smad2 to analyze midsagittal brain sections from control mice at various embryonic and postnatal stages. Expression of the Smad2 protein varied dramatically during brain development; expression was high in both the cerebellum and cerebrum at embryonic day (E) 18.5, declined sharply after birth and was barely observed in the cerebellum at P14 (Fig. 3, A–C). Upon careful observation of the cerebellum, Smad2 expression was observed in GC and PC layers at P7 (Fig. 3, D and d) and was found at low levels in the PC layer at P14 (Fig. 3, E and e). The spatiotemporal Smad2 expression in the brain may suggest its indispensable role in brain development, especially in cerebellar development and function.
FIGURE 3.
Smad2 expression in the developing cerebellar cortex. A–C, sagittal cerebellar sections from E18.5, P7, and P14 mice were subjected to immunohistochemistry using an antibody that specifically recognizes Smad2. Smad2 is expressed in the cerebellum. D, expression of Smad2 in Purkinje cell bodies and external granule cells in P7 mice cerebella. E, Purkinje cell bodies express low levels of Smad2 in P14 mice cerebella. d and e, magnified panels of the area demarcated by a black box are shown in D and E. Cbr, cerebrum; cbl, cerebellum. Scale bar, 50 μm.
Developmental Abnormalities in Cerebellum of Smad2-CNS-KO Mice
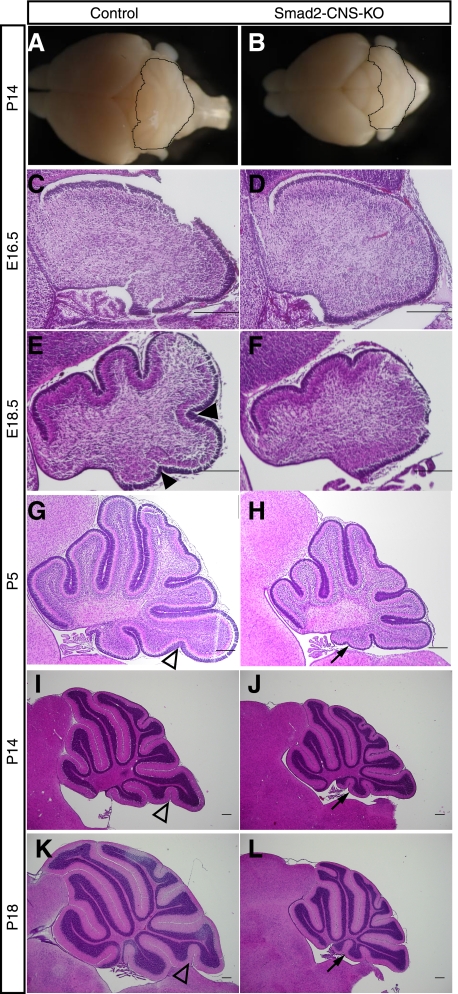
We next assessed Smad2 function in the regulation of cerebellar development, examining the morphology of the cerebella in Smad2-CNS-KO mice for developmental defects. The gross morphology of Smad2-CNS-KO cerebella at P14 was severely compromised along the anteroposterior axis, whereas it was comparable with that of control mice along the mediolateral extent (Fig. 4, A and B), suggesting defects in cerebellar foliation. H&E-stained sections clearly demonstrated morphological abnormalities in cerebellar development of Smad2-CNS-KO mice. Although Smad2-CNS-KO and control cerebella showed no significant difference in gross morphology at E16.5 (Fig. 4, C and D), the former showed abnormal foliation in the following stages. In detail, the control cerebella were clearly divided into four principle fissures and five cardinal lobes at E18.5, whereas the Smad2-CNS-KO cerebella were divided into two fissures and three lobes (Fig. 4, E and F). During the postnatal stages, abnormal foliation and sulcus formation became more evident in the Smad2-CNS-KO cerebella. At P5, lobule IX of the control cerebella had uvular sulcus 1 dividing lobules IXb and IXc, whereas the Smad2-CNS-KO cerebella lacked uvular sulcus 1 (Fig. 4, G and H). Additionally, lobule X in Smad2-CNS-KO cerebella had an extra fissure (arrow) at P5, which divided the lobule into two small lobules by P14 (Fig. 4, I and J). The uvular sulcus 1 was still missing in lobule IX in Smad2-CNS-KO cerebella at P18 (Fig. 4, K and L). Although abnormality in the cerebellar folial pattern of C57BL/6J (B6) mice was recently reported (24), abnormal foliation was observed throughout developmental stages only in Smad2-CNS-KO mice, suggesting that the defects in cerebellar development resulted from deletion of the Smad2 gene in the neuronal system.
FIGURE 4.
Abnormalities in cerebellar development. A and B, gross observation of Smad2-CNS-KO and control mice brains at P14. Compared with those of control littermates, Smad2-CNS-KO mice cerebella were remarkably smaller with more exposed colliculi. C–L, H&E staining of sagittal sections through medial control and Smad2-CNS-KO brains at E16.5, E18.5, P5, P14, and P18. By E16.5, we found that there are similar cell populations in Smad2-CNS-KO and control mice. By E18.5, the four principal fissures and five cardinal lobes are evident in control mice and a reduction in foliation is observed in mutants. Arrowheads indicate the fissure-forming lobules (filled arrowheads) or sublobules (blank arrowheads), which do not appear in Smad2-CNS-KO mice. Arrows indicate that the tenth lobule appears to be small in Smad2-CNS-KO mice when compared with control mice and the presence of an additional specific lobule. Scale bar, 200 μm.
Mouse cerebella undergo dynamic morphological changes during the first 3 weeks of postnatal life (25). Especially during the first postnatal week, neuroblasts proliferate in the external granule cell layer (EGL) and differentiate into cerebellar granule cells that migrate toward the internal granule cell layer (IGL) (26–28). These processes lead to a dramatic increase in volume and formation of the matured cerebellar structure with deep fissures and folia. To determine whether the decrease in the volume and hypoplastic formation of the cerebellum was the result of increased cell death, decreased cell proliferation and/or delayed granule cell maturation and migration, we next evaluated whether the Smad2-CNS-KO cerebellum shows abnormal apoptosis, proliferation, and/or maturation and migration.
Increased Apoptotic Cell Death in Smad2-CNS-KO Cerebella
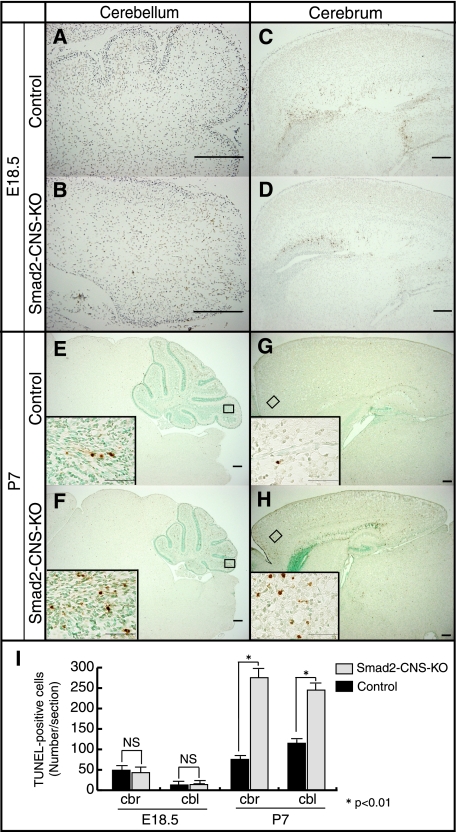
It has been reported that loss of TGF-β1 leads to increased neuronal cell death in mouse brains (29), and TGF-β2 regulates apoptosis and proliferation of cultured cerebellar granule cells (30). To address the question of whether loss of Smad2 results in increased cell death, TUNEL assays were performed. The results showed no significant difference between the numbers of apoptotic cells in the Smad2-CNS-KO and control mice (cerebella, 14 ± 3.8 versus 13.7 ± 4.8; cerebral cortex, 43 ± 8.0 versus 49 ± 8.1) at E18.5 (Fig. 5, A–D and I). However, significantly more TUNEL-positive cells were observed in the Smad2-CNS-KO cerebella (245.3 ± 17.6 versus 115.3 ± 7.4) at P7 (Fig. 5, E, F, and I), which appeared more prominent in lobule IX (insets). In addition, the cerebral cortex of Smad2-CNS-KO mice also showed a higher number of TUNEL-positive cells (274.3 ± 7.8 versus 74 ± 6.6) at P7 (Fig. 5, G–I). These results indicate that lack of Smad2 accelerates apoptotic cell death in the brain, explaining the reduced size of the Smad2-CNS-KO cerebella.
FIGURE 5.
Smad2-CNS-KO mice cerebella and cerebrum display more TUNEL-positive cells than those of control mice. A–H, sagittal brain sections of E18.5 and P7 mice were labeled for TUNEL. At E18.5, Smad2-CNS-KO mice cerebella (A and B) and cerebrum (C and D) showed a similar number of TUNEL-positive cells per section. At P7, compared with those of control mice, Smad2-CNS-KO mice cerebella (E and F) and cerebrum (G and H) showed a higher number of TUNEL-positive cells per section. Scale bar, 200 μm. Insets, high magnification images were taken from the areas indicated by rectangles. Scale bar, 50 μm. Arrowheads indicate TUNEL-positive cells. I, measurement of TUNEL-positive cells in E18.5 and P7 mice. Quantification revealed that at E18.5, no significant differences were found between Smad2-CNS-KO and control mice. However, the number of apoptotic cells is significantly higher in both Smad2-CNS-KO mice cerebellum and cerebrum at P7. Values are expressed as the mean ± S.D. per section of five sections per animal, three animals per group. NS, not significant. An asterisk represents p values < 0.01.
Previous studies have suggested a potential role of TGF-β1 in cerebellar glial cells. TGF-β1 can induce hypertrophy of astrocytes (1, 31, 32) and, in combination with FGF-1 or 2, induce process and colony formation (31, 32). Therefore, immunostaining with an antibody against glial fibrillary acidic protein was performed to examine whether lack of Smad2 affects the glial cell differentiation in Smad2-CNS-KO mice. However, there was no obvious difference in morphology and distribution of the cerebellar glial cells, including Bergmman glial cells between control and Smad2-CNS KO mice at P14 (data not shown). As shown in Fig. 3, Smad2 is preferentially expressed in neuronal cells such as PCs and GCs in the cerebellum, which is consistent with previous studies showing neuron-specific expression of Smad2 (8, 9, 10). Together, apoptotic cells induced in Smad2-CNS-KO mice are likely to be neuronal cells. A further experiment will be required to clarify the role of Smad2 in differentiation of glial cells. Because the cerebellar size and morphogenesis also largely depend on the proliferation and migration of granular neuron precursors in the EGL, we next examined the proliferative capacity and migration ability of cells in the EGL.
Smad2 Is Required for Granule Cell Maturation and Migration but Not Proliferation in Mice Cerebella
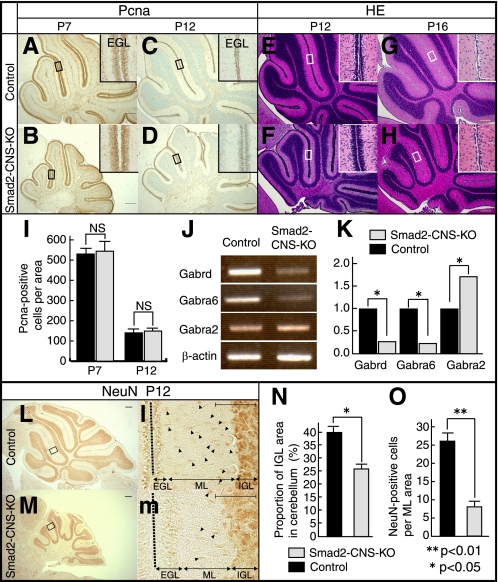
Immunohistochemistry against PCNA, a marker for proliferating cells, showed that proliferation of GCs in the EGL in Smad2-CNS-KO mice was likely comparable with that of control mice despite the significant difference in cerebellum size at P7 (549 ± 30.1 versus 545.3 ± 19.2) (Fig. 6, A, B, and I). Western blot analysis was performed to quantify the protein levels of PCNA and showed no significant difference between PCNA protein levels in the Smad2-CNS-KO and control cerebellum (data not shown). The number of proliferating cells detected by PCNA staining at P12 showed no statistical difference between Smad2-CNS-KO and control mice (151 ± 7.8 versus 148.3 ± 8.6), indicating that the proliferation of GCs in EGL was not affected by the deletion of Smad2 during development of the cerebellum (Fig. 6, C, D, and I). Although the EGL of Smad2-CNS-KO mice showed normal proliferation of GCs, it was thicker than that of control littermates (Fig. 6, E and F). Furthermore, the EGL of Smad2-CNS-KO cerebellum remained to be seen in a few cell layers even at P16, whereas GCs in the EGL of control cerebellum completely migrated into the IGL (Fig. 6, G and H). To evaluate GC maturation, the mRNA levels of GC markers were analyzed. The Gabra2 gene, encoding the α2 subunit, was used as a marker for immature granule cells, and the Gabrd and Gabra6 genes, encoding GABA receptor δ and GABA receptor α6 subunits, respectively, were used as markers for mature cerebellar granule cells (33). Semiquantitative RT-PCR analysis clearly indicated that expressions of mature GC markers (Gabra6 and Gabrd) were down-regulated (0.23- and 0.27-fold, respectively) and that of the immature GC marker (Gabr2a) was up-regulated (1.7-fold) (Fig. 6, J and K). Furthermore, to ensure GC maturation, brain sections were stained with an antibody against NeuN, a marker for mature cerebellar granule cells (Fig. 6, L and M) (34, 35). Strong NeuN-positive cells were seen in the IGL of both control and mutant mice (Fig. 6, L and M). Immunohistochemistry of NeuN revealed that at P12 in the Smad2-CNS-KO mice, the NeuN-positive IGL area per cerebellum area was greatly reduced compared with control mice (40.1 ± 1.2% versus 26.7 ± 0.3%) (Fig. 6N). In control mice, only a few granule cells remained at the cerebellar surface (EGL), most of which appeared positive. In contrast, only a weak signal at the deeper margin of the EGL was observed in Smad2-CNS-KO mice (Fig. 6, l and m). We found many NeuN-positive nuclei in the molecular layer (ML) that often had an elongated morphology, typical of GCs migrating through the ML toward their final location in the IGL, in control mice (Fig. 6l). In contrast, fewer NeuN-positive cells were observed in the ML of Smad2-CNS-KO mice. Statistical analysis clearly showed a reduction in the number of migrating cells in the mutant ML (26.3 ± 1.9 versus 7.7 ± 1.2) (Fig. 6O). These results indicate that Smad2 plays a critical role in cerebellar granule cell maturation; Smad2 appears to function as an enhancer of GC migration and maturation in normal cerebellar development. However, we cannot exclude the possibility that Smad2 also plays a role in differentiation of proliferating progenitor cells. Consequently, the lack of Smad2 resulted in delayed differentiation of GC progenitor cells. It was noted that Smad2 is expressed not only in GCs but also in PCs. Because they form synapses with each other via parallel fibers in the ML, we next investigated changes in the morphology of PCs and synapse formation in the ML.
FIGURE 6.
Smad2 is not required for cerebellar granule cell proliferation but is required for maturation and migration. A–D, immunodetection of PCNA is shown in sagittal cerebellar sections of P7 and P12 mice. PCNA labeling shows the presence of similar proliferating cell numbers in the EGL in both control and Smad2-CNS-KO mice. E and F, H&E staining of P12 sections shows the EGL is three to four cell layers thick in control mice, and six to eight cell layers thick in mutants. G and H, at P16, the EGL has been depleted in control mice, but one cell layer is still present in Smad2-CNS-KO mice. Insets, high magnification images taken from areas indicated by rectangles. I, measurement of PCNA-positive cells per inset area in P7 and P12 mice EGL. Values are expressed as the mean ± S.D. per section of five sections per animal, three animals per group. NS, not significant. J, RT-PCR analysis indicating changes in the abundance of GABAR subunits expressed in the control and Smad2-CNS-KO mice. β-Actin was used as an internal control. K, changes in GABAR subunit expression were quantified using ImageJ. Gabra6 and Gabrd were down regulated by 0.23- and 0.27-fold, respectively, whereas Gabr2a was up-regulated by 1.72-fold. Statistical analyses (t test) were carried out by using Microsoft Excel. Error bars indicate S.D. NS, no significant. An asterisk represents p values <0.05. L and M, immunodetection of NeuN is shown in sagittal cerebellar sections of P12 mice. l and m, high magnification images were taken from the areas indicated by rectangles. Arrowheads highlight the spindle-shaped morphology of migrating NeuN-positive cells in the molecular layer. A–H, L, and M (scale bar), 200 μm. Insets (l-m), scale bar, 50 μm. N, the percentage of NeuN-positive cells in the IGL area per cerebellum in P12 mice. O, measurement of the spindle-shaped morphology of migrating NeuN-positive cells per inset area in P12 mice ML. An asterisk represents p values <0.05. Double asterisks represent p values < 0.01. Values are expressed as the mean ± S.D. per section of five sections per animal, three animals per group. Black dashed line indicates division between two lobes. Black bar, control; gray bar, Smad2-CNS-KO mice.
Absence of Smad2 Results in Abnormal PC Dendritogenesis and Decreased Synapse Formation in ML
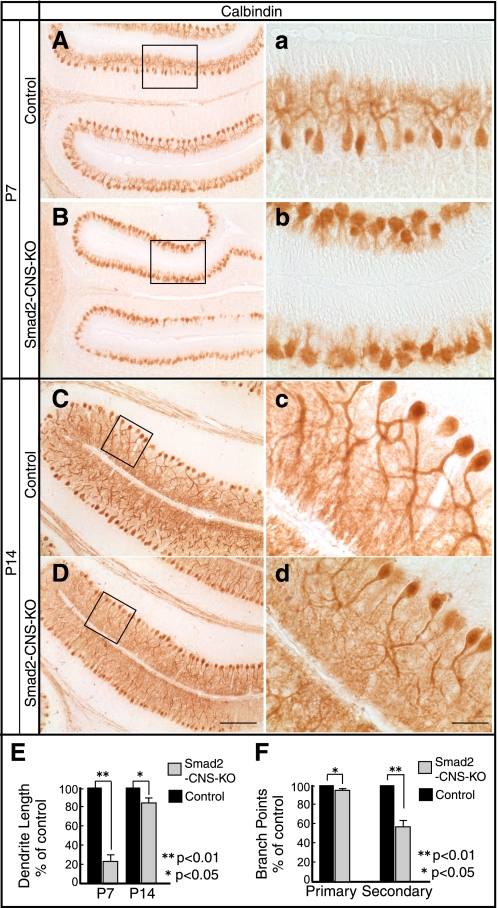
In contrast to granular cells, PCs have already ceased proliferating at birth and extend their dendrites into the molecular cell layer, where they form synapses during P3 to P28 (36, 37). To survey the morphological abnormalities in the Smad2-CNS-KO PCs, brain sections were stained with an antibody against calbindin, a specific marker for PCs. PCs appeared to become organized in an orderly fashion in both Smad2-CNS-KO and control mice at P7 and P14 (Fig. 7, A–D). However, dendritogenesis of PCs was remarkably retarded in Smad2-CNS-KO cerebella at P7 (Fig. 7, a and b), and morphometric analysis revealed a 76 ± 8% reduction in dendritic length. Additionally, the lengths of PC dendrites were almost restored by P14 (100% versus 81 ± 7%) (Fig. 7E), but dendritic arbors appeared less elaborate with fewer branches (Figs. 7, c and d). Dendritic parameters were assessed, and both the primary (100% versus 92 ± 3%) and secondary branch points (100% versus 56 ± 8%) were significantly reduced (Fig. 7F). PCs are the only afferent output cells in the cerebellar cortex and thus may primarily relate to the motor dysfunction of Smad2-CNS-KO mice.
FIGURE 7.
Morphological defects to Purkinje cells in Smad2-CNS-KO mice. A–D, immunohistochemical staining of cerebellar Purkinje cells with anti-calbindin antibody. At P7, stunted Purkinje cell dendrites in Smad2-CNS-KO mice were compared with those of control mice. At P14, Purkinje cell dendritic arbors appeared less elaborate with fewer branches. a–d were taken from the areas indicated by rectangles. A–D (scale bar), 200 μm. a–d (scale bar), 50 μm. E and F, quantitation of total dendritic length (E) and dendritic branch points (F) in control and Smad2-CNS-KO mice Purkinje cells. Three mice from each genotype were analyzed. An asterisk represents p values < 0.05. Double asterisks represents p values < 0.01. Values are expressed as the means ± S.D.
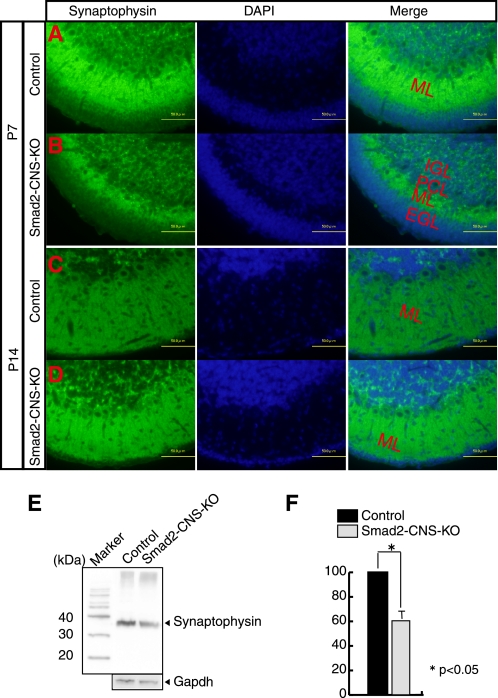
PCs extend their dendrites into the molecular layer where they synapse with parallel fibers and climbing fibers from GCs and inferior olivary nucleus cells, respectively. PC dendritic differentiation is impaired in Smad2-CNS-KO mice, which in turn affects synapse formation. Consequently, although fluorescent labeling of a synaptic marker, synaptophysin, indicated that Smad2-CNS-KO PCs could form synapses in the ML at P7 (Fig. 8, A and B) and P14 (Fig. 8, C and D), Western blot analysis for synaptophysin showed a dramatically lower synaptophysin intensity in Smad2-CNS-KO (38.6 ± 9%) mice than control mice cerebella at P7 (Fig. 8, E and F).
FIGURE 8.
Reduced synaptic density in Smad2-CNS-KO mice. A–D, staining for the presynaptic protein, synaptophysin, and DAPI were performed on P7 and P14 cerebellar sections. Fluorescent labeling for synaptophysin represents colocalization of presynaptic terminals along the Purkinje cell dendrites. Scale bar, 50 μm. E, a representative Western blot of P7 cerebella lysates probed with synaptophysin antibody (upper panel). GAPDH was used as an internal control (lower panel). F, quantitation of synaptophysin expression levels on P7 mice was performed. Error bars indicate S.D. An asterisk represents p values < 0.05.
DISCUSSION
The present study addresses the functional role of Smad2 in the CNS in vivo. Smad2-CNS-KO mice exhibited behavioral abnormalities in motor coordination from an early postnatal stage and mortality at approximately 3 weeks of age. Histological analyses clearly demonstrated an apparent reduction in size and an impaired foliation pattern in the cerebellum of Smad2-CNS-KO mice. Moreover, a further investigation revealed increased apoptotic cell death, defects in granule cell maturation, migration, abnormal PC dendritogenesis, and decreased synapse formation in the cerebellum. It should be noted that lobule X has been shown to have a profound functional connection with the vestibular system that controls equilibrium, upright stance, and gait (37). Ataxic behaviors, such as loss of balance and coordination of voluntary movement, often with disturbances in posture and gait as observed in Smad2-CNS-KO mice, are characteristic of cerebellar dysfunction (38). However, abnormal behaviors are also compatible with defects in various other systems such as the proprioceptive and vestibular system (39). Therefore, we cannot completely exclude the possibility that the abnormalities in behavior are cerebral in origin. Nonetheless, our results demonstrate that Smad2 has a critical role in cerebellar development and function. Further studies are required to elucidate whether Smad2 contributes cell autonomously in the cerebellum to those behaviors.
In addition to the ataxic behavior, Smad2-CNS-KO mice showed mortality at approximately 3 weeks of age. The precise mechanisms of the mortality in Smad2-CNS-KO mice are unclear. As shown in Fig. 3A, Smad2 expression was widely observed in both the cerebellum and cerebrum at E18.5. In addition, increased apoptotic cell death was found in the neocortex as well as the cerebellum in Smad2-CNS-KO mice (Fig. 5D). These results indicated that Smad2 has a neuroprotective role in the cerebrum and cerebellum, which may, in part, explain the mortality of Smad2-CNS-KO mice.
In the CNS, TGF-βs are distributed widely during development (40), having neuroprotective and neurotrophic functions as well as regulating neuronal differentiation (1, 41, 42). Mice lacking TGF-β1 show increased numbers of apoptotic neurons in the brain (29), reminiscent of Smad2-CNS-KO mice. Thus, it is conceivable that TGF-β1 signals exert neuroprotective function through Smad2 in the brain. It has been demonstrated that liver X receptor agonist treatment promotes the migration of granule neurons during cerebellar development, which is related to decreased levels of TGF-β1 and Smad4 in the cerebellum (43). Considering our findings that Smad2 is required for EGL cell maturation and migration, it is possible that Smad2 also functions downstream of TGF-β1 in the cerebellum. Other TGF-β ligands, such as TGF-β2, are expressed predominantly in the proliferating and postmitotic GCs, PCs, and radial glia cells (40, 44, 45), whereas TGF-β3 is widely expressed in the developing cerebellum at very low levels (45). Whether Smad2 functions as a downstream effecter molecule to TGF-β2 and/or TGF-β3 may also warrant further studies.
Smad2 is generally believed to associate with Smad4 in response to TGF-β. Mutant mice lacking Smad4 in the CNS resulted in a marked decrease in the number of cerebellar PCs and parvalbumin-positive interneurons, which revealed an important role for Smad4 in cerebellar development. In contrast to the Smad2 mutant mice described in this study, Smad4 mutant mice are viable and show no obvious deficits in size or foliation of the cerebellar cortex (46). There are several possible explanations for the apparent discrepancy between the phenotypes of Smad2 and Smad4 mutant mice. One is that the deletion of Smad4 was incomplete, whereas expression of Smad2-FL and Smad2-Δe3 isoforms were almost completely eliminated in the brains of Smad2 mutant mice (Fig. 1A). Low levels of Smad4 may be sufficient for certain Smad4 function (46). Alternatively, Smad2-Δe3 may have a role in cerebellar and cerebral development independent of Smad4. The Smad2-Δe3 isoform has been shown to be predominantly expressed in developing brains and to predominate in the nuclear fraction of neurons (7). It is noteworthy that the expression of Smad2-Δe3 is higher in the cerebellum than in the cerebrum (Fig. 1A), explaining the cerebellar phenotypes in mutant mice. The third possibility is that the lack of Smad2 may lead to an alteration of the microRNA system. MicroRNAs are 21- to 25-nucleotide-long small regulatory RNAs that participate in the spatiotemporal regulation of gene expression. Recently, R-Smad proteins have been reported to control drosha-mediated microRNA maturation (47). Interestingly, this novel function of Smads requires an MH1 region where mRNA binding occurs and is independent of Smad4 (47). Whether the Smad2 and/or Smad2-Δe3 participates in neuronal development through regulation of microRNA is therefore of great interest and warrants further investigation.
In conclusion, we have clarified the important role of Smad2 in cerebellar development and function. Elucidating the comprehensive role of Smad2 will help provide a novel tool for future treatment of cerebellar ataxia.
Supplementary Material
Acknowledgments
We thank Yuriko Hamaguchi and Akiko Nakano for technical assistance.
This work was supported in part by a grant-in-aid for Scientific Research from the Ministry of Education, Science, Sports, and Culture (Japan).

The on-line version of this article (available at http://www.jbc.org) contains supplemental Movies 1 and 2.
- GC
- granule cell
- PC
- Purkinje cell
- PCNA
- proliferating cell nuclear antigen
- E18
- embryonic day 18
- P7
- postnatal day 7
- EGL
- external granule cell layer
- IGL
- internal granule cell layer
- ML
- molecular layer
- R
- reverse
- F
- forward.
REFERENCES
- 1. Böttner M., Krieglstein K., Unsicker K. (2000) J. Neurochem. 75, 2227–2240 [DOI] [PubMed] [Google Scholar]
- 2. Brown K. A., Pietenpol J. A., Moses H. L. (2007) J. Cell. Biochem. 101, 9–33 [DOI] [PubMed] [Google Scholar]
- 3. Massagué J. (1998) Annu. Rev. Biochem. 67, 753–791 [DOI] [PubMed] [Google Scholar]
- 4. Shi Y., Massagué J. (2003) Cell 113, 685–700 [DOI] [PubMed] [Google Scholar]
- 5. Yagi K., Goto D., Hamamoto T., Takenoshita S., Kato M., Miyazono K. (1999) J. Biol. Chem. 274, 703–709 [DOI] [PubMed] [Google Scholar]
- 6. Dunn N. R., Koonce C. H., Anderson D. C., Islam A., Bikoff E. K., Robertson E. J. (2005) Genes Dev. 19, 152–163 [DOI] [PMC free article] [PubMed] [Google Scholar]
- 7. Ueberham U., Lange P., Ueberham E., Brückner M. K., Hartlage-Rübsamen M., Pannicke T., Rohn S., Cross M., Arendt T. (2009) Int. J. Dev. Neurosci. 27, 501–510 [DOI] [PubMed] [Google Scholar]
- 8. Ueberham U., Ueberham E., Gruschka H., Arendt T. (2006) Eur. J. Neurosci. 24, 2327–2334 [DOI] [PubMed] [Google Scholar]
- 9. Luo J., Lin A. H., Masliah E., Wyss-Coray T. (2006) Proc. Natl. Acad. Sci. U.S.A. 103, 18326–18331 [DOI] [PMC free article] [PubMed] [Google Scholar]
- 10. Stegmüller J., Huynh M. A., Yuan Z., Konishi Y., Bonni A. (2008) J. Neurosci. 28, 1961–1969 [DOI] [PMC free article] [PubMed] [Google Scholar]
- 11. Lu J., Wu Y., Sousa N., Almeida O. F. (2005) Development 132, 3231–3242 [DOI] [PubMed] [Google Scholar]
- 12. Lee H. G., Ueda M., Zhu X., Perry G., Smith M. A. (2006) J. Neurosci. Res. 84, 1856–1861 [DOI] [PubMed] [Google Scholar]
- 13. Chalmers K. A., Love S. (2007) J. Neuropathol. Exp. Neurol. 66, 158–167 [DOI] [PubMed] [Google Scholar]
- 14. Chalmers K. A., Love S. (2007) J. Neuropathol. Exp. Neurol. 66, 1019–1026 [DOI] [PubMed] [Google Scholar]
- 15. Weinstein M., Yang X., Deng C. (2000) Cytokine Growth Factor Rev. 11, 49–58 [DOI] [PubMed] [Google Scholar]
- 16. Weinstein M., Yang X., Li C., Xu X., Gotay J., Deng C. X. (1998) Proc. Natl. Acad. Sci. U.S.A. 95, 9378–9383 [DOI] [PMC free article] [PubMed] [Google Scholar]
- 17. Nomura M., Li E. (1998) Nature 393, 786–790 [DOI] [PubMed] [Google Scholar]
- 18. Waldrip W. R., Bikoff E. K., Hoodless P. A., Wrana J. L., Robertson E. J. (1998) Cell 92, 797–808 [DOI] [PubMed] [Google Scholar]
- 19. Heyer J., Escalante-Alcalde D., Lia M., Boettinger E., Edelmann W., Stewart C. L., Kucherlapati R. (1999) Proc. Natl. Acad. Sci. U.S.A. 96, 12595–12600 [DOI] [PMC free article] [PubMed] [Google Scholar]
- 20. Simon D., Seznec H., Gansmuller A., Carelle N., Weber P., Metzger D., Rustin P., Koenig M., Puccio H. (2004) J. Neurosci. 24, 1987–1995 [DOI] [PMC free article] [PubMed] [Google Scholar]
- 21. Clark H. B., Burright E. N., Yunis W. S., Larson S., Wilcox C., Hartman B., Matilla A., Zoghbi H. Y., Orr H. T. (1997) J. Neurosci. 17, 7385–7395 [DOI] [PMC free article] [PubMed] [Google Scholar]
- 22. Oliver P. L., Keays D. A., Davies K. E. (2007) Behav. Brain Res. 181, 239–247 [DOI] [PubMed] [Google Scholar]
- 23. Sholl D. A. (1953) J. Anat. 87, 387–406 [PMC free article] [PubMed] [Google Scholar]
- 24. Tanaka M., Marunouchi T. (2005) Neurosci. Lett. 390, 182–186 [DOI] [PubMed] [Google Scholar]
- 25. Goldowitz D., Hamre K. (1998) Trends Neurosci. 21, 375–382 [DOI] [PubMed] [Google Scholar]
- 26. Altman J. (1972) J. Comp. Neurol. 145, 399–463 [DOI] [PubMed] [Google Scholar]
- 27. Altman J., Bayer S. A. (1990) J. Comp. Neurol. 301, 365–381 [DOI] [PubMed] [Google Scholar]
- 28. Schlessinger A. R., Cowan W. M., Gottlieb D. I. (1975) J. Comp. Neurol. 159, 149–175 [DOI] [PubMed] [Google Scholar]
- 29. Brionne T. C., Tesseur I., Masliah E., Wyss-Coray T. (2003) Neuron 40, 1133–1145 [DOI] [PubMed] [Google Scholar]
- 30. Elvers M., Pfeiffer J., Kaltschmidt C., Kaltschmidt B. (2005) Mech. Dev. 122, 587–602 [DOI] [PubMed] [Google Scholar]
- 31. Toru-Delbauffe D., Baghdassarian-Chalaye D., Gavaret J. M., Courtin F., Pomerance M., Pierre M. (1990) J. Neurochem. 54, 1056–1061 [DOI] [PubMed] [Google Scholar]
- 32. Labourdette G., Janet T., Laeng P., Perraud F., Lawrence D., Pettmann B. (1990) J. Cell. Physiol. 144, 473–484 [DOI] [PubMed] [Google Scholar]
- 33. Takayama C., Inoue Y. (2004) Brain Res Dev Brain Res. 148, 169–177 [DOI] [PubMed] [Google Scholar]
- 34. Mullen R. J., Buck C. R., Smith A. M. (1992) Development 116, 201–211 [DOI] [PubMed] [Google Scholar]
- 35. Weyer A., Schilling K. (2003) J. Neurosci. Res. 73, 400–409 [DOI] [PubMed] [Google Scholar]
- 36. Hatten M. E., Heintz N. (1995) Annu. Rev. Neurosci. 18, 385–408 [DOI] [PubMed] [Google Scholar]
- 37. Voogd J., Glickstein M. (1998) Trends Neurosci. 21, 370–375 [DOI] [PubMed] [Google Scholar]
- 38. Taroni F., DiDonato S. (2004) Nat. Rev. Neurosci. 5, 641–655 [DOI] [PubMed] [Google Scholar]
- 39. Rubino F. A. (2002) Neurologist 8, 254–262 [DOI] [PubMed] [Google Scholar]
- 40. Flanders K. C., Lüdecke G., Engels S., Cissel D. S., Roberts A. B., Kondaiah P., Lafyatis R., Sporn M. B., Unsicker K. (1991) Development 113, 183–191 [DOI] [PubMed] [Google Scholar]
- 41. Abe K., Chu P. J., Ishihara A., Saito H. (1996) Brain Res. 723, 206–209 [DOI] [PubMed] [Google Scholar]
- 42. Cameron H. A., Hazel T. G., McKay R. D. (1998) J. Neurobiol. 36, 287–306 [PubMed] [Google Scholar]
- 43. Xing Y., Fan X., Ying D. (2010) J. Neurochem. 115, 1486–1494 [DOI] [PubMed] [Google Scholar]
- 44. Constam D. B., Schmid P., Aguzzi A., Schachner M., Fontana A. (1994) Eur. J. Neurosci. 6, 766–778 [DOI] [PubMed] [Google Scholar]
- 45. Unsicker K., Strelau J. (2000) Eur. J. Biochem. 267, 6972–6975 [DOI] [PubMed] [Google Scholar]
- 46. Zhou Y. X., Zhao M., Li D., Shimazu K., Sakata K., Deng C. X., Lu B. (2003) J. Biol. Chem. 278, 42313–42320 [DOI] [PubMed] [Google Scholar]
- 47. Davis B. N., Hilyard A. C., Lagna G., Hata A. (2008) Nature 454, 56–61 [DOI] [PMC free article] [PubMed] [Google Scholar]
Associated Data
This section collects any data citations, data availability statements, or supplementary materials included in this article.


