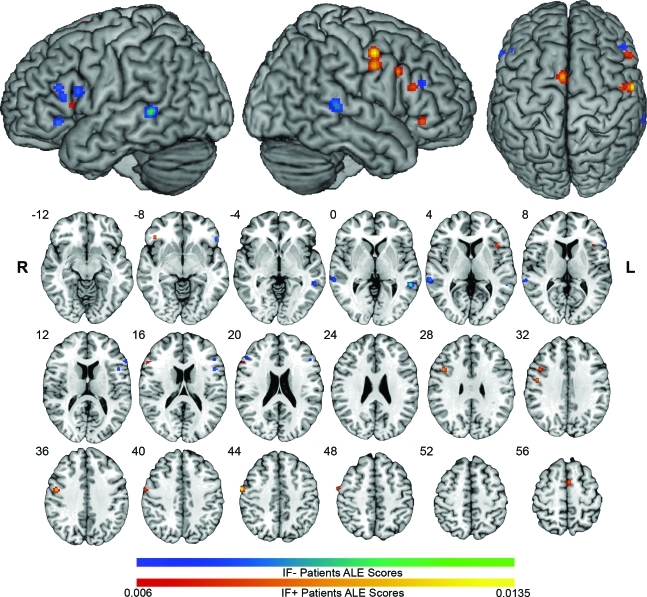
Figure 2. Activation likelihood estimation (ALE) maps of inferior frontal cortex (IF)+ and IF− groups.
IF− ALE clusters are in blue-green scale. IF+ ALE clusters are in red-yellow scale. ALE maps are overlaid on the standard Colin brain in Montreal Neurological Institute (MNI) space, using a false discovery rate q = 0.01 critical threshold, and minimum cluster size of 100 mm3. Slices are in radiologic orientation, with the corresponding MNI Z coordinate.

