Abstract
A forward-view optical coherence tomography (OCT) scanning catheter has been developed based on a fiber-cantilever piezotube scanner by using a semi-resonant scan strategy for a better scan performance. A compact endoscope catheter was fabricated by using a tubular piezoelectric actuator with quartered electrodes in combination with a resonant fiber cantilever. A cantilever weight was attached to the fiber cantilever to reduce the resonance frequency down to 63 Hz, well in the desirable range for Fourier-domain OCT. The resonant-cantilever scanner was driven at semi-resonance frequencies that were well out of the resonance peak but within a range of partial resonance. This driving strategy has been found to minimize the phase difference between the two scan axes for a better scan stability against environmental perturbations as well as for a driving simplicity. By driving the two axes at slightly different frequencies, a low-order Lissajous pattern has been obtained for a 2D area scan. 3D OCT images have been successfully acquired in an acquisition time of 1.56 seconds for a tomogram volume of 2.2 × 2.2 × 2.1 mm3. They were reconstructed without any scan calibration by extracting the scan timing from the image data. In addition, it has been found that the Lissajous scan strategy provides a means to compensate the relative axial motion of a sample for a correct imaged morphology.
OCIS codes: (110.4500) Optical coherence tomography, (170.4500) Optical coherence tomography, (170.2150) Endoscopic imaging, (170.3880) Medical and biological imaging, (120.5800) Scanners
1. Introduction
Optical coherence tomography (OCT) endoscopy is a powerful optical imaging modality useful for various areas of biomedical applications [1–11]. The imaging range of OCT is effectively extended by a compact endoscope catheter that is sent deep into a specimen to acquire high-resolution information for medical diagnosis. A circumferential-scan endoscope probe is one of the most well-established technologies for those applications. It provides proximal side-view images defined in cylindrical 2-dimensional (2D) or 3D spaces by using either an external rotator or an internal micro-motor [1,2]. Besides the rotational scan, the axial displacement is easily added by drawing the catheter back and forth to acquire 3D OCT images. On the other hand, some applications demand other types of scan methods. Particularly, a distal area scan of forward-view OCT imaging has drawn a great deal of attention [1]. A forward-view scanner usually needs an internal beam scanner for multi-dimensional imaging applications, which are difficult to miniaturize inside a compact catheter. Some groups have developed miniaturized beam scanners for the OCT endoscopy based on the micro-electromechanical systems (MEMS) technology [3–6]. But such a MEMS 2D beam deflector based on a beam-tilting mirror tends to occupy a relatively large volume for a forward-view scan. Others have developed beam scanners based on fiber cantilevers in which the focus is scanned directly by the in-plane motion of a fiber’s distal end [7–11]. In this case, it is important to obtain a large scan amplitude required for the application while keeping the size of the actuator small. One can take advantage of the mechanical resonance that amplifies the swing amplitude by using a resonant fiber cantilever.
Among various types of forward-view imaging OCT catheters, a resonant-cantilever piezotube scanner has many attractive features [8,12–15]. In this design, a fiber cantilever is resonantly oscillated by a quartered piezotube actuator which is made from a compact monolithic PZT (lead zirconate titanate) tube. In spite of the inherently small displacement of such a small PZT actuator (a few micrometers at best), a large scan amplitude can be obtained by the resonant oscillation of the fiber cantilever. A 2D scan can be achieved by modulating the amplitude of the two pairs of actuation signals combined with the 2D resonant oscillation. A spiral scan strategy has been used to obtain 3D OCT tomograms, which is obtained by an amplitude modulation. A circular scan pattern of the fiber end sweeps the area with a varying radius in this scan strategy. The piezotube actuator used for this is relatively compact (<10 mm3) and has a cylindrical geometry, which is compatible with the typical cylindrical shape of a catheter. It can be easily assembled in a simple and robust configuration in a miniaturized OCT catheter.
The scan frequency of the fiber cantilever is determined by its resonance frequency (natural frequency) which is tuned by the properties of the cantilever fiber [8,14,15]. The resonance frequency gets lower as the length of the fiber cantilever increases. But the resonance frequency obtainable with a compact cantilever is still far higher than the desired range of the scan frequency [15]. It needs to be well below 100 Hz for the typical high-speed spectral-domain OCT (SD-OCT) or swept-source OCT (SS-OCT) systems where the A-line rate is usually below 100,000 lines per second. The first OCT demonstration of the fiber-cantilever piezotube scanner was performed with a time-domain OCT (TD-OCT) system at a kilohertz resonance frequency (2.8 kHz in [8]) for this reason, which scans a sample with the lateral-priority 3D scan strategy. This approach is not applicable to Fourier-domain OCT (SD-OCT and SS-OCT) which must first acquire depth-resolved A-lines. Further elongation of the fiber cantilever is disadvantageous in terms of compactness. For example, a resonance frequency of 60 Hz is obtained when the length of the cantilever fiber (fused silica) with a standard diameter of 125 μm exceeds 40 mm. This is unacceptably long to make a compact endoscope catheter. In an alternative way, the frequency can be reduced by increasing the mass of the oscillating body or by putting a weight at the end of the cantilever [15]. However, we have observed that the scan characteristic of the weighted fiber cantilever is vulnerable to environmental changes. In addition, the scan characteristic is more complex compared with other types of resonant scanners due to its nonlinearity [12,13]. The possible instability of the scan pattern may make the acquired OCT images distorted with deformed image morphology particularly in the en face views. A linear structure of the sample may appear in a severely curved geometry [13,14]. Moreover, the spiral scan strategy is not well suited for samples of relative movements. The problem is caused by the fact that the central scan area tends to be over-sampled for the conventional spiral scan. In other words, the area scan consumes an excessively long time for OCT data acquisitions for certain parts of the images. In real-world applications, a relative sample motion of a few hundred micrometers per second may be regarded as typical. If a small transverse area is acquired for a long time (e.g. >0.1 s for 100 × 100 μm2), the obtained images will likely suffer from motion blur and discontinuity deformation. In the case of the spiral scan, this effect must be the most significant at the central part of the scan area because the longest time is spent for that part. This very area is typically located over the most important part of observation.
It has been long believed that there are only two options in selecting an actuation mode to obtain a 2D area scan: resonant and non-resonant scans. The non-resonant actuation is preferred due to its wider freedom of operation, especially for the capability of the simple but nearly ideal raster 2D scan that requires a far different scan frequency for each axis. The resonant actuation is commonly considered when the actuation power is below the demanded level, e.g. because of a high operation frequency or the small size of the actuator. The mechanical resonance provides an amplitude gain that magnifies the displacement at the sacrifice of the driving frequency range. Some other disadvantages may be found for the resonant-mode scanner. The resonance characteristic is prone to be influenced by the change of the boundary condition of the resonator, i.e. the change of the environment. Furthermore, if the 2D resonator is nearly symmetric in its structure, there is no chance to select distinguished driving frequencies for the two axes for a better area scan strategy. This is a dilemma that the resonant-cantilever tubular PZT scanner faces in practice. The resonant-mode operation constrains the scanner to exhibit such disadvantageous features that make it less attractive for many endoscopic applications. To avoid this problem, we may develop an intermediate alternative between the resonant and the non-resonant. A so-called semi-resonant operation mode may alleviate the problems encountered with the fully resonant operation of the resonant-cantilever scanner.
In this report, we have investigated various properties of the weighted fiber cantilever scanner mounted on a piezotube actuator focusing on the scanning mode. It has been experimentally observed that the weighted fiber cantilever exhibits a significant environmental sensitivity as a result of the resonance quality increased by the added oscillation mass. This has necessitated the development of a different scan strategy which optimizes the developed scanning device so that it can be used in a harsh imaging condition. We present a new scan method of semi-resonant Lissajous scan, by which a scanner is operated at a frequency preferably far from the resonance peak but still partially keeping a resonance gain. At a semi-resonance frequency we may have a higher degree of freedom in selecting the driving frequency. And the environmental perturbation rarely changes the scan pattern as well. In this method, it is unnecessary to make the cantilever asymmetric on purpose to take advantage of the Lissajous scan. For a high-quality resonator, we may have enough of a frequency margin to detune the frequency in spite of the nearly symmetric structure. In this research, we have successfully demonstrated various advantages of our scan method by acquiring high-quality OCT images with enhanced stability, motion tolerance and the simplicity of no scan calibration. This result can be generalized to other types of resonant scanners. Any resonant scanner, in principle, can be operated in the semi-resonance regime utilizing the Lissajous scan when there are problems of environment sensitivity or scan nonlinearity.
2. Fabrication and characterization of the resonant-cantilever scanner
An OCT endoscope catheter was fabricated by using a weighted fiber cantilever mounted on a tubular PZT actuator. Figure 1 shows the schematic design and the picture of the fabricated OCT catheter head. The dimensions are given in millimeters in the schematic. The piezoelectric actuator was made of a monolithic PZT tube with four equally divided electrodes on the surface. This tubular PZT actuator held a bare single-mode fiber that forms a scanning fiber cantilever. Each pair of the quadrant electrodes was connected to a high-voltage PZT driver with a safety 100-kΩ resistor in series. Because of the high impedance of the PZT actuator at a low frequency, the signal current was very low (<<1 mA) for our case. Applying a periodic voltage signal made the actuator vibrate in each direction of the applied electric field. This mechanical vibration was delivered to the fiber cantilever while the other end of the PZT tube was fixed by the base structure. A small piece of steel tube was put at the end of the fiber cantilever as a cantilever weight to increase the effective mass of the oscillating body. This cantilever weight decreased the resonance frequency while keeping the cantilever short enough for a compact endoscope catheter. An angle of ~8 degrees was given to the fiber’s cleaved surface to suppress the back-reflection. Finally, a GRIN lens was equipped to focus the light from the fiber end. The light was focused at the imaging plane with a working distance of 6.3 mm (magnification of 2.24), which was measured by a silicon CCD camera at a wavelength of 1,060 nm. The corresponding transverse resolution (1/e2 intensity) was estimated to be 18 μm at a wavelength of 1,310 nm. For the fabricated catheter, the full length of the rigid part was 31 mm and the diameter was 2.4 mm. The catheter was initially shielded by a glass tube. Since the glass tube might be too weak for a final housing, the catheter head was finished by putting a protective metal tube on it for its actual usage. The final diameter of the head was measured to be 3.2 mm. The mass of the cantilever weight (steel) was 4.0 mg while the mass of the 17-mm long fiber section before attaching the weight was estimated to be 0.51 mg from the density of silica, 2.6 mg/mm3. Thus, the mass of a moving part had been increased roughly by one order of magnitude.
Fig. 1.
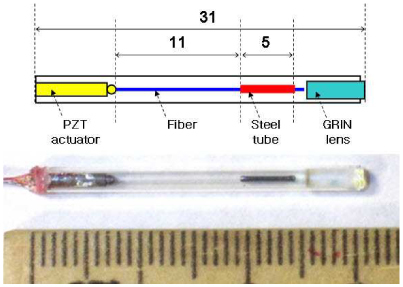
Schematic design and picture of the fabricated OCT scanning catheter. The dimensions are given in millimeters.
The resonance characteristics of amplitude transfer (voltage to swing amplitude) were measured for the two scan axes by evaluating the amplitudes of mechanical oscillation as a function of driving frequency. The oscillation amplitude was measured by taking an image of the oscillating pattern at the focal plane with a silicon CCD camera when the fiber end shined light at 1,060 nm. This wavelength was chosen because it is the longest wavelength band where our silicon camera can sense light. Due to the small difference of refractive indices of glass between 1,060 nm and 1,310 nm, we may neglect the chromatic aberration effect in determining the working distance and the oscillation amplitude. Figure 2 shows the measured resonance characteristic of the fabricated fiber cantilever for the two driving axes in the vicinity of their lowest resonance peaks. The vertical axis of the full oscillation amplitude (peak-to-peak) is normalized by the root-mean-square (r.m.s.) voltage of the electric driving signal. As seen in the figure, each oscillation axis exhibits a sharp resonance with a distinct peak. Its bandwidth of full width at half maximum (FWHM) was estimated to be 0.4 Hz. The fractional bandwidth was only 0.6%, which suggests a high quality factor of the resonator. A small difference of 0.1 Hz was found between the two resonance frequencies. The X-axis resonance frequency was 63.43 Hz at the peak and that of the Y axis was 63.33 Hz, respectively. This difference was caused by slightly asymmetric alignments of the nearly symmetric components. Note that the frequency difference was only 0.16% (0.1 Hz /63 Hz) and did not exceed the level of asymmetry as expected. It is extremely challenging to eliminate this asymmetry completely for a zero frequency difference. Unfortunately, this uncontrollable asymmetry cannot be neglected for a 2D scan as it results in different amplitude and phase responses along the two axes. This makes the driving of the cantilever more complex especially for a weighted fiber cantilever.
Fig. 2.
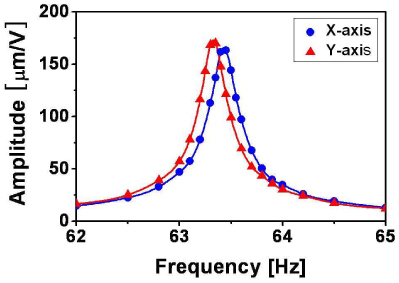
Measured resonance transfer function of the fabricated fiber cantilever mounted on a piezotube actuator for the two driving axes (X and Y) in the vicinity of their lowest resonance peaks. Solid lines are obtained by spline interpolation.
The addition of the cantilever weight made the asymmetric resonance properties more visible as it decreased the bandwidth of the resonance. In a simple mechanical model of a driven harmonic oscillator [16], the FWHM of the resonance peak is determined by the quality factor (Q-factor) of the resonator, which exhibits how well the resonator stores its mechanical energy inside. The Q-factor can be measured roughly by a ratio of the resonance frequency to its bandwidth. The Q-factor (Q) is proportional to the square root of the oscillating mass, m, which is multiplied by the spring constant, k: Q ∝ (m⋅k)1/2. Decreasing the resonance frequency by adding a cantilever weight (increasing m) automatically increases Q and reduces the fractional bandwidth of the resonance. In this experiment, we have observed that the oscillation amplitude is more than two times higher for the weighted cantilever compared with the amplitude obtained without the cantilever weight. A high Q-factor may be preferred as it allows us to take advantage of an enhanced amplitude for a given driving voltage. However, the frequency difference between the two axes becomes more visible as the resonance peak gets sharper.
When this mechanical oscillator is driven by a force of sin(2πft), the displacement x in time t is given by
| (1) |
where f is the driving frequency. Here, Ax(f) is the frequency-dependent amplitude gain along the X axis, and φx is the phase shift. φx is given as a function of frequency f. In the other axis of Y, the displacement y(t) is also given in the same form of Eq. (1) with a different amplitude of Ay and a different phase shift of φy. Like other types of simple resonators, this mechanical oscillator has a monotonically increasing function of phase shift. The halfway of the phase shift roughly corresponds to the peak of the resonance with φx = 0. Meanwhile, the phase shift converges to ± π/2 as the frequency tuned away from the resonance peak. The phase shift function gets stiffer and more abrupt as the Q-factor increases. Therefore, a small change of the driving frequency results in a large difference in phase shift for a high-Q oscillator. The different responses found for the two axes in Fig. 2 imply that the two axes have different phase shifts around the resonance frequencies. The phase difference, Δφ (f) ≡ φx −φy, determines the shape of the scan pattern that the fiber cantilever generates, [x(t), y(t)] in the imaging plane for a given set of driving signals.
This characteristic of the phase difference was confirmed by taking the scan pattern for our fabricated scanning catheter. Figure 3 shows the measured scan patterns of the fabricated fiber cantilever for various frequencies when X and Y axes were driven by sinusoidal voltage signals of the same amplitude and phase. A dotted orange line of the same angle and length was added to each image for comparison. The ellipticity found around the resonance frequency (63.3 and 63.4 Hz) came from the phase difference of our weighted fiber cantilever. It became negligible for f≤62.8 Hz or f ≥63.9 Hz at which the driving frequency was sufficiently out of the resonance peak by >0.5 Hz. There, the phase shifts commonly became zero for the two axes and the difference converged to zero (Δφ ≈0). A nearly linear scan pattern has been observed at those frequencies. In this report, it is called full-resonance or fully resonant when the driving frequency is well within the FWHM of the resonance peak. On the other hand, it is called semi-resonance or partially resonant when the frequency is so far from the exact resonance frequency that the scan pattern generated by in-phase driving signals can be described as a line with a negligible phase difference. In a linear system analysis, the complex transfer function (amplitude and phase) provides the full information set on the resonator’s characteristic. One can compensate or control the scan pattern as wanted by using this knowledge of the linear system. However, this simplified linear-system analysis does not guarantee the scanner’s performance for two reasons: first, the system response may vary in the influence of possible external perturbations. Second, this kind of oscillator exhibits a significant nonlinear characteristic that does not allow us to get a linear-system calibration of the scan pattern in an exact manner.
Fig. 3.
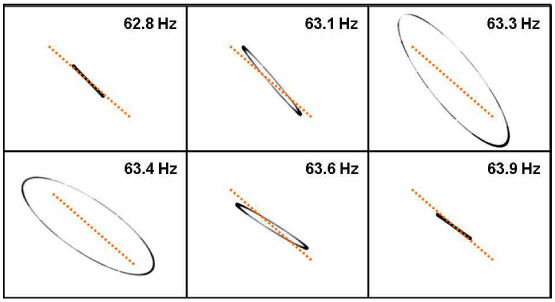
Captured scan patterns of the fabricated fiber cantilever at various driving frequencies when X and Y axes were driven by electric driving signals of the same amplitude and phase. The dotted orange lines are added for comparison.
3. Scan stability and nonlinearity of the weighted fiber cantilever
The environment dependence of the scan pattern has been investigated experimentally in this section. It has been found that its effect is only significant at a full-resonance frequency where the phase is given exclusively as a nearly abrupt function of frequency. Note that adding the cantilever weight for the sake of a decreased operation frequency resulted in an increased Q-factor. This made the phase transfer varying rapidly around the resonance peak. Thus, the system response was more sensitive to the change of the oscillation condition. In a theoretical description, the environmental perturbation is expressed as an uncontrollable change of the boundary condition for an oscillator. The base structure in practice does not provide a firm boundary to the cantilever but rather oscillates together with the moving body. This effect makes the oscillator a complex problem of two moving bodies. This is particularly a serious concern when the mass of the oscillating body is not negligibly smaller than that of the base structure. Our probe has a gross mass of 1.4 g while that of the oscillating body is 4.5 mg with the cantilever weight. The mass ratio is only 310 while it was 2,700 before attaching a cantilever weight. It explains why this effect has not been observed for a simple fiber cantilever as a serious problem. After all, the resonance characteristics depend on how well the base structure is fixed to the ground. If an asymmetric holding force was applied to it, the resonance characteristics would vary differently for respective axes.
The environmental dependence of the resonant cantilever was tested for our fabricated scanning catheter with a cantilever weight. Figure 4 shows the imaged scan patterns when the catheter body is freely laid (upper row) and pressed in the X-scan axis direction (lower row) for the case of driving it at a full-resonance frequency of 63.3 Hz (two columns in the left) and at an semi-resonance frequency of 62.7 Hz (column in the right), respectively. In this test, the unidirectional force was applied by pressing the catheter body with a weight when it was driven by signals of the same amplitude and phase. The amount of the force was 1 N (0.1 kg force) for this test. It was found that the phase difference, being estimated by the ellipticity, was changed by the unidirectional force when our scanning catheter was driven at a full-resonance frequency. In Fig. 4, the ellipse is different (in both ellipticity and tilt angle) from each counterpart located in the same column for the cases of driving at 63.3 Hz. Furthermore, a small difference is also found between the two scan patterns of the nominally same case of being laid freely. The ellipse was not repeated in exactly the same shape because of the small change of the placing condition, as seen in the two images in the left of the first row of Fig. 4. Note that a higher level of external force can be given to the actual catheter in practice by a protective plastic tubing or a guiding structure bent by a curved channel of a sample. The catheter usually undergoes such an external force possibly under a variation in the real endoscopy application. In contrast, no significant change was observed for the case of the semi-resonance frequency before and after the unidirectional force was given. This suggests a higher immunity against environmental change when the fiber cantilever is driven at a semi-resonance frequency. This can be explained by the inherently small phase difference between the two axes in this operation regime where the driving frequency is out of the fully resonant regime.
Fig. 4.
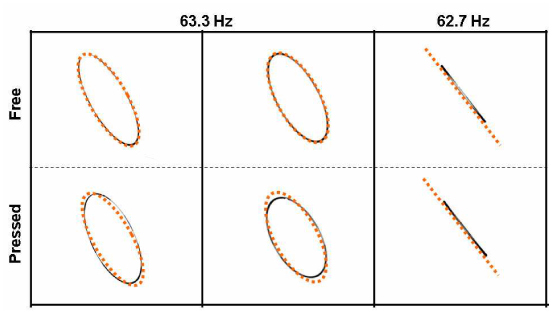
Imaged scan patterns when the catheter body is freely laid (upper row) and pressed in a direction (lower row) for the case of driving it at a full-resonance frequency of 63.3 Hz (two columns in the left) and at an off-resonance frequency of 62.7 Hz (column in the right), respectively. Dotted orange ellipses and a dotted line were added for comparing the two in each column.
Driving the fiber cantilever at a semi-resonance frequency is advantageous in various aspects. It provides a higher scan stability observed in Fig. 4 as well as simplicity of nearly zero phase difference (Δφ≈0). It does not require any phase bias between two driving axes. An obvious disadvantage of this approach is its reduced amplitude gain. In our case, the maximum amplitude obtainable at a semi-resonance frequency is ~1/4 of the peak amplitude at the exact resonance frequency which is, however, acceptable for such a high-Q oscillator. One can take a frequency closer to the resonance peak while accepting a degraded performance if a higher amplitude gain is desired. This semi-resonance operation is also beneficial in its wider operational bandwidth. The sharp resonance peak does not only prevent us from taking a freedom of selecting the driving frequency but also limits the speed of modulation, i.e. the speed of 2D scanning for the case of a modulation-based 2D scan strategy. The semi-resonance operation has relaxed constraints in selecting a driving frequency and operational bandwidth due to the nearly constant characteristics at semi-resonance frequencies.
Another important issue in optimizing a scan strategy for the weighted fiber cantilever is its nonlinear response. As the amplitude gets higher, this type of oscillator tends to exhibit a nonlinear response [12]. The phase shift may depend on the amplitude in a hysteretic manner. And the amplitude of motion may fluctuate. For the conventional spiral scan strategy [8,12–15], the amplitude-dependent phase variation has been observed as a major factor that severely distorts the scan geometry. This needs to be calibrated carefully in the same operation condition as that of the actual case. Combined with the environmental instability and linear distortion caused by the narrow bandwidth for the high-Q oscillator, this nonlinearity may produce an unacceptable characteristic for an actual endoscope application. It is presumed that driving each axis with a single frequency (namely, without a signal modulation) produces a lesser effect of nonlinearity. For multi-frequency operations, the nonlinear characteristic generates mixing frequency products so that its effect is difficult to predict and control. In contrast, a single-frequency operation generates a stable constant-amplitude motion and provides a nearly linear characteristic for a given amplitude. A 2D scan can be achieved with single frequencies by taking advantage of a low-order Lissajous pattern that sweeps a 2D area. Here, each axis has a slightly different driving frequency maintaining the amplitude constant over the area scan. This type of scan can provide good stability against external perturbation combined with the nonlinearity. More detailed description of this scan strategy will be presented in the next section.
Note that environmental perturbation may include an abrupt motion of the catheter that can excite the resonant cantilever. Our semi-resonant operation scheme does not alleviate this dynamic effect. Once excited by the frequency component of the resonance (63 Hz for our catheter), it may take a few seconds to cease the resonant motion completely]. The decay time of the resonance is roughly estimated by the inverse of the resonance bandwidth so that a high-Q resonator has a relatively long ceasing time. This effect needs to be avoided by careful operation that minimizes abrupt motions when in use. Or, after such a rapid movement, an appropriate stabilization interval needs to be made before an actual image acquisition [15].
4. OCT image reconstruction
OCT images have been obtained by using the fabricated OCT catheter based on a piezotube-actuated weighted fiber cantilever. To minimize the environmental effect and nonlinear phenomena encountered with the weighted fiber cantilever, we have developed a 2D scan strategy different from those used with the fiber cantilever in previous research. Our method of driving the device uses a single-frequency sine signal for each driving axis, which is sufficiently far from the peak resonance frequency. This semi-resonant Lissajous scan provides us with more robust scan characteristics demanded for the practical endoscope applications.
At first, 1D-scan OCT imaging was demonstrated with our fabricated probe to test the basic capability of 2D OCT imaging. In this study, a spectral-domain OCT (SD-OCT) system based on a dispersive grating and a high-speed InGaAs line camera (1,024 pixels) was used to acquire OCT images at the 1.3-μm band. The axial resolution of the OCT system was 11.2 μm in air. Figure 5 shows the raw OCT image (a) and the horizontally re-sampled image (b) of a human finger tip. All the OCT images in this report were displayed on a white background (inverted). The imaged area was 2.1 mm (vertical) × 2.2 mm (horizontal) in full. Only the X driving axis of the scanning catheter was used to acquire this image. The r.m.s. voltage of the applied sine signal was 70 Vrms at a semi-resonance frequency of 62.76 Hz. The A-line rate was 47,000 lines per second. So, a 2D image contained 374 A-lines in the raw data. Because the scan was performed by a sine function of time, the B-scan needed to be re-sampled to get a correct scale along the horizontal direction. A simple linear interpolation was used to calculate the re-sampled A-line data with the timing information of the sinusoidal B-scan. To achieve this, we needed a synchronization signal that contained the timing information of the scan’s start time. Instead of using a timing signal taken from the electric driving signal, we extracted the timing information from the acquired OCT image data directly. As the scan was given as a sinusoidal function, similar A-lines were repeated at the peak of the scan. The A-lines at both edges in Fig. 5 (a) were blurred horizontally for this reason. The first A-line in a 2D image could be determined by an A-line that had the maximum correlation with the adjacent A-lines.
Fig. 5.
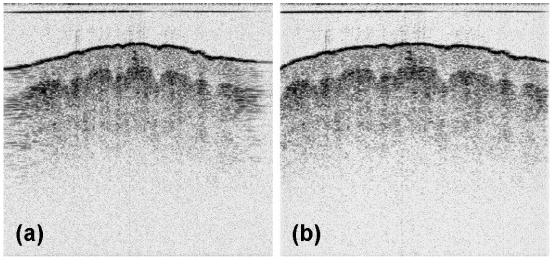
Raw OCT image (a) and the re-sampled image (b) of a human finger tip, given in a white-background display mode. The darkness of a pixel corresponds to the reflectivity scaled in dB.
A 2D scan of the fiber cantilever was obtained by a low-order Lissajous scan in which each axis was driven at a slightly different frequency without any driving signal modulation. Figure 6 shows a schematic Lissajous scan pattern (solid blue lines) in the XY plane laid over an OCT en face image. In this schematic, the Lissajous pattern is illustrated as a sum of four ellipses with step-wise phase increases. A line and a circle are regarded as special types of ellipses in this description. The actual scan pattern of the 2D scan has a continuously increasing phase with an even larger number of open ellipses in series. We may approximate the full curve as a sum of ellipses for simplicity. The frequency difference between the two driving axes determines the shape of the pattern and the temporal period by which the pattern evolves and repeats. The full period of the Lissajous pattern evolution is given by TL = 1/|fx−fy| where fx is the operation frequency of the X-scan axis and fy is that of the Y-scan axis. The scan pattern evolves from a line to a circle during the first quarter cycle (TL/4) as shown in the left-hand side of Fig. 6. As seen in the right, it evolves again from the circle to a line perpendicular to the beginning line on the left during the second quarter cycle. And this evolution repeats again in an inverse manner during the following half cycle (TL/2), returning back to the start point denoted by S. A half cycle completes a 2D scan for the full square area. Previous research that utilized the Lissajous scan strategy conventionally used the half cycle as a 2D scan cycle to acquire the full square area. However, it is more economical to take just a quarter cycle that completes a circular scan area, abandoning the two corners of the square that are not scanned in the following quarter cycle. In this research, a quarter Lissajous cycle is regarded as a 2D scan cycle for which a 2D cantilever scan is completed to acquire a 3D OCT tomogram.
Fig. 6.
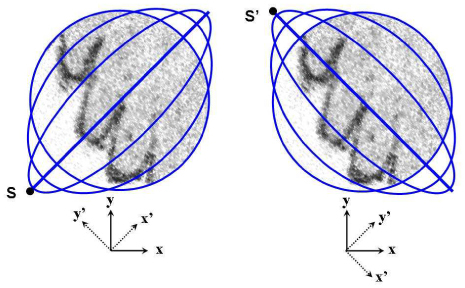
Schematic Lissajous scan pattern (blue lines) in the XY plane laid over an OCT en face image: the first quarter cycle (left) and the second quarter cycle (right).
By modifying the conventional OCT terminology for our case, a 2D scan in the XY plane is said to consist of multiple elliptic B-scans or B-scan ellipses. Each B-scan has the shape of an ellipse or, more accurately, an ellipse-like open curve running by 360 degrees. So, the running B-scan ellipse resembles two scan lines of the raster 2D scan strategy except that it is curved. Especially for the central area of visual importance, our Lissajous scan almost looks like raster scan lines running together in opposite directions. This raster-like feature may give a higher tolerance against a sample motion to our endoscope catheter. In this report, the linear B-scan at the first or the last in a quarter Lissajous cycle is called the primary B-scan of each 2D imaging cycle. As shown in Fig. 6, we define X’ axis as an axis of the primary B-scan, which is tilted by ~45 degrees with respect to the actuator’s X-scan axis. The Y’ axis is defined by the axis perpendicular to the X’ axis.
For the semi-resonant Lissajous scan, the X axis was driven at 62.76 Hz while the Y axis was driven at 62.60 Hz with a driving amplitude of 70 Vrms. The Lissajous period (TL) was 6.25 s and, hence, it took 1.56 s (TL/4) to acquire a 3D tomogram for a quarter Lissajous cycle. The A-line rate was 33.7 kHz, which supports 2 × 269 A-lines per B-scan ellipse in full. Figure 7 shows the raw 2D OCT image of the primary B-scan (a) and that of a B-scan when it was almost circular (b). The sample was a human finger tip. The information of scan timing was extracted from the OCT image data in a similar way as explained above. As clearly seen in Fig. 7 (a), a 2D OCT image of a primary B-scan has inversion (mirror) symmetry because of its linear scan pattern. Thus, the primary B-scan is characterized by nearly the same 2D OCT image found in the other half with the opposite horizontal direction. The axis of this symmetry corresponds to a scan start point denoted by S or S’ in the 2D scan pattern of Fig. 6. This start A-line was searched by the maximum image correlation of the two partial images of the primary B-scan divided by the start A-line in which one of them was inverted horizontally. For simplicity, only 20 horizontal lines, sampled sparsely in A-lines, were used to measure the image correlation in this searching process for a start point. After determining the starting A-line of the first frame, the raw data were re-sampled according to the Lissajous pattern by using a simple linear interpolation.
Fig. 7.

Raw 2D OCT image of the primary B-scan (a) and that of a B-scan ellipse when it was almost circular (b). The sample is a human finger tip.
A 3D tomogram was successfully reconstructed with a timing signal extracted by the image correlations. Figure 8 shows the reconstructed OCT en face images [(a) to (f)], and the 3D-rendered tomograms with different view angles [(g) and (h)]. The imaged volume was a cylinder of diameter 2.2 mm and axial depth 2.1 mm acquired in 1.56 seconds. The image quality was quite comparable to that of the conventional OCT system that uses bulky galvo-mirror scanners. No significant distortion of the sample’s morphology was observed. The channeled morphology of the finger tip surface and the inner dermal layers was imaged as parallel stripes in the en face views. Note that no calibration of the scan pattern was applied to the image reconstruction. In order to confirm the scan pattern of no deformation, a well-defined straight edge was imaged by our catheter. An IR detection card cut on a side was used for this experiment to make sure the imaged area contained the straight edge. Figure 8 (i) shows the rendered 3D tomogram of the IR detection card on the edge. The linear edge of the top plastic cover verified that our system did not exhibit any significant morphological deformation.
Fig. 8.
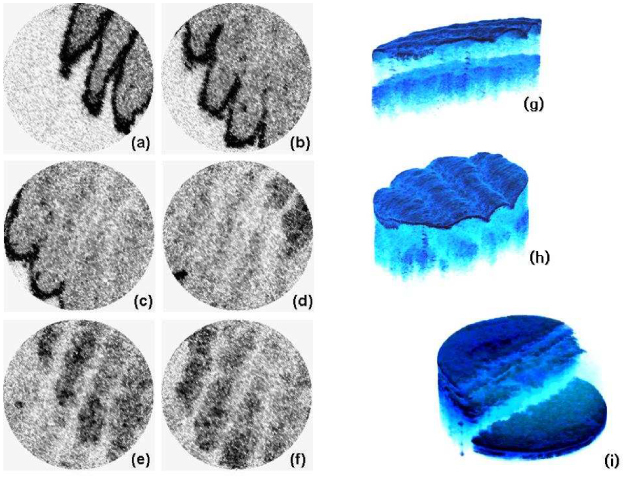
Reconstructed OCT en face images [(a) to (f)], and the 3D-rendered tomograms with different view angles [(g) and (h)]. A rendered 3D tomogram of an IR detection card with a straightly cut edge (i) is shown together.
It has been found that the raster-like feature of the Lissajous scan makes the image less vulnerable to the sample’s bulk motion. Figure 9 shows an OCT en face image before cutting the corner areas out (a) and the circular scan area laid over the same image (b). The blue dotted circle in Fig. 9 (b) depicts the scan circle area which is denoted by (1). The two corner areas denoted by (2) and (3) were erased in en face images of Fig. 8. At the boundary of the circular scan area and the corner area (arcs between (1) and (2), or (1) and (3) in Fig. 9), the morphology is not continued but rather abruptly cut by the boundary. This is explained by the bulk motion of the sample that occurred during the data acquisition time. As shown in Fig. 6, the B-scan ellipses do not meet each other inside the circular scan area but they intersect in the corner area. This means a point had been over-sampled there or scanned two times in a scan cycle with a relatively large temporal interval. So if the sample moved during the interval, the A-line data for a scan point out of the circle would be influenced strongly by the motion and would appear to have a mean value of two A-lines acquired at different moments. This effect of the sample motion must be the most significant at the diagonal area where the temporal interval between the two scans is the largest. As seen in Fig. 9, a point located inside the circle on the diagonal line had been sampled first at the beginning stage of the Lissajous scan. But a neighboring point located just out of the circle contained data acquired in the final stage. The maximum temporal interval between the neighboring areas could be as long as the 2D scan cycle, 1.56 s in our case. This interval is long enough to be influenced by the sample motion. Note that a transverse motion of 0.1 mm per second can cause this level of discontinuity, which seems inevitable for the endoscopic OCT application in practice. This observation gives another good reason for the Lissajous scan to take the circular scan area. The over-sampling problem has been avoided effectively by the circular Lissajous scan. Especially, the central area in the XY plane, normally regarded as the most important part, was scanned only once (except for the primary B-scan) with a nearly uniform sampling distance in a raster-like scan manner. There, the temporal interval between the neighboring areas was kept as small as possible, owing to the relatively low density of sampled A-lines at the center. This feature sufficiently explains the good image quality obtained in Fig. 8.
Fig. 9.
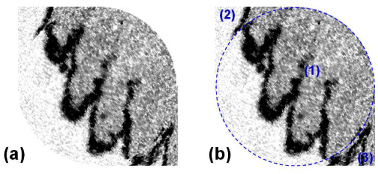
OCT en face image before cutting the corner areas out (a) and the scan circle area laid over the same image (b). The blue dotted circle depicts the circular scan area (1) and two corner areas [(2) and (3)].
The vulnerability of the corner area to the motion artifact can be confirmed by the excessively high density of the sampling points. By the parameters used in our 3D OCT imaging, the distribution of the sampling point density was calculated for the XY scan plane by geometric considerations. The scan area was divided into 100 × 100 μm2 cells and the number of A-lines dedicated to each cell was counted for the Lissajous scan pattern. Figure 10 shows the sampling point density in color map (a) and its cut view along a horizontal line that passes the center. It was found that the central part of the circular scan area exhibited a depressed but nearly uniform sampling point density (~40 A-lines in average and 38 A-lines at minimum, per 100 × 100 μm2 for the central part), while the corner areas had an excessively high density that could result in a higher vulnerability to the motion artifact. It was also found that half of the scan time is abandoned, which was dedicated to the two corner areas.
Fig. 10.
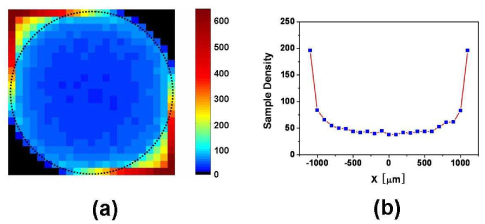
Sampling point density in color map (a) and its cut view along a horizontal line that passes the center.
4. Axial motion compensation
Along with the transverse motion of a sample, the axial movement also deforms the imaged sample’s morphology and may weaken the diagnostic power of the OCT imaging modality. It is clearly observed for an XZ-plane or YZ-plane image (depth-resolved image), which is the primary image set of the conventional OCT systems. This issue of the axial sample motion is more serious in the endoscopic application where the position of the catheter is out of exact control and the consequent relative motion is very common due to dynamic motion of the samples including breathing and heart beating. It usually takes such a long time, more than a few seconds, to acquire full 3D images that sample motion cannot be easily ignored. Most of the conventional scan strategies do not have a way to correct this effect unless there is an additional means equipped to measure such a motion. In contrast, the Lissajous scan gives a chance to compensate the axial sample motion by the nature of scan. Its scanning manner is very much like the simple raster scan, but it samples points in the XY plane with two B-scan lines (upper half and the lower half of an ellipse) that simultaneously run in opposite directions. Two points separated by an equal distance from the primary B-scan line are sampled almost simultaneously as illustrated in Fig. 6. Thus, the acquired A-lines carry the information of the averaged slope because of this nature. And one can compensate the axial motion by shifting the sets of A-lines axially to minimize the variation of the distinct first reflecting surface in conserving the average slope information.
3D ex vivo OCT imaging was performed with a sample of a pig’s larynx. Our endoscope catheter was housed by a protective plastic tube with a transparent window at the end. Figure 11 shows the 2D OCT image cut along the X’ axis (a), Y’-cut image (b), and the en face image (c) before the motion compensation, along with the motion-corrected versions of the Y’-cut image (b’), en face image (c’) and the 3D-rendered tomogram (d), respectively. The X’-cut image (a) shows the smooth surface that reflects the actual sample’s feature. This cut of the tomogram was not significantly influenced by the sample motion because it was acquired by the primary B-scan for a relatively short time (8 ms). In contrast, the Y’-cut image (b) shows a bumpy surface structure primarily as a result of the sample’s axial motion. This cut was obtained by taking A-lines from all the B-scan ellipses that were acquired for 1.56 s. Thus, the corresponding en face image (c) at the axial level denoted by the solid blue line in Fig. 11(b) shows a deformed morphology.
Fig. 11.
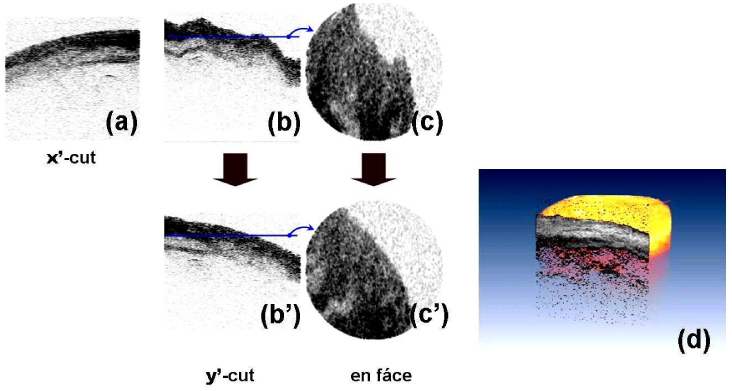
OCT image cut along the X’ axis (a), Y’-cut image (b), and the en face image (c) before the motion compensation, along with the motion-corrected versions of the Y’-cut image (b’), en face image (c’) and the 3D-rendered tomogram (d). The sample was a pig’s larynx ex vivo. Images show the trachea.
By using the bi-directionally scanning nature of the Lissajous scan strategy, a method of motion compensation has been developed to demonstrate the beneficial feature of the proposed scan method. The axial motion compensation was processed in three steps: (i) first-surface detection, (ii) calculation of the average height, and (iii) axially shifting the B-scans. The surface of air-tissue interface was distinguished by the nearest axial position. The position of the surface was characterized by the distinctly high reflection. From the tomogram data, it was searched by an axial point of an A-line where its intensity was above a certain threshold and its slopes with the adjacent points depict a peak by alternating the signs. In the next step, the heights (axial positions) of the surface were averaged for a B-scan ellipse to get a mean height. Finally, each B-scan set of A-lines were shifted axially so that the averaged height was constant over the tomogram. This simple algorithm for the axial motion compensation assumes that the actual surface of the sample has a slowly varying surface property so that the height averaged over an ellipse in the XY plane well matches the mean height averaged over the full area. It is true for a declined plane of a first-order function. Thus, the average slope of the sample’s surface can be successfully saved while the reconstruction of the higher-order information depends on the detailed geometry of the surface. The images of the motion-compensated version in Fig. 11(b’) and (c’) do not show any bumpy structure as in the X’-cut image of Fig. (a). The 3D-rendered tomogram in Fig. 11 (d) shows a realistic morphology for the sample without a significant deformation. These results have successfully demonstrated that the Lissajous scan carries more useful information of the sample motion and allows us to take a chance to remove it from the acquired OCT image. This advantage is rarely found in other types of scan methods in which B-scans sweep a scan area in a certain direction or with a varying amplitude of trajectory.
5. Conclusion
In this report, we have presented a new scan strategy of the semi-resonant Lissagjous scan, which is useful for driving a resonant-cantilever 2D scanner utilized in the OCT endoscope catheter. We have developed a compact forward-view OCT scanning catheter based on a weighted fiber cantilever actuated by a quartered piezotube. We have shown experimentally that the scanning catheter exhibits a troublesome environmental sensitivity for scan pattern instability when driven at a fully resonant driving frequency. This effect was avoided by driving the scanner at a partially resonant frequency of the semi-resonant regime. Taking advantage of the relaxed constraints in the operation frequency, a 2D scan was achieved by a low-order Lissajous pattern generated by driving each axis at a different frequency. This scan method produced a high-performance scan pattern with a reduced nonlinear effect and a higher immunity against the sample motion as well as enhanced stability. An image morphology deformed by an axial sample motion could be compensated by the bi-directionally scanning nature of the Lissajous scan. Those features of stability and motion tolerance verify that the semi-resonant Lissajous scan is very suitable for OCT endoscopy of harsh imaging conditions.
Acknowledgments
This work was supported by the National Institutes of Health ( EB-00293, EB-10090, RR-01192), Air Force Office of Scientific Research ( FA9550-04-0101), Flight Attendant Medical Research Institute ( 32456), and the Beckman Laser Institute Endowment.
References and links
- 1.Yaqoob Z., Wu J., McDowell E. J., Heng X., Yang C., “Methods and application areas of endoscopic optical coherence tomography,” J. Biomed. Opt. 11(6), 063001 (2006). 10.1117/1.2400214 [DOI] [PubMed] [Google Scholar]
- 2.Tran P. H., Mukai D. S., Brenner M., Chen Z., “ In vivo endoscopic optical coherence tomography by use of a rotational microelectromechanical system probe,” Opt. Lett. 29(11), 1236–1238 (2004), http://www.opticsinfobase.org/ol/abstract.cfm?URI=ol-29-11-1236 10.1364/OL.29.001236 [DOI] [PubMed] [Google Scholar]
- 3.Pan Y., Xie H., Fedder G. K., “Endoscopic optical coherence tomography based on a microelectromechanical mirror,” Opt. Lett. 26(24), 1966–1968 (2001), http://www.opticsinfobase.org/ol/abstract.cfm?URI=ol-26-24-1966 10.1364/OL.26.001966 [DOI] [PubMed] [Google Scholar]
- 4.Xie T., Xie H., Fedder G. K., Pan Y., “Endoscopic optical coherence tomography with a modified microelectromechanical systems mirror for detection of bladder cancers,” Appl. Opt. 42(31), 6422–6426 (2003), http://www.opticsinfobase.org/abstract.cfm?URI=ao-42-31-6422 10.1364/AO.42.006422 [DOI] [PubMed] [Google Scholar]
- 5.Aguirre A. D., Hertz P. R., Chen Y., Fujimoto J. G., Piyawattanametha W., Fan L., Wu M. C., “Two-axis MEMS scanning catheter for ultrahigh resolution three-dimensional and en face imaging,” Opt. Express 15(5), 2445–2453 (2007), http://www.opticsinfobase.org/abstract.cfm?URI=oe-15-5-2445 10.1364/OE.15.002445 [DOI] [PubMed] [Google Scholar]
- 6.Jung W., McCormick D. T., Ahn Y.-C., Sepehr A., Brenner M., Wong B., Tien N. C., Chen Z., “In vivo three-dimensional spectral domain endoscopic optical coherence tomography using a microelectromechanical system mirror,” Opt. Lett. 32(22), 3239–3241 (2007), http://www.opticsinfobase.org/ol/abstract.cfm?URI=ol-32-22-3239 10.1364/OL.32.003239 [DOI] [PubMed] [Google Scholar]
- 7.Boppart S. A., Bouma B. E., Pitris C., Tearney G. J., Fujimoto J. G., Brezinski M. E., “Forward-imaging instruments for optical coherence tomography,” Opt. Lett. 22(21), 1618–1620 (1997), http://www.opticsinfobase.org/ol/abstract.cfm?URI=ol-22-21-1618 10.1364/OL.22.001618 [DOI] [PubMed] [Google Scholar]
- 8.Liu X., Cobb M. J., Chen Y., Kimmey M. B., Li X., “Rapid-scanning forward-imaging miniature endoscope for real-time optical coherence tomography,” Opt. Lett. 29(15), 1763–1765 (2004), http://www.opticsinfobase.org/ol/abstract.cfm?URI=ol-29-15-1763 10.1364/OL.29.001763 [DOI] [PubMed] [Google Scholar]
- 9.Wang Y., Bachman M., Li G.-P., Guo S., Wong B. J. F., Chen Z., “Low-voltage polymer-based scanning cantilever for in vivo optical coherence tomography,” Opt. Lett. 30(1), 53–55 (2005), http://www.opticsinfobase.org/ol/abstract.cfm?URI=ol-30-1-53 10.1364/OL.30.000053 [DOI] [PubMed] [Google Scholar]
- 10.Min E. J., Na J., Ryu S. Y., Lee B. H., “Single-body lensed-fiber scanning probe actuated by magnetic force for optical imaging,” Opt. Lett. 34(12), 1897–1899 (2009), http://www.opticsinfobase.org/ol/abstract.cfm?URI=ol-34-12-1897 10.1364/OL.34.001897 [DOI] [PubMed] [Google Scholar]
- 11.Wu T., Ding Z., Wang K., Chen M., Wang C., “Two-dimensional scanning realized by an asymmetry fiber cantilever driven by single piezo bender actuator for optical coherence tomography,” Opt. Express 17(16), 13819–13829 (2009), http://www.opticsinfobase.org/oe/abstract.cfm?URI=oe-17-16-13819 10.1364/OE.17.013819 [DOI] [PubMed] [Google Scholar]
- 12.Smithwick Q. Y. J., Reinhall P. G., Vagners J., Seibel E. J., “A nonlinear state-space model of a resonating single fiber scanner for tracking control: theory and experiment,” J. Dyn. Syst. Meas. Control 126(1), 88–101 (2004). 10.1115/1.1649974 [DOI] [Google Scholar]
- 13.Smithwick Q. Y. J., Vagners J., Reinhall P. G., Seibel E. J., “An error space controller for a resonating fiber scanner: simulation and implementation,” J. Dyn. Syst. Meas. Control 128(4), 899–913 (2006). 10.1115/1.2362787 [DOI] [Google Scholar]
- 14.Lee C. M., Engelbrecht C. J., Soper T. D., Helmchen F., Seibel E. J., “Scanning fiber endoscopy with highly flexible, 1 mm catheterscopes for wide-field, full-color imaging,” J Biophotonics 3(5-6), 385–407 (2010). 10.1002/jbio.200900087 [DOI] [PMC free article] [PubMed] [Google Scholar]
- 15.Huo L., Xi J., Wu Y., Li X., “Forward-viewing resonant fiber-optic scanning endoscope of appropriate scanning speed for 3D OCT imaging,” Opt. Express 18(14), 14375–14384 (2010), http://www.opticsinfobase.org/oe/abstract.cfm?URI=oe-18-14-14375 10.1364/OE.18.014375 [DOI] [PMC free article] [PubMed] [Google Scholar]
- 16.C. W. de Silva, Vibration: Fundametals and Practice, 2nd Ed. (CRC Press, 2007). [Google Scholar]


