

1. Introduction
The most prevalent permanent disability of childhood is ID (previously referred to as mental retardation (MR)) which occurs in approximately 15.5 per 1000 children in the US (Bhasin et al, 2006). The most widely used definition of ID (or MR) in the US is “Significant sub- average intellectual functioning existing concurrently with deficits in adaptive behavior, and manifest during the developmental period” (Luckasson et al, 2002, p8). Many of the etiologic factors and pathologic mechanisms associated with ID are not well understood and the actual causes remain unknown for approximately 50 % of individuals with ID (McDermott et al, 2007). A toxic exposure is identified in 4–5 % of cases with known cause, although it is possible that toxic exposures account for a substantial portion of the idiopathic cases (Filley et al, 2001; Ming et al 2008; DeSoto 2009; Lianois and Ronco 2009; Palmer et al 2009; Vahter 2009). Lead (Pb), mercury (Hg), and arsenic (As) are developmental toxicants that have been associated with neurobehavioral dysfunctions and have been found to have adverse effects on intelligence in children. At low levels of exposure the impact seems to be subtle but at high doses these metals can cause ID (Goldman et al, 2000; Sullivan et al, 2001; Bellinger, 2006; Scorecard Pollution Information, 2008).
Lead has been the most widely studied substance with respect to neurodevelopmental disorders and ID. Lead can cross the placenta beginning at 12 weeks of gestation, and it accumulates in fetal tissues (Wasserman et al, 1994; Wasserman et al, 1997; Tong et al, 1998; Mielke et al, 2007). Pregnant women and children can absorb more ingested Pb (up to 70% is absorbed) than the general adult population (20% absorbed) (Baghurst et al, 1992). There is evidence the association between soil and blood concentrations of Pb in children is statistically significant (Bellinger et al, 2003) and the association between measured blood concentrations and IQ is nonlinear, with the decline in IQ greater at lower levels of exposure (Goldman et al, 2000; Lanphear et al, 2005; Axelrad et al, 2007).
There have been studies describing levels of Hg and As and neurobehavioral effects, however most have been in developing countries with high concentrations of Hg and As exposure (Counter 2002; Zakharova et al 2002; Patel et al, 2005). Although methylmercury can be transported to fetal blood and all forms of Hg cross the placenta, the documented neurodevelopmental outcomes in children have been identified in coastal communities where fish containing Hg are consumed (Davidson et al., 2006; Axelrad et al 2007). There is no evidence that Hg is present in high concentrations in soil, nor is there evidence of an association between soil and blood concentrations.
There is substantial evidence that As is associated with an increased risk of ID (Vahter 2009; Llanos and Ronco 2009; Liu et al, 2010). Arsenic detected in a child’s urine and As levels in children’s blood were associated with lower scores on tests of cognitive function (Calderón et al 2001; Wasserman et al 2004; Wang et al 2007; Rosado et al 2007). Our research team has identified an association between As in soil and the combined outcome of ID and developmental delay, however there is no evidence of an association of As combined with other metals in soil and the outcome of ID (Liu et al, 2010).
The study of inorganic chemical exposures during pregnancy has mainly focused on the singular impact of Pb, Hg, and As, and has shown negative impacts on neurological development of children (Factor-Litvak et al 1999; Counter et al 2002; Wasserman et al 2004; Patel et al, 2005; Murata et al 2007; Vahter 2009). Some studies have used direct measurement of maternal and child blood levels to estimate exposure, and cognitive and neurologic testing of children to assess the outcome. Other studies have used an indirect epidemiologic approach such as measurement of the distance from maternal residence to contaminated sites to estimate exposure. Parent report of neurodevelopmental disabilities for the child has been used to measure outcomes (Croen et al 1997; Dummer et al, 2003; Langlois et al, 2009).
Numerous reports document elevated soil metal concentrations in urban areas from industrial and transportation sources and elevated rural soil concentrations of metals from natural geologic sources, pesticides, and industrial facilities (Li et al 2004; Aelion et al, 2008; Davis et al, 2009). The US EPA sets two acceptable levels for human exposures to soils containing metals. The more stringent human health residential soil screening level (RSSL) is to protect against a cancer risk at 1X10⁻⁶. The EPA also sets a higher soil screening level to protect against non-cancer effects. These levels of risk are benchmarks for safe exposure (EPA, 2000).
The approach used in our study represents a middle ground between direct measurement in individuals and ecologic associations in aggregate data, to identify associations of soil concentrations of metals and intellectual disability (ID) in children, from urban and rural residential neighborhoods. We utilized an innovative approach that includes spatial statistical methods (geocoding of maternal residences during pregnancy, measurement of soil for eight metals at grid locations, and Bayesian Kriging to estimate residential soil metal concentrations at residential addresses) combined with analysis of an interaction of exposure concentrations. We concentrated on the impact of As combined with the seven other metals, since there is sufficient evidence, in the literature and our previous work, to suggest that As is an important contributor to ID (Wang et al, 2007; Rosado et al, 2007). We used Medicaid data to capture the experience of low-income mothers and children, since it has been reported that children in poor neighborhoods are disproportionally impacted by environmental pollution (Bowen, 2002).
The purpose of this study was to answer the question: Are soil concentrations of metals proximal to maternal residence during pregnancy associated with the probability of ID in children? This question builds on the strong association of lead and ID in the literature, and in our previous work that showed a relationship between As and the combined outcome of ID and developmental delay. In this study we hypothesized the probability of having a child born with the more severe outcome of ID is associated with the soil concentrations of As combined with Pb.
2. Methods
2.1 Study population
This is a retrospective cohort study of pregnant women who were insured by South Carolina Medicaid from 1996 through 2002 and resided in one of six residential study strips during the sixth month of pregnancy. These women were followed through pregnancy and delivery and then longitudinally to see if their child received a diagnosis of ID. We merged the Medicaid reimbursement files for the mothers and children, birth certificates and the school and agency records for children’s services through May 2008. As a result we had 8–12 years of follow-up time to identify codes for ID.
Medicaid is an insurance plan for people living under the federal poverty level, which combines state and federal funding. In South Carolina pregnant women living below 185% of poverty were eligible for Medicaid. The federal poverty guideline for eligibility for a family of four is an annual income of $22,050, and the pregnancy guideline for eligibility for a family of four is an annual income of $40,792, and this accounts for 50 % of the births in the state. The Medicaid billing records of the women were followed throughout pregnancy and the children were followed from birth throughout early childhood, using a linked pregnancy file, birth certificate, Medicaid billing record for children, school, and service record from the state disability agency that identifies children with ID.
2.2 Identification of Cases of ID
We started with 5617 mother-child pairs who lived in six strips of land where soil sampling was done, during the sixth month of pregnancy. The identification of cases in this study included four steps designed to identify confirmed cases of ID with an unknown cause. The first step involved identifying infants and children with an ICD9 code of 317 (mild MR), 318 (moderate and severe MR), or 319 (MR severity unspecified) in the Medicaid inpatient or outpatient records. Second, we identified a list of known causes of ID and their ICD9 codes (Center for Disease Control, 2007). We excluded 245 babies with the following known causes of ID: Trisomy 13, 16–18, other chromosomal aberrations, Prader-Willi Syndrome, Rett’s Syndrome, phenylketonuria, Fragile X Syndrome, postnatal injury, prenatal rubella, meningitis, encephalitis, and Fetal Alcohol Syndrome. The third step excluded 1490 children with a diagnosis of developmental delay (ICD9 code 315) since it was not clear if these children belonged in the case or comparison group. The final step identified confirmed cases of ID with both a Medicaid diagnosis and a school placement for ID (or MR) or a record of eligibility determination by an agency that provides services for children with ID. We found that 44.3 %, or 109 of the 246 cases of unknown cause ID identified by Medicaid, were confirmed cases. The final dataset included 3988 mother-child pairs, and 246 cases of ID who resided in the strips during the sixth month of pregnancy.
2.3 Geocoding of Maternal Residences
The study strips were dispersed throughout South Carolina, in rural and urban areas and each strip contained a low and high prevalence area for the outcome of ID. Addresses were obtained from a Medicaid eligibility file for each month of pregnancy and these were geo-coded using ArcGIS version 9.3. In order to maintain the confidentiality agreement the soil sampling was done according to a grid throughout a residential area. The intersection of the grid lines were sampling locations, referred to as grid nodes. The coordinates of the grid nodes were provided to the soil sampler, not the actual residential addresses. The address of each residence was known by the investigators who did the statistical analyses.
2.4 Soil Sampling and Metal Analysis
We selected strips of land, for soil sampling, that contained a cluster of ID. The procedure for cluster analysis is described by Zhen et al (2008). Each strip included a risk gradient (from low to high ID risk) so that a range of outcomes would be included in the soil sampling mesh. The sampling area was defined as a strip, and latitude and longitude of the four corners of the rectangular strip area were identified for six strips. Each strip was approximately 105 km2 in size and included an area that had a statistically significantly higher rate of ID than the state average for ID (Zhen et al, 2008). The six strips contained residential areas where pregnant women resided and included four small towns (1,550–15,000 residents) and two small cities (40,000–56,000 residents).
We sampled soil within the strips using a grid and measured metal concentrations, and then explored the associations of the Kriged values of soil concentration of metals with the ID outcome. The coordinates for each strip area were mapped and a uniform grid was overlaid at locations 1.0–3.0 km apart. Some node points were inaccessible (e.g., on building locations or water bodies), so soil samples were collected as close to the grid node as possible. Global Positioning System (GPS) latitudes and longitudes were taken at each sampling location with a handheld GPS device (Garmin Etrex, Olathe, KS) (Aelion et al, 2008).
Soil was collected at 5-cm depths from 60 nodes in Strip 1, 119 nodes from Strip 2 and Strip 4, 114 nodes from Strip 3 and Strip 6, and 120 nodes from Strip 5 (Aelion et al 2009a; Aelion et al., 2009b). Duplicate samples were collected at 10% of the sampling locations for quality assurance and quality control purposes. After sampling, soil was analyzed for each metal by an independent analytical laboratory (Pace Analytical, Huntersville, NC). Data from a total of 646 sample sites were used in the Kriging stage of the analysis. The EPA soil screening level to protect against non-cancer effects for As is 22 mg kg-1 and for Pb it is 400 mg kg-1 (US EPA 2009). The EPA soil screening level to protect against cancer is 0.39 mg kg-1 for As and 400 mg kg-1 for Pb (US EPA 2009).
2.5 Kriging to assign chemical concentration at each residence
Although we sampled soil at nodes within six strips and had concentrations of As, barium (Ba), chromium (Cr), copper (Cu), Pb, manganese (Mn), Nickel (Ni) and Hg at each node, there is a misalignment between concentrations at soil sample sites and ID at the geocoded location of the homes. We used the Bayesian Kriging model proposed by Diggle and Ribeiro (Diggle et al, 1998; Diggle et al, 2002; Diggle et al, 2007) to get unbiased estimates of missing data, and used the measured chemical concentrations at the nodes to predict the unobserved values. Since the metal concentrations were highly asymmetric we used the Box-Cox transformation of these variables. By quantifying spatial variability through the covariance function, Kriging can produce maps of optimal predictions from incomplete and noisy spatial data (Banerjee et al., 2004). The model parameters were sampled from their posterior distributions with proper priors. This process was implemented by using the Krige.bayes function of “geoR” library in R (Ribeiro et al, 2001). Once transformed, we validated the ability of the Kriging approach using the “leave-one-out” cross validation method (Cressie, 1993). This was achieved by fitting the Kriged model to the residential points, estimating a missing point from the fitted model, and examining the mean error (ME) and mean square deviation ratio (MSDR) (Webster et al, 2007). The MSDR and ME were close to reference levels after transformation, indicating that Box-Cox transformation yielded a good approximation.
During the Kriging process, soils measured below the reportable concentrations were assigned a value of half of the minimum detectable limit according to the EPA Guidance for data Quality Assessment (EPA, US, 2000), since the non-detected rate was less than 15% for most of the metals. The detection limit for each analyte varied but was approximately 0.5 mg kg-1 for As and Pb, and 0.00055 mg kg-1 for Hg.
2.6 Covariate definitions
The covariates included in the analyses included infant, maternal and neighborhood characteristics, as shown in Table 1. The child and mother characteristics were obtained from the birth certificate, which was linked to the Medicaid billing file. The infant characteristics were sex (male, female), weeks of gestation (greater than 36 weeks, 28–36 weeks and less than 28 weeks), birth weight (greater than 2500 grams, 1500–2500 grams, and less than 1500 grams), and small for gestational age (above 10% and below 10% for weight for weeks gestation). The standard for small for gestational age used the cut-points identified by Groom, Poppe, North and McCowan (2007). The maternal covariates were maternal age (18–34, less than 18 years, and greater than 34 years). Maternal race was non-Hispanic white, non-Hispanic black and all others. The number of prior births (parity) was categorized as 0, 1, 2, and 3 or more, and tobacco and alcohol use was categorized as yes or no. Finally, we added two neighborhood characteristics for each mother to capture the density per square mile and the median age of housing in the block group where the mother resided during the sixth month of pregnancy.
Table 1.
Characteristics of the Mother Child Pairs (n=3988)
| No ID (n=3879) | Confirmed ID (n=109) | Percent (Confirmed ID) | Odds ratio* (Confirmed ID) | |
|---|---|---|---|---|
| Infant Characteristics Infant sex | ||||
| Girl | 2095 | 32 | 1.50% | |
| Boy | 1784 | 77 | 4.14% | 2.83(1.86–4.23) |
| Weeks of gestation | ||||
| >36 | 3356 | 85 | 2.47% | |
| 28–36 | 509 | 21 | 3.96% | 1.63(1.00–2.65) |
| <28 | 14 | 3 | 17.65% | 8.46(2.39–29.99) |
| Birth weight (in grams) | ||||
| >2500 | 3528 | 92 | 2.54% | |
| 1500–2500 | 317 | 12 | 3.65% | 1.45(0.79–2.68) |
| <1500 | 34 | 5 | 12.82% | 5.64(2.16–14.75) |
| Small for Gestational Age1 | ||||
| Above 10% | 3312 | 89 | 2.62% | |
| Below 10% | 567 | 20 | 3.41% | 1.31(0.80–2.15) |
|
| ||||
| Maternal Characteristics | ||||
| Mother’s age | ||||
| 18–34 | 3302 | 93 | 2.74% | |
| <18 | 463 | 11 | 2.32% | 0.84(0.45–1.59) |
| >34 | 114 | 5 | 4.20% | 1.56(0.62–3.90) |
| Mother’s race | ||||
| Non-Hispanic White | 1761 | 34 | 1.89% | |
| Non-Hispanic Black | 2026 | 74 | 3.52% | 1.89(1.25–2.85) |
| Other | 91 | 1 | 1.09% | 0.57(0.08–4.21) |
| Parity | ||||
| 0 | 1775 | 40 | 2.20% | |
| 1 | 1222 | 33 | 2.63% | 1.20(0.75–1.91) |
| 2 | 613 | 27 | 4.22% | 1.96(1.19–3.21) |
| 3+ | 269 | 9 | 3.24% | 1.49(0.71–3.09) |
| Tobacco use | ||||
| No | 3080 | 91 | 2.87% | |
| Yes | 799 | 18 | 2.20% | 0.76 (0.46–1.27) |
| Alcohol use | ||||
| No | 3845 | 108 | 2.73% | |
| Yes | 31 | 1 | 3.13% | 1.15(0.16–8.49) |
|
| ||||
| Neighborhood Characteristics | No ID (n=3879) | Confirmed ID (n=109) | P-value | Odds ratio |
| Density Popn/ sq. mile | 1937.20 | 2115.35 | 0.23 | 1.01(1.00–1.02)** |
| Median age of residence Years | 40.45 | 42.83 | 0.03 | 1.02 (1.00–1.04)*** |
|
| ||||
|
Metal Concentrations in Soil In mg kg-1 ***
| ||||
| Arsenic (As) | 3.828 | 3.243 | 0.015 | 1.130(1.048–1.218) |
| Barium (Ba) | 73.64 | 65.54 | 0.021 | 1.006(1.001–1.010) |
| Chromium (Cr) | 21.77 | 19.71 | 0.065 | 1.014(0.999–1.029) |
| Copper (Cu) | 16.53 | 14.02 | 0.017 | 1.027(1.009–1.045) |
| Lead (Pb) | 67.94 | 55.99 | 0.052 | 1.002(1.000–1.004) |
| Manganese (Mn) | 265.18 | 262.49 | 0.885 | 1.000(0.999–1.001) |
| Mercury (Hg) | 0.026 | 0.028 | 0.594 | 0.04(<.0001–>999) |
| Nickel (Ni) | 6.14 | 5.67 | 0.223 | 1.026(0.984–1.071) |
Use of 10th percentile based on Groom et al. 2007.
crude odds ratio, when there is only one predictor in the model;
odds ratio for 100 unit change;
odds ratio for 10 unit change,
odds ratio for one unit change
2.7 Statistical Analysis
The hypothesis for this study was the probability of having a child born with ID is associated with soil concentrations of As and Pb for pregnant women. We started our analysis by exploring the Spearman rank correlation between each of the eight metal concentrations. The distribution of all the metals was skewed to the lower values and the highest correlation was 0.603 for As and Pb. Then we explored the association between the concentration of As and each metal with the risk of ID using the generalized additive model (GAM). GAM represents a method of fitting a smooth relationship between the response variable and an additive predictor through a scatter plot of data points. GAM does not involve strong assumptions about the relationship that is implicit in standard parametric regression since such assumptions may force the fitted relationship away from its natural path at critical points (Hastie et al, 1990; Wood, 2006). We started with a full model that included the metals, and the infant and maternal variables. The categorical variables were considered linear terms and the continuous variables were considered smooth terms. We chose to investigate the smooth interaction of multiple predictors using the tensor product smoother since it is invariant to linear rescaling of covariates and computationally efficient. The “mgcv” package in R with automatic smoothness selection was used for GAM model fitting (Wood, 2006).
The binary response variable ID is assumed to follow a Bernoulli distribution with probability (ID=1) = p. The covariates ({Xj}j=1,…,m) include both mother and child covariates and the Kriged concentration for soil chemicals. A semi-parametric model, , was considered, where n is the sample size, m is the total number of predictors, and the first s predictors are assumed to be linearly associated with logit( p) by parameter α (parametric terms). The remaining predictors are spline terms which are nonlinearly associated with the ID outcome.
We explored interactions for the mother and child variables and identified effect modification for the relationship between infants who were in the lowest 10% of birth weight for gestational age category (Small for Gestational Age or SGA) and infants who were normal size for gestational age. Then we stratified our analysis by SGA level and put the interaction between As and Pb into tensor product smooth terms and used the backwards elimination procedure to find the final model for the two levels of SGA. We confirmed our results by using forward selection and found the interaction term of As and Pb remained significant. All candidate models (including main effect and interaction terms) were assessed via a ΔAIC>2 entry criterion (Burnham and Anderson, 2002). Based on the final model, we created a 3D plot for male children, with mean values for gestational age, parity, and child age at last follow-up. The plot shows the concentrations of As and Pb against risk of ID, using wireframe function in the R lattice package.
3. Results
Table 2 shows the metal concentrations for the soil samples. All of the soil samples were below the EPA Regional Soil Screening Level (RSSL) for non-cancer hazard index for the metals. The mean concentration for As in all strips was higher than the EPA Preliminary Remediation Goals (PRG) residential soil sample limit (RSSL) for carcinogenic target risk of 0.39 mg kg-1, and >70% of sample concentrations were greater than this level. For Strips 1, 2, 3, 4, 5 and 6, respectively, 25%, 45%, 11% 92%, 92%, and 48% of sample concentrations were greater than the As industrial soil screening level (ISSL; 1.6 mg kg-1). No other metal concentrations from Strip 1, 3, 4, and 6 were above the PRG RSSLs. For Strip 2, 3% of soils were above the Mn RSSL (1800 mg kg-1), and 1% of Strip 5 soils were above both the RSSL and ISSL for Pb (RSSL 400 mg kg-1 /ISSL 800 mg kg-1).
Table 2.
Metal concentrations from soil samples at nodes within strips,
| Metal (n=646) | Range (mg kg-1 dw) | Mean (mg kg-1 dw) | Median (mg kg-1 dw) | EPA PRG- RSSL* (mg kg-1 dw) | % Samples exceeding EPA PRG- RSSL |
|---|---|---|---|---|---|
| As | 0# –42.1 | 2.6 | 1.8 | 0.4 | 94.3 |
| Ba | 2.1–474.0 | 48.5 | 30.5 | 5400 | 0 |
| Cr | 1.0–590.0 | 15.8 | 9.6 | 210 | 0.2 |
| Cu | 0. 5–204.0 | 9.8 | 5.7 | 3100 | 0 |
| Pb | 0.9–1800.0 | 35.4 | 19.0 | 400 | 0.3 |
| Mn | 0–5100.0 | 209.4 | 110.0 | 1800 | 0.5 |
| Ni | 0–51.0 | 3.9 | 2.1 | 1600 | 0 |
| Hg | 0# –0.2 | 0.3 | 0.0 | 23 | 0 |
EPA Region 9 Preliminary Remediation Goals (PRG), residential soil screening level (RSSL) for cancer risk
Below reportable concentrations. A value of half the minimum detectable limit was used in statistical analyses.
For the analysis of the impact of soil metal concentrations on infants we deleted all cases where data were incomplete and this resulted in 3988 mother child pairs. The characteristics of these pairs are shown in Table 1. The overall prevalence of confirmed ID in the six strip areas was 2.73% with 109 cases and 3879 comparison children. Male infants were more than twice as likely to be diagnosed with ID, premature infants less than 28 weeks of gestation were at 8.5 fold risk, and very low birth weight babies (< 1500 g at birth) were at 5.6 fold risk of ID. Mothers who were African-American were 90% more likely to have a child with ID, and those with two or more children were at two-fold risk for having a child with ID. There was also a significant association with the outcome of ID with both older homes (possibly with Pb based paint) and density in the census block in which the mother lived. We explored the univariate association of the eight metals with ID, as shown at the bottom on Table 2. Four metals had a statistically significant relationship with ID- As, Pb, copper and barium. The odds ratio for As was the highest (O.R. 1.130 (95% Confidence Interval 1.048–1.218).
We mapped the concentration of As in each strip. Strip 5 is shown, as an example of one of the six strips, in Figure 1. The concentration of As is overlaid with the location of ID cases (marked as X) and comparisons births (marked as 0). Strip 5 is 15.8 km (9.9 miles) long and 4 km (2.5 miles) wide. The irregular lines and oval areas display contours of concentrations of As, with a number showing the interpolated concentration of As.
Figure 1. Map of Strip 5* Contours of Arsenic Concentration and Location of ID and Comparison Children’s Maternal Residence during Pregnancy.

*Strip 5 is 15.8km (9.9 miles) long and 4 km (2.5 miles) wide.
One unit (1.0) on X axis = 1.15 miles; One unit on Y axis = 1.38 miles.
Numbers imbedded in map are concentration levels of arsenic.
We tested seven models that included an interaction between As and one metal as well as the main effects of the six remaining metals. The model with the lowest AIC value was the one with an interaction term for As and Pb. We then started with a full model that included infant, maternal, and neighborhood characteristics, Ba, Cr, Cu, Hg, Mn, Ni, and the interaction of As and Pb in a tensor product smooth term. Infants who were normal weight for gestational age had a statistically significant association for As (OR 1.151, 95% CI 1.061–1.249) and Pb (OR 1.002, 95% CI 1.000–1.004), whereas infants who were small for gestational age did not have a significant association for As and Pb with ID.
We modeled the relationship between the metals and the mother and child covariates to find the best fit with prediction of ID in children. Table 3 shows the parameter estimates for the variables that remain in the final model at the two levels of SGA. For the parametric terms in Table 3, the interpretation of parameters is the same as the logistic regression, and a higher risk of ID is observed in infants with younger gestational ages, male infants, women with more live born children, and for older children at last time for follow-up. These variables are well documented in the literature as predictors for ID. For SGA infants, after controlling for the covariates, the nonlinear tensor term for the interaction of As and Pb was not statistically significant (p = 0.602). However, when infants were normal weight for gestational age the nonlinear tensor term for the interaction of As and Pb was statistically significant (p =0.019). When we included As and Pb as independent tensor terms, with the same covariates, neither one was statistically significant associated with ID.
Table 3.
The Parameter Estimates in the Final Model for Month 6 of Pregnancy, by gestational age status
| SMALL FOR GESTATIONAL AGE INFANTS
| ||||
|---|---|---|---|---|
| Variable | OR Est. | 95% Confidence Limits | P-value | |
| Gestational age | 0.749 | 0.624 | 0.899 | 0.002 |
| Male infant | 2.897 | 1.101 | 7.621 | 0.031 |
| Parity | 1.516 | 1.024 | 2.244 | 0.037 |
| Child age at last follow-up | 1.593 | 1.253 | 2.025 | 0.0001 |
| Est df | Chi sq | P-value | ||
|
| ||||
| te(As,Pb) | 4.038 | 3.304 | 0.602 | |
|
| ||||
|
NORMAL FOR GESTATIONAL AGE INFANTS
| ||||
| Variable | OR Est. | 95% Confidence Limits | P-value | |
|
| ||||
| Gestational age | 0.902 | 0.834 | 0.974 | 0.009 |
| Male infant | 3.483 | 2.126 | 5.706 | <.0001 |
| Parity | 1.186 | 1.000 | 1.406 | 0.049 |
| Child age at last follow-up | 1.366 | 1.241 | 1.505 | <.0001 |
| Est df | Chi sq | P-value | ||
|
| ||||
| te(As,Pb) | 5.284 | 13.42 | 0.019 | |
Figure 2 provides the smooth interaction of As and Pb, and is the 3D plot for male children who were normal weight for gestational age at birth (Figure 2a) or were small for gestational age (SGA, Figure 2b) at birth. Both figures show that as the concentration of As increases, the risk of ID also increases. For normal weight for gestational age children when As =22 mg kg-1 and Pb=200 mg kg-1 the risk for ID was 11% and when As=22 mg kg-1and Pb=400 mg kg-1 the probability of ID was 65%. For small for gestational age infants there is not a statistically significant interaction between As and Pb.
Figure 2.
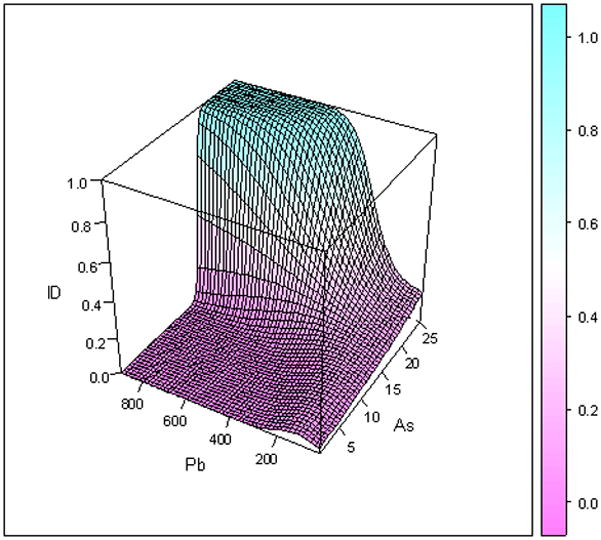
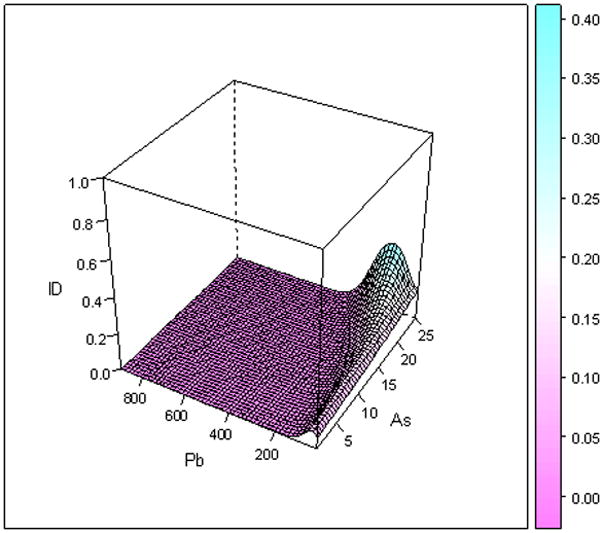
Figure 2a: Three-dimensional plot of arsenic and lead and probability of ID, for male children, who are NOT small for gestational age
Figure 2b: Three-dimensional plot of arsenic and lead for male children who were small for gestational age.
4. Discussion
We detected a statistically significantly association between soil concentrations of As and Pb with validated ID in children who were normal weight for gestational age at birth. We used a novel approach that combined epidemiology with spatial statistics and environmental health sciences.
Arsenic is the only one of the eight metals sampled that was above the recommended residential soil screening level for carcinogenic risk in the majority of soil samples; therefore we focused on both the main effect of As and two-way interactions between As and other metals. The Kriging estimation of the soil concentrations of each of the chemicals is known as the best linear unbiased estimator of the true covariates. One of the properties of the Kriging estimation is that it assumes no measurement error is incurred. Since there are no covariates other than chemicals at the soil sample sites, it is reasonable to use the Kriging as an unbiased linear estimator for interpolating the chemical at the residential sites (Cressie, 1993). One way to deal with such a problem is to incorporate an additive measurement error or Berkson measurement error (Carroll et al., 2006) in the interpolated value. In the final model selected by AIC criterion, the effects of As and Pb on ID were estimated with adjustment of the other potential confounders, which provides interpretable associations between ID and As and Pb.
One of the limitations of our study was we could not distinguish between exposures that occurred in utero and those that occurred during early childhood, since we were not able to determine what proportion of mothers remained in the same residence during their child’s early life. Although ID is usually a result of perinatal events, the time of diagnosis depends on the presentation of signs and symptoms of known syndromes and the observation of developmental delay in the developing child. Identification of ID contributes to its prevalence estimate, since the onset (incidence) usually occurs in utero. Previous literature suggests the diagnosis of ID peaks around age 9–11 years, or at 5th grade (Pless, 1994; McDermott et al, 2007). In this study the children were 6–11 years of age when our case identification for the ID diagnosis was carried out. We observed that child age had a nonlinear association with ID, and it started to level out at approximately age 7 years.
We did not have individual assessments of the outcome and the home environment of the family, nor did we have data on parent occupations and exposures, household exposures including lead paint, gardening practices and exposure to chemicals in other venues. Despite the reliance on secondary data, we had access to confounders for idiopathic ID including infant male gender, higher parity, younger gestational age at birth, and age of homes. This study does not suggest a mechanism of exposure, nor a critical time during pregnancy. Nor does this study address the specific source of exposure but instead focuses on the association of soil metal concentrations during pregnancy with child ID. Finally, we conducted our investigation in areas that include a high prevalence of ID (2.85%) and we used data only for mothers and children insured by Medicaid in South Carolina. Because this study focused on poor children with the highest risk for ID it is not possible to generalize the results to the entire population of pregnant women and their children.
Our findings can be interpreted in light of previous research that has shown in utero exposure to As is associated with some teratogenic effects in laboratory animals and humans (Willhite et al, 1984; Unis et al, 2009). Our previous work found that As was associated with ID and DD in this study population (Liu et al. 2010). It is noteworthy that we did not find mediation in which an infant’s birth weight for gestational age at birth (the variable: SGA) was an intermediate between As and Pb exposure and ID. Instead we identified effect modification, with only the normal weight for gestational age infants impacted. The fact that the association between the interaction of As and Pb and ID was not observed in SGA infants suggests that masking, or a collider effect, was occurring. SGA is thought to be the result of placental insufficiency, resulting in malnutrition of the developing fetus. The known risk factors for SGA include poor nutrition, tobacco smoking, alcoholism, severe maternal anemia and thrombophilia, pre-eclampsia, chromosomal abnormalities, maternal infections, and multiple births (Gardosi 2006; Creasy and Resnik, 2008). The factors associated with SGA are also risk factors for ID and it is likely that these factors took precedence over the As and Pb exposures.
For the normal weight for gestational age children, an interaction effect between soil As levels over 17 mg kg-1 and Pb levels over 400 mg kg-1was identified. In fact, when we extended our modeling results to levels of residential soil Pb ≥ 600 mg kg-1the probability of ID in the child, was over 99% when As concentrations in the soil were 21 mg kg−-1 (Figure 2). Another study demonstrated a similar interaction between As and Pb on the central monaminergic systems of the adult mouse (Mejía, 1997).
Studies of the association between environmental chemical exposures during pregnancy and child outcomes require a large sample size and the ability to find and test children years after the exposure. Our study used 3988 mother-child pairs but it did not involve individual contact with any of the study subjects and instead relied on merged secondary data. The results are compelling since we have shown a significant association between Kriged concentrations of soil metals (concentrations of As combined with Pb) proximal to maternal residences with ID in the normal weight for gestational age infants. Future studies are needed to focus on the biologic pathways between exposure and outcome and dose response relationships between As and Pb with ID.
Acknowledgments
Funding for this research was provided by the National Institutes of Health, National Institute of Environmental Health Sciences, Grant No. R01 ES012895-01A1. This project was approved by the University of South Carolina Institutional Review Board, with exempt status, in accordance with 45 CFR 46.101 paragraph b4.
Footnotes
Publisher's Disclaimer: This is a PDF file of an unedited manuscript that has been accepted for publication. As a service to our customers we are providing this early version of the manuscript. The manuscript will undergo copyediting, typesetting, and review of the resulting proof before it is published in its final citable form. Please note that during the production process errors may be discovered which could affect the content, and all legal disclaimers that apply to the journal pertain.
Contributor Information
Suzanne McDermott, Email: suzanne.mcdermott@uscmed.sc.edu.
Junlong Wu, Email: junlongwu5@yahoo.com.cn.
Bo Cai, Email: bocai@mailbox.sc.edu.
Andrew Lawson, Email: lawsonab@musc.edu.
C. Marjorie Aelion, Email: maelion@schoolph.umass.edu.
References
- Aelion CM, Davis HT, McDermott S, Lawson AB. Soil metal concentrations and toxicity: Associations with distances to industrial facilities and implications for human health. Sci Total Environ. 2009a;407:2216–2223. doi: 10.1016/j.scitotenv.2008.11.033. [DOI] [PMC free article] [PubMed] [Google Scholar]
- Aelion CM, Davis HT, Liu Y, Lawson AB, McDermott S. Validation of Bayesian Kriging of arsenic, chromium, lead and mercury in surface soils based on internode sampling. Environ Sci Technol. 2009b;43:4432–4438. doi: 10.1021/es803322w. [DOI] [PMC free article] [PubMed] [Google Scholar]
- Aelion CM, Davis HT, McDermott S, Lawson AB. Metal concentrations in rural topsoil in South Carolina: Potential for human health impact. Sci Total Environ. 2008;402:149–156. doi: 10.1016/j.scitotenv.2008.04.043. [DOI] [PMC free article] [PubMed] [Google Scholar]
- Ahmad SA, Sayed MH, Barua S, Khan MH, Faruquee MH, Jalil A, Hadi SA, Talukder HK. Arsenic in drinking water and pregnancy outcomes. Environ Health Perspect. 2001;109:629–631. doi: 10.1289/ehp.01109629. [DOI] [PMC free article] [PubMed] [Google Scholar]
- Axelrad DA, Bellinger DC, Ryan LM, Woodruff TJ. Dose-response relationship of prenatal mercury exposure and IQ: an integrative analysis of epidemiologic data. Environ Health Perspect. 2007;115:609–615. doi: 10.1289/ehp.9303. [DOI] [PMC free article] [PubMed] [Google Scholar]
- Baghurst PA, McMichael AJ, Wigg NR, Vimpani GV, Robertson EF, Roberts RJ, Tong SL. Environmental exposure to lead and children’s intelligence at the age of seven years. The Port Pirie Cohort Study. N Engl J Med. 1992;327:1279–1284. doi: 10.1056/NEJM199210293271805. [DOI] [PubMed] [Google Scholar]
- Banerjee S, Gelfand AE, Carlin BP. Hierarchical Modeling and Analysis for Spatial Data. Chapman & Hall/CRC; Boca Raton: 2004. [Google Scholar]
- Bellinger DC. Human Developmental Neurotoxicology. Taylor & Francis; New York: 2006. [Google Scholar]
- Bellinger DC, Needleman HL. Intellectual impairment and blood lead levels. N Engl J Med. 2003;349:500–502. doi: 10.1056/NEJM200307313490515. [DOI] [PubMed] [Google Scholar]
- Bhasin TK, Brocksen S, Avchen RN, Braun KVN. Prevalence of four developmental disabilities among children age 8 years- Metropolitan Atlanta Developmental Disabilities Surveillance Program, 1996 and 2000. MMWR Surveillance Summaries. 2006;55(SS-1):1–9. [PubMed] [Google Scholar]
- Bowen W. An analytic review of environmental justice research: what do we really know? Environ Manage. 2002;29:3–15. doi: 10.1007/s00267-001-0037-8. [DOI] [PubMed] [Google Scholar]
- Burnham KP, Anderson DR. A Practical Information-Theoretic Approach. Springer-Verlag; New York: 2002. Model Selection and Multimodal Inference. [Google Scholar]
- Calderón J, Navarro ME, Jimenez-Capdeville ME, Santos-Diaz MA, Golden A, Rodriguez-Leyva I, Borja-Aburto V, Díaz-Barriga F. Exposure to arsenic and lead and neuropsychological development in Mexican children. Environ Res. 2001;85:69–76. doi: 10.1006/enrs.2000.4106. [DOI] [PubMed] [Google Scholar]
- Carroll RJ, Ruppert D, Stefanski LA, Crainiceanu C. Measurement Error in Nonlinear Models: A Modern Perspective. Chapman & Hall/CRC; Boca Raton: 2006. [Google Scholar]
- Centers for Disease Control and Prevention (CDC), Centers for Medicare and Medicaid Services (CMS) The International Classification of Diseases, Ninth Revision, Clinical Modification (IDC-9-CM) 6. National Center for Health Statistics; Washington, D.C: 2007. [Google Scholar]
- Counter SA, Buchanan LH, Ortega F, Laurell G. Elevated blood mercury and neuro-otological observations in children of the Ecuadorian gold mines. J Toxicol Environ Health A. 2002;65:149–163. doi: 10.1080/152873902753396785. [DOI] [PubMed] [Google Scholar]
- Creasy RK, Resnik R, Iams JD. Creasy and Resnik’s Maternal-Fetal Medicine: Principles and Practice. 6. WB Sunders Co; Philadelphia: 2008. [Google Scholar]
- Cressie N. Regional mapping of incidence rates using spatial Bayesian models. Med Care. 1993;331:YS60–YS65. doi: 10.1097/00005650-199305001-00009. [DOI] [PubMed] [Google Scholar]
- Croen LA, Shaw GM, Sanbonmatsu L, Selvin S, Buffer PA. Maternal residential proximity to hazardous waste sites and risk for selected congenital malformations. Epidemiology. 1997;8:347–354. doi: 10.1097/00001648-199707000-00001. [DOI] [PubMed] [Google Scholar]
- Davidson PW, Myers GW, Weiss B, Shamlaye CF, Cox C. Prenatal methyl mercury exposure from fish consumption and child development: a review of evidence and perspectives from the Seychelles Child Development Study. Neurotoxicology. 2006;27:1106–1109. doi: 10.1016/j.neuro.2006.03.024. [DOI] [PubMed] [Google Scholar]
- Davis HT, Aelion CM, McDermott S, Lawson AB. Identifying natural and anthropogenic sources of metals in urban and rural soils using GIS-based data and spatial interpolation. Environ Pollut. 2009;157:2378–2385. doi: 10.1016/j.envpol.2009.03.021. [DOI] [PMC free article] [PubMed] [Google Scholar]
- DeSoto MC. Ockham’s Razor and autism: the case for developmental neurotoxins contributing to a disease of neurodevelopment. Neurotoxicology. 2009;30:331–337. doi: 10.1016/j.neuro.2009.03.003. [DOI] [PubMed] [Google Scholar]
- Diggle PJ, Tawn JA, Moyeed RA. Model-based geostatistics. Appl Stat. 1998;47:299–350. [Google Scholar]
- Diggle PJ, Ribeiro PJ., Jr Bayesian inference in Gaussian model-based geostatistics. Geogr Environ Model. 2002;6:129–146. [Google Scholar]
- Diggle PJ, Ribeiro PJ., Jr . Model-based Geostatistics. Springer-Verlag; New York: 2007. [Google Scholar]
- Dummer TJ, Dickinson HO, Parker L. Prevalence of adverse pregnancy outcomes around hazardous industrial sites in Cumbria, north-west England, 1956–93. Paediatr Perinat Epidemiol. 2003;17:250–255. doi: 10.1046/j.1365-3016.2003.00495.x. [DOI] [PubMed] [Google Scholar]
- Environmental Protection Agency. EPA QA/G-9, QA00 Update. Office of Environmental Information; Washington, D.C: 2000. Guidance for Data Quality Assessment: Practical Methods for Data Analysis. Available online at: http://www.epa.gov/boston/lab/qa/projectplantool/Mod4References/SecondaryGuidance/g9-final.pdf. [Google Scholar]
- Environmental Protection Agency. Regional Screening Level (RSL) Table Res Soil April 2009. 2009 Available online at: deq.mt.gov/statesuperfund/pdfs/200904rslmaster.pdf.
- Factor-Litvak P, Wasserman G, Kline JK, Graziano J. The Yugoslavia prospective study of environmental lead exposure. Environ Health Perspect. 1999;107:9–15. doi: 10.1289/ehp.991079. [DOI] [PMC free article] [PubMed] [Google Scholar]
- Freeman GB, Schoof RA, Ruby MV, Davis AO. Bioavailability of arsenic in soil and house dust impacted by smelter activities following oral administration in cynomolus monkeys. Fundam Appl Toxicol. 1995;28:215–222. doi: 10.1006/faat.1995.1162. [DOI] [PubMed] [Google Scholar]
- Filley CK, Kellym JP. Clinical neurotoxicology and neurobehavioral toxicology. In: Sullivan JB, Krieger GR, editors. Clinical Environmental Health and Toxic Exposures. 2. Lippincott, Williams & Wilkins; Philadelphia: 2001. [Google Scholar]
- Gardosi J. New definition of small for gestational age based on fetal growth potential. Horm Res. 2006;65(Suppl 3):15–8. doi: 10.1159/000091501. [DOI] [PubMed] [Google Scholar]
- Goldman LR, Koduru S. Chemicals in the environment and developmental toxicity in children: a public health and policy perspective. Environ Health Perspect. 2000;108(Suppl 3):443–448. doi: 10.1289/ehp.00108s3443. [DOI] [PMC free article] [PubMed] [Google Scholar]
- Groom KM, Poppe KK, North RA, McCowan LM. Small-for-gestational-age infants classified by customized or population birthweight centiles: impact of gestational age at delivery. Am J Obstet Gynecol. 2007 Sep;197(3):239.e1–5. doi: 10.1016/j.ajog.2007.06.038. [DOI] [PubMed] [Google Scholar]
- Hastie TJ, Tibshirani RJ. Generalized Additive Models. Chapman & Hall/CRC; Boca Raton: 1990. [Google Scholar]
- Kwon E, Zhang H, Wang Z, Jhangri GS, Lu X, Fok N, Gabos S, Li XF, Le XC. Arsenic on the Hands of Children after Playing in playgrounds. Environ Health Perspect. 2004;112:1375–1380. doi: 10.1289/ehp.7197. [DOI] [PMC free article] [PubMed] [Google Scholar]
- Langlois PH, Brender JD, Suarez L, Zhan FB, Mistry JH, Scheuerle A, Moody K. Maternal residential proximity to waste sites and industrial facilities and concotruncal heart defects in offspring. Paediatr Perinat Epidemiol. 2009;23:321–331. doi: 10.1111/j.1365-3016.2009.01045.x. [DOI] [PubMed] [Google Scholar]
- Lanphear BP, Hornung R, Khoury J, Yolton K, Baghurst P, Bellinger DC, Canfield RL, Dietrich KN, Bornschein R, Greene T, Rothenberg SJ, Needleman HL, Schaas L, Wasserman G, Graziano J, Roberts R. Low-level environmental lead exposure and children’s intellectual function: an international pooled analysis. Environ Health Perspect. 2005;113:894–899. doi: 10.1289/ehp.7688. [DOI] [PMC free article] [PubMed] [Google Scholar]
- Li X, Lee S, Wong S, Shi W, Thornton I. The study of metal contamination in urban soils of Hong Kong using a GIS-based approach. Environ Pollut. 2004;129:113–124. doi: 10.1016/j.envpol.2003.09.030. [DOI] [PubMed] [Google Scholar]
- Liu Y, McDermott S, Lawson AB, Aelion CM. Analysis of soil concentrations of arsenic, mercury and lead and child outcomes of mental retardation and developmental delay. Int J Hyg Environ Health. 2010;213:116–123. doi: 10.1016/j.ijheh.2009.12.004. [DOI] [PMC free article] [PubMed] [Google Scholar]
- Llanos MN, Ronco AM. Fetal growth restriction is related to placental levels of cadmium, lead and arsenic but not with antioxidant activities. Reprod Toxicol. 2009;27:88–92. doi: 10.1016/j.reprotox.2008.11.057. [DOI] [PubMed] [Google Scholar]
- Luckasson R, Borthwick-Duffy S, Buntinx WHE, Coulter DL, Craig EM, Reeve A, Schalock RL, Snell ME, Spitalnik DM, Spreat S, Tassé MJ. Mental Retardation: Definition, Classification, and Systems of Supports. 10. American Association on Mental Retardation; Washington, D.C: 2002. [Google Scholar]
- Mejía JJ, Díaz-Barriga F, Calderón J, Rios C, Jiménez-Capdeville ME. Effects of lead-arsenic combined exposure on central monoaminergic systems. Neurotoxicol Teratol. 1997;19:489–497. doi: 10.1016/s0892-0362(97)00066-4. [DOI] [PubMed] [Google Scholar]
- McDermott S, Durkin MS, Schupf N, Stein ZA. Epidemiology and etiology of mental retardation. In: Jacobson JW, Mulick JA, Rojahn J, editors. Handbook of Intellectual and Developmental Disabilities. Springer Press; New York: 2007. [Google Scholar]
- Mielke HW, Gonzales CR, Powell E, Jartun M, Mielke PW., Jr Nonlinear association between soil lead and blood lead of children in metropolitan New Orleans, Louisiana: 2000–2005. Sci Total Environ. 2007;388:43–53. doi: 10.1016/j.scitotenv.2007.08.012. [DOI] [PubMed] [Google Scholar]
- Ming X, Brimacombe M, Malek JH, Jani N, Wagner GC. Autism spectrum disorders and identified toxic land fills: Co-occurrence across states. Env Health Insights. 2008;2:55–59. doi: 10.4137/EHI.S830. [DOI] [PMC free article] [PubMed] [Google Scholar]
- Murata K, Dakeishi M, Shimada M, Satoh H. Assessment of intrauterine methylmercury exposure affecting child development: messages from the newborn. Tohoku J Exp Med. 2007;213:187–202. doi: 10.1620/tjem.213.187. [DOI] [PubMed] [Google Scholar]
- Palmer RF, Blanchard S, Wood R. Proximity to point sources of environmental mercury release as a predictor of autism prevalence. Health Place. 2009;15:18–24. doi: 10.1016/j.healthplace.2008.02.001. [DOI] [PubMed] [Google Scholar]
- Patel KS, Shrivas K, Brandt R, Jakubowski N, Corns W, Hoffmann P. Arsenic contamination in water, soil, sediment and rice of central India. Environ Geochem Health. 2005;27:131–145. doi: 10.1007/s10653-005-0120-9. [DOI] [PubMed] [Google Scholar]
- Pless IB. The Epidemiology of Childhood Disorders. Oxford University Press; New York: 1994. [Google Scholar]
- Ribeiro PJ, Jr, Diggle PJ. geoR: a package for geostatistical analysis. R-News. 2001;1:15–18. Available online at: http://www.r-project.org/doc/Rnews/Rnews_2001-2.pdf.
- Rosado JL, Ronquillo D, Kordas K, Rojas O, Alatorre J, Lopez P, Garcia-Vargas G, Del Carmen Caamaño M, Cebrián ME, Stoltzfus RJ. Arsenic exposure and cognitive performance in Mexican schoolchildren. Environ Health Perspect. 2007;115:1371–1375. doi: 10.1289/ehp.9961. [DOI] [PMC free article] [PubMed] [Google Scholar]
- Ruby MV, Davis A, Schoof R, Eberle S, Sellstone CM. Estimation of lead and arsenic bioavailability using a physiologically based extraction test. Environ Sci Technol. 1996;30(2):422–430. [Google Scholar]
- [accessed April 10, 2008];Scorecard Pollution Information. www.scorecard.org/health-effects/
- Sullivan JB, Krieger GR. Clinical Environmental Health and Toxic Exposures. 2. Lippincott, Williams & Wilkins; Philadelphia: 2001. [Google Scholar]
- Tong SL, Baghurst PA, Sawyer MG, Burns J, McMichael AJ. Declining blood lead levels and changes in cognitive function during childhood: the Port Pirie Cohort Study. JAMA. 1998;280:1915–1919. doi: 10.1001/jama.280.22.1915. [DOI] [PubMed] [Google Scholar]
- Unis D, Osborn C, Diawara MM. Arsenite exposure compromises early embryonic development in the Golden hamster. Reprod Toxicol. 2009;28:329–334. doi: 10.1016/j.reprotox.2009.05.003. [DOI] [PMC free article] [PubMed] [Google Scholar]
- Vahter M. Effects of arsenic on maternal and fetal health. Annu Rev Nutr. 2009;29:381–399. doi: 10.1146/annurev-nutr-080508-141102. [DOI] [PubMed] [Google Scholar]
- Wang SX, Wang ZH, Cheng XT, Li J, Sang ZP, Zhang XD, Han LL, Qiao XY, Wu ZM, Wang ZQ. Arsenic and fluoride exposure in drinking water: children’s IQ and growth in Shanyn County, Shanxi Province, China. Environ Health Perspect. 2007;115:643–647. doi: 10.1289/ehp.9270. [DOI] [PMC free article] [PubMed] [Google Scholar]
- Wasserman GA, Liu X, Parvez F, Ahsan H, Factor-Litvak P, van Geen A, Slavkovich V, Lolacono NJ, Cheng Z, Hussain I, Momotaj H, Graziano JH. Water arsenic exposure and children’s intellectual function in Araihazar, Bangladesh. Environ Health Perspect. 2004;112:1329–1333. doi: 10.1289/ehp.6964. [DOI] [PMC free article] [PubMed] [Google Scholar]
- Wasserman GA, Graziano JH, Factor-Litvak P, Popovac D, Morina N, Musabegovic A, Vrenezi N, Capuni-Paracka S, Lekvic V, Preteni-Redjepi E, et al. Consequences of lead exposure and iron supplementation on childhood development at age 4 years. Neurotoxicol Teratol. 1994;16:233–240. doi: 10.1016/0892-0362(94)90044-2. [DOI] [PubMed] [Google Scholar]
- Wasserman GA, Liu X, Lolacono NJ, Factor-Litvak P, Kline JK, Popovac D, Morina N, Musabegovic A, Vrenezi N, Capuni-Paracka S, Lekic V, Preteni-Redjepi E, Hadzialjevic S, Slavkovich V, Graziano JH. Lead exposure and intelligence in 7-year-old children: the Yugoslavia Prospective Study. Environ Health Perspect. 1997;105:956–962. doi: 10.1289/ehp.97105956. [DOI] [PMC free article] [PubMed] [Google Scholar]
- Webster R, Oliver MA. Geostatistics for Environmental Scientists (Statistics in Practice) 2. John Wiley & Sons, Ltd; Chichester: 2007. [Google Scholar]
- Willhite CC, Ferm VH. Prenatal and developmental toxicology of arsenicals. Adv Exp Med Biol. 1984;177:205–228. doi: 10.1007/978-1-4684-4790-3_9. [DOI] [PubMed] [Google Scholar]
- Wood SN. Generalized Additive Models: An Introduction with R. Chapman & Hall/CRC; Boca Raton: 2006. [Google Scholar]
- Zakharova T, Tatano F, Menshikov V. Health cancer risk assessment for arsenic exposure in potentially contaminated areas by fertilizer plants: a possible regulatory approach applied to a case study in Moscow region-Russia. Regul Toxicol Pharmacol. 2002;36:22–33. doi: 10.1006/rtph.2002.1561. [DOI] [PubMed] [Google Scholar]
- Zhen H, Lawson AB, McDermott S, Lamichhane AP, Aelion CM. A spatial analysis of mental retardation of unknown cause and maternal residence during pregnancy. Geospat Health. 2008;2:73–182. doi: 10.4081/gh.2008.241. [DOI] [PMC free article] [PubMed] [Google Scholar]