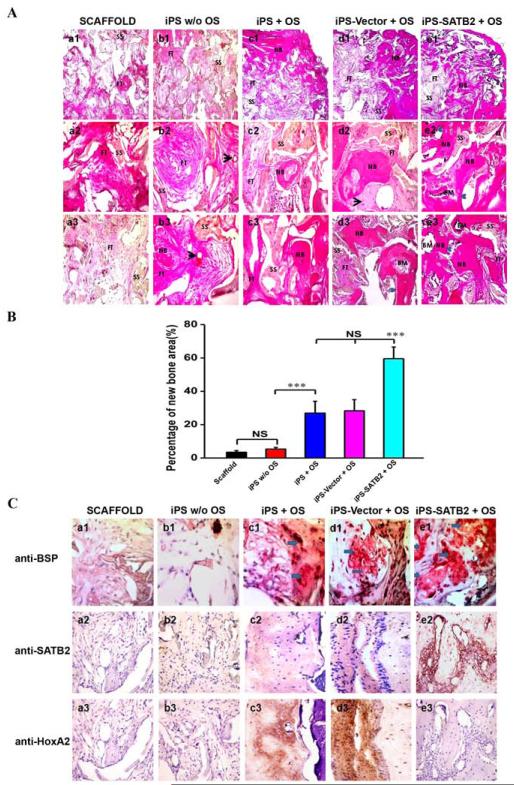
Figure 6. Histological and Immunohistochemical analysis of new bone formation.
(A) The photomicrograph of the histological images of the implants represented the differences among five groups. The cross-section images of representative slices in (a1–a3) silk scaffold alone group, (b1–b3) untransduced iPSCs without OS, (c1–c3) untransduced iPSCs with OS, (d1–d3) Vector-transduced iPSCs with OS, and (e1–e3) SATB2 transduced iPSCs with OS. The whole images of representative slices in each group (a1~e1, 40×); The center photomicrograph of the defect sites in each group (a2~e2, 200×); The edge photomicrograph of the defect sites in each group (a3~e3, 200×). BM: bone marrow; FT: fibrous tissue; NB: new bone; SS: silk scaffold. Black arrow represents blood vessels. Blue arrows show the ingrowth of osteoblasts. (B) Histomorphometrical analysis of the bone formation for five groups at 5 weeks post-operation. ***p < 0.05. (C) Immunohistochemical analysis of new bone formation in each group at 5 weeks post-operation (a-e, 400×). BSP, SATB2 and HoxA2 staining demonstrates no obvious positive staining in scaffold alone (a1~3), untransduced iPSCs without OS group (b1~3), while a weak BSP and SATB2 staining in untransduced iPSCs +OS group (c1~2) and Vector- transduced iPSCs group (d1~2), and a stronger BSP and SATB2 expression was observed in both of the bone and surrounding fibroblastic-like tissue (arrows) from SATB2-transduced iPSCs group (e1~2). However, the HoxA2 positive staining was reduced in SATB2-transduced iPSCs group (e3) compared with untransduced iPSCs +OS group (c3) or Vector- transduced iPSCs group (d3).

