Abstract
The first quadruple luminescent sensor is presented which enables simultaneous detection of three chemical parameters and temperature. A multi-layer material is realized and combines two spectrally independent dually sensing systems. The first layer employs ethylcellulose containing the carbon dioxide sensing chemistry (fluorescent pH indicator 8-hydroxy-pyrene-1,3,6-trisulfonate (HPTS) and a lipophilic tetraalkylammonium base). The cross-linked polymeric beads stained with a phosphorescent iridium(III) complex are also dispersed in ethylcellulose and serve both for oxygen sensing and as a reference for HPTS. The second (pH/temperature) dually sensing system relies on the use of a pH-sensitive lipophilic seminaphthorhodafluor derivative and luminescent chromium(III)-activated yttrium aluminum borate particles (simultaneously acting as a temperature probe and as a reference for the pH indicator) which are embedded in polyurethane hydrogel layer. A silicone layer is used to spatially separate both dually sensing systems and to insure permeation selectivity for the CO2/O2 layer. The CO2/O2 and the pH/temperature layers are excitable with a blue and a red LED, respectively, and the emissions are isolated with help of optical filters. The measurements are performed at two modulation frequencies for each sensing system and the modified Dual Lifetime Referencing method is used to access the analytical information. The feasibility of the simultaneous four-parameter sensing is demonstrated. However, the practical applicability of the material may be compromised by its high complexity and by the performance of individual indicators.
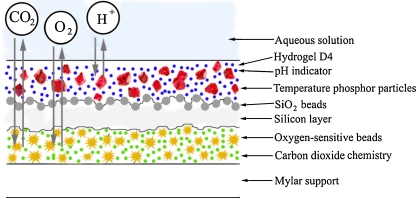
Figure.
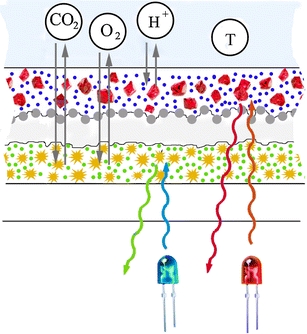
Cross-section of the multi-analyte sensor
Keywords: Optical sensor, Oxygen, pH, Carbon dioxide, Temperature, Luminescence
Introduction
Optical sensors proved to be reliable analytical tools for monitoring various chemical and biological species [1, 2]. They are only minimally invasive, are free of electromagnetic interferences, can be miniaturized rather easily and are highly versatile in their formats, which include planar optodes, sensor paints, fiber-optic (micro)sensors, and dispersible nanosensors. In many important applications, simultaneous monitoring of several parameters is highly desirable. Notably, optical sensors provide a unique possibility of multiplexing since light can carry various information simultaneously (e.g., light intensity, decay time, polarization etc.). It is not surprising that the sensors enabling simultaneous monitoring of several parameters attract considerable interest and became very popular recently [3, 4]. They are represented by two different types. The array-type sensors combine individual sensor spots [5], fiber-optic sensors [6–8], or sensing particles [9, 10] brought in close proximity. Such sensors usually possess limited resolution. On the other side, true multi-analyte sensors enable simultaneous monitoring of several parameters in exactly the same point. A variety of dually sensing materials were reported recently, most of them designed for simultaneous monitoring of one chemical parameter (mostly oxygen, but also carbon dioxide or pH) and temperature [11–19]. In fact, all optical sensors are cross-sensitive to temperature and these effects should be compensated for if temperature is not kept constant. Several sensors for simultaneous monitoring of pH and oxygen and carbon dioxide and oxygen were also reported [16, 20, 21]. Recently, Wolfbeis and co-workers reported a triple sensor for simultaneous monitoring of oxygen, pH, and temperature [22]. The sensing material relied on three types of permeation-selective microbeads mixed together in a hydrogel matrix. The three probes are excited with a violet LED and possess three distinct emissions which are separated with help of optical filters.
To the best of our knowledge, no optical sensor for simultaneous measurement of more than three parameters was reported so far. In this contribution, we will describe a novel sensing material suitable for simultaneous monitoring of four parameters including oxygen, carbon dioxide, pH, and temperature. In contrast to the sensor array (consisting of three microoptodes and a thermocouple) Paratrend® from Biomedical Sensors Ltd. [7], capable of monitoring the same four analytes, our true multi-analyte sensor is manufactured as a planar optode and can also be used for imaging purposes. The same principle can be used to design optical sensors for other analytes.
Experimental
Materials
Tetraoctylammonium hydroxide (TOAOH, 20% in methanol), sodium 8-hydroxy-pyrene-1,3,6-trisulfonate (HPTS), ethylcellulose (EC, ethoxyl content of 49%), seminaphthorhodafluor decyl ester (SNARF-DE, chromoionophore XIII) were obtained from Aldrich (www.sigmaaldrich.com). Styrene, divinylbenzene, sodium dodecyl sulfate (SDS) were bought from Fluka (www.sigmaaldrich.com). 2,2′-Azabis(2-methyl propionitrile) (AIBN) and aluminum oxide (Brockmann I) were purchased from Fisher Scientific (www.at.fishersci.com). The components for the preparation of silicone rubber: vinyl-terminated polydimethylsiloxane (DMS-V31, viscosity 1000 cSt.), methylhydrosiloxane–dimethylsiloxane copolymer (HMS-301), tetravinyltetramethyl cyclotetrasiloxane (SIT 7900.0) and platinum divinyltetramethylsiloxane complex (PC075) were obtained from ABCR (www.abcr.de). Silica gel particles (LiChrosorb® Si60, Ø 5 μm) were acquired from Merck (www.merck.de). 2-(N-morpholino)ethanesulfonic acid (MES), 3-(N-morpholino)propanesulfonic acid (MOPS), N-Cyclohexyl-2-aminoethanesulfonic acid (CHES) and sodium chloride were bought from Roth (www.carl-roth.de). The polyurethane hydrogel (available under the name HydroMed™ D4) was from AdvanSourse biomaterials (www.advbiomaterials.com). Poly(ethylene glycol terephthalate) support (Mylar®) was from Goodfellow (www.goodfellow.com). Nitrogen, oxygen, synthetic air and 5% carbon dioxide in nitrogen (all of 99.999% purity) were obtained from Air Liquide (www.airliquide.at).
Preparation of the iridium(III) acetylacetonato-bis-(3-(benzothiazol-2-yl)-7-(diethylamino)-coumarin) (Ir(CS)2acac) [23] and microcrystalline powder of chromium(III)-activated yttrium aluminum borate (Cr-YAB, Ø 2.6 ± 0.5 μm) [24] is reported elsewhere. The HPTS(TOA)3 ion pair was prepared from HPTS and tetraoctylammonium chloride, analogously to the procedure described previously [21].
Preparation of the oxygen-sensing beads
Prior to use, styrene and divinylbenzene were passed through a column packed with aluminum oxide in order to remove the inhibitors. 850 μl of styrene, 1556 μl of divinylbenzene, 22 mg of the oxygen indicator Ir(CS)2(acac) and 2 g of chloroform were dispersed in 80 ml of water containing 220 mg of SDS. The emulsion was prepared with help of a homogenizer D-1 (ART modernelabortechnik, www.miccra.com) and was further ultrasonicated for 5 min. The emulsion was placed in a 250-ml three-necked flask and deoxygenated for 20 min by blowing nitrogen through the flask under vigorous stirring. Then, 50 mg of AIBN were added and the emulsion was heated up to 90 °C. It was stirred overnight over nitrogen at this temperature. The resulting dispersion of the microbeads was centrifuged at 400 rpm in order to remove large aggregates. The remaining beads were precipitated with ethanol and were washed twice with acetone and three times with ethanol to remove the surfactant and the dye adsorbed on the surface. The beads were dried in the Petri dish and homogenized in the agate mortar.
Preparation of the multi-analyte sensor
CO2/O2 layer: 50 mg of the oxygen-sensing beads and 20 mg of EC49 were dispersed/dissolved in 400 mg of ethanol. In the second vial, 2.5 mg of HPTS(TOA)3 and 80 mg of EC 49 were dissolved in the mixture of 1 g of tetrahydrofurane and 600 mg of ethanol. Carbon dioxide was purged through the “cocktail” and 100 μl of methanolic TOAOH solution was added. The two “cocktails” were mixed together and were knife-coated onto a dust-free polyester support using a 75-μm spacer to result in ∼6-μm-thick sensing layer after solvent evaporation.
Silicone isolation layer: the “cocktail” of silicone primers was obtained by mixing 400 mg of the vinyl-terminated PDMS, 16 μl of methylhydrosiloxane–dimethylsiloxane copolymer, 3 μl of tetravinyltetramethyl cyclotetrasiloxane, and 5 μl of the platinum complex catalyst in 400 mg of hexane. The “cocktail” was coated onto the CO2/O2 layer (25 μm spacer) and left to polymerize at room temperature for 20 min. Then, silica gel particles (Ø 5 μm) were spread on the partly polymerized surface and the material was left at ambient air for another 2 h. The excess of the particles was removed mechanically.
pH/temperature layer: 150 mg of hydrogel D4 and 150 mg of Cr-YAB were dissolved/dispersed in the mixture of 900 mg of ethanol and 100 mg of water. Three hundred microliters of the stock solution of SNARF-DE in ethanol (1 mg⋅ml−1) was added. The “cocktail” was knife-coated on the silicone layer (75 μm spacer) to result in ∼10 μm thick sensing layer after solvent evaporation. In order to prevent poisoning by acidic gases and prolong the sensor lifetime, the planar optodes were stored at −18 °C in a sealed plastic bag filled with 100% carbon dioxide.
Measurements
Emission spectra were acquired on a Hitachi F-7000 fluorescence spectrometer (www.hitachi.com) equipped with a red-sensitive photomultiplier R 928 from Hamamatsu (www.hamamatsu.com). Absorption spectra were measured on a Cary 50 UV–Vis spectrophotometer (www.lzs-concept.com).
The size of the beads was estimated from the photographic images acquired on a Zeiss Axiovert 25 CFL microscope (Zeiss, www.zeiss.de) using a SensiCAM camera (cooled CCD-chip, 640 × 480 pix, www.pco.de).
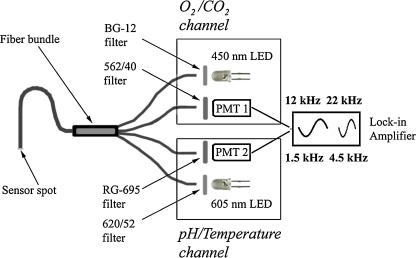
Interrogation of the multi-analyte sensor was performed using a home-made device which is schematically represented in Fig. 1. The device consists of two separate detection channels each of them equipped with a photomultiplier module (H9306-02 from Hamamatsu, www.sales.hamamatsu.com) and an LED. A 450 nm LED (Roithner, www.roithner-laser.com) combined with a short-pass BG-12 filter (Schott, www.schott.com) is used for excitation in the O2/CO2 channel and the emission is filtered through the HC 562/40 band-pass filter (Analysentechnik, www.ahf.de). Excitation in the pH/temperature channel is performed with a 605 nm LED (Roithner) combined with a HC 620/52 band-pass filter (Analysentechnik) and the emission is filtered through an RG-695 long-pass filter from Schott. The LEDs are sinusoidally modulated using a two-phase lock-in amplifier (SR830, Stanford Research Inc., www.thinksrs.com). The interrogation in each channel is performed at two different modulation frequencies: 12 and 22 kHz in the O2/CO2 channel and 1.5 and 4.5 kHz in the pH/temperature channel. A four-armed optical fiber bundle (LEONI Prinz Fiber Optics GmbH, www.leoni-fiber-optics.com) is used to guide the excitation light to the sensor and to guide back the emission.
Fig. 1.
Schematic representation of the home-made device and the optical arrangement for interrogation of the multi-analyte sensor
The pH was adjusted to the desired value using CHES, MES, and MOPS buffers. The pH of the buffer solutions was controlled by a digital pH meter (InoLab pH/ion, WTW GmbH & Co. KG, www.wtw.com) calibrated at 25 °C with standard buffers of pH 7.0 and 4.0 (WTW GmbH & Co. KG, www.wtw.com). The buffers were adjusted to constant ionic strength (IS = 0.2 M) using sodium chloride as the background electrolyte. Temperature was controlled by a cryostat ThermoHaake DC50. At least three independent measurements were performed to obtain a calibration curve.
Results and discussion
General considerations
In order to demonstrate the feasibility of simultaneous monitoring of four parameters with a single sensor, we chose the three analytes (carbon dioxide, oxygen, and pH) describing many metabolic processes to be combined with the detection of temperature. Evidently, determination of these parameters is of much importance in many areas of science and technology, for example in biology, marine chemistry, biotechnology, environmental monitoring, and medicine. Temperature was an obvious choice since all optical chemosensors are affected by temperature and should be corrected for these effects if temperature is not kept constant. In fact, the combination of these parameters was realized in the Paratrend® sensor from Biomedical Sensors Ltd [7, 25, 26]. The sensor represented an array of three fiber-optic sensors (for oxygen, carbon dioxide and pH) combined with a thermocouple for temperature compensation. Due to the large number of analytes and rather small dimensions (Ø 0.5 mm) the sensor was quite complex in manufacturing. On the contrary, the multi-analyte sensor technology seems to be rather attractive since many identical sensor spots can be easily prepared from the planar sensors even if the design of such a sensor is rather complex.
Evidently, the sensor architecture is expected to become increasingly sophisticated with the increasing number of analytes that need to be analyzed simultaneously. In other words, a multi-analyte sensor cannot be a simple combination of the individual probes for several reasons. First, permeation selectivity should be insured. For example, a carbon dioxide optical probe (which relies on the use of a fluorescent pH indicator) should not be influenced by pH of the analyzed solution. Second, interferences originating from reabsorption of the emitted light or from Föster resonance energy transfer should be avoided. To avoid FRET spatial isolation of the indicators is necessary. This can be realized by using a multi-layer approach or by immobilizing the sensor chemistries in nano- or microbeads. Third, photophysical properties of the indicators are crucial for their choice since separation of the signals from individual indicators is required. This can be achieved either spectrally (for the indicators having substantially different excitation and emission spectra) or via the decay time. Due to the limited amount of luminescent indicators available, it is extremely difficult to choose more than two pairs of probes with adequate characteristics (sensitivity, selectivity, chemical stability, photostability) and substantially different spectral properties. Evidently, a combination of the spectral separation and the separation by the decay time is obvious for designing a multi-analyte sensor. Finally, signal referencing is necessary in order to obtain a reproducible sensing material. For example, the luminescence decay time is a self-referenced parameter, but the fluorescence intensity is not. It depends on the number of parameters such as intensity of the light source and sensitivity of the photodetector, scattering in the sensor, turbidity and coloration of the probe, etc. Therefore, the luminescence intensity is usually referenced either ratiometrically or using the so called dual lifetime referencing technique [27, 28]. As was demonstrated previously [20, 29], the long-lived luminescence cannot only be used for referencing of the short-lived fluorescence, but also to sense an additional analyte.
Sensor design and materials used
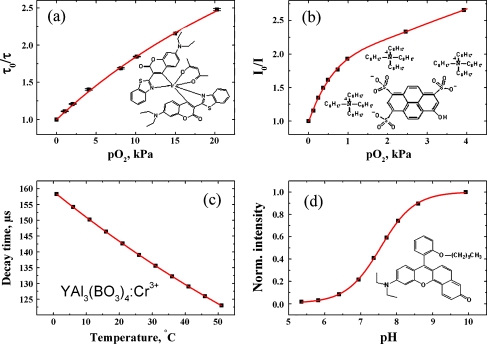
Figure 2 shows the chemical structures and the response of the 4 probes chosen for combination in the multi-analyte sensor. As can be seen, the individual probes enable monitoring of the analytes in physiologically relevant range. They are also adequate for determination of the same analytes in sea water. A cross-section of the multi-analyte sensor is schematically shown in Fig. 3. The sensor consists of the two sensing layers (CO2/O2 and pH/temperature) which are spatially isolated with help of the silicone layer. The first layer is designed to enable simultaneous sensing of carbon dioxide and oxygen. The carbon dioxide sensing chemistry is based on the established system [30] and includes the lipophilic ion pair of 8-hydroxy-pyrene-1,3,6-trisulfonate and tetraoctylammonium cation (HPTS(TOA)3) and an excess of the lipophilic base TOAOH (converted into hydrocarbonate in presence of carbon dioxide) which are dissolved in ethyl cellulose (49% w/w of the ethoxyl groups). Such composition is known to result in rather sensitive sensors. To produce less sensitive sensors (e.g., for blood analysis) tetraoctylammonium hydroxide may be substituted by tetrabutylammonium hydroxide [31] and the EC 49 by EC 46 (46% w/w of the ethoxyl groups) which is known to have lower solubility of carbon dioxide [32].
Fig. 2.
Chemical structures and the analyte response of the individual probes: a Ir(CS)2(acac) embedded in poly(styrene-co-divinylbenzene) beads, obtained at 20 °C; b HPTS(TOA)3 + TOAOH in EC49, obtained at 25 °C; c Cr-YAB particles dispersed in hydrogel D4; d SNARF-DE in hydrogel D4, obtained at 25 °C
Fig. 3.
Cross-section of the multi-analyte sensor (not to scale)
A phosphorescent iridium(III) coumarin complex Ir(CS)2acac [23] was the oxygen indicator of choice because of its high brightness and good spectral compatibility to HPTS. Simple addition of the oxygen indicator into ethylcellulose is undesirable since (1) basic tetraoctylammonium hydrocarbonate may affect the stability of the iridium(III) complex, and (2) photostability of HPTS is expected to deteriorate dramatically due to the photoinduced formation of singlet oxygen. Therefore, the oxygen indicator was embedded into highly cross-linked polymeric microbeads. These polymeric beads are prepared by the emulsion polymerization of styrene and divinylbenzene and virtually do not swell in common organic solvents. This insures that the indicator remains inside the beads when they are dispersed in the ethylcellulose/tetrahydrofurane/ethanol “cocktail”. Additionally, as will be demonstrated below, oxygen sensitivity is significantly enhanced compared to the polystyrene-based materials. Typical dimensions of the beads (estimated from the microscopic images) are 3–8 μm. The beads of 3–5 μm in diameter are usually adequate to produce a highly homogeneous sensor layer. Although the larger beads (Ø 6–8 μm) are expected to exceed the thickness of the layer, this effect is not visible when interrogating a sensor spot with an optical fiber of several millimeters in diameter.
Evidently, an additional protecting layer is required for the CO2 sensor to be usable in aqueous solutions. Ionic species (particularly protons or hydroxide ions) can diffuse inside and influence the calibration plots by interacting with the sensor components. A hydrophobic silicone rubber seems to be an excellent choice to ensure the permeation selectivity. In fact, polydimethylsiloxanes possess very high permeability to gases but do not let the ionic species through. Additionally, apolar polydimethylsiloxane is an extremely bad solvent for virtually any dye. Therefore, the diffusion of the indicators from the CO2/O2 layer into the pH/temperature layer or in the reverse direction becomes impossible. A serious problem arising here is very poor adhesion of the hydrophilic hydrogel layer (pH/temperature) on the highly hydrophobic silicone. Initial attempts were focused on hydrophilization of the silicone surface by plasma treatment in the atmosphere of air which is a widespread method of polymer surface modification [33]. Unfortunately, it was found that even using the moderate settings the CO2/O2 sensing layer was severely affected by the modification resulting in irreproducible drift in the calibration plots. Therefore, the surface modification was performed in the following manner. First, the mixture of the silicone primers and the catalyst was diluted with hexane (which does not swell the CO2/O2 layer) to adjust the thickness of the layer, and the composition was spread onto the CO2/O2 layer and was allowed to partly polymerize. Then, silica gel beads (Ø 5 μm) were spread on the surface of the silicone to be entrapped there. Thus, the beads not only increased the overall surface of the silicon layer but also improved the hydrophilicity of the layer. It should be noted here that neither the monolayer of silica beads dispersed on the surface of the silicon layer nor the cross-linked oxygen-sensitive beads contained in the first layer prevent the excitation light from reaching the pH/temperature layer and the emission from this layer from reaching the detector. Some light scattering caused by the beads does not necessarily reduce the luminescence but can even enhance it similarly to the effect produced by scattering TiO2 particles dispersed in the optical sensors [34].
Finally, a third pH/temperature sensing layer relied on a lipophilic pH indicator dissolved in the polyurethane hydrogel (HydroMed™ D4) and the chromium(III)-doped yttrium aluminum borate phosphor particles dispersed in the same material. The phosphor serves as a reference for the pH indicator and as a temperature probe. It is important that the hydrogel (which has been widely used in optical pH sensors) [19, 20] is permeable for all the analyzed species including protons, oxygen and carbon dioxide. Considering possible alternatives to Cr-YAB other thermographic phosphors (e.g., rubi), in principle, can be used in the multi-analyte sensor. However, Cr-YAB shows superior temperature sensitivity compared to other phosphors [24]. As will be demonstrated in the following, spectral compatibility of the probe with the pH indicator and the red LED is essential for application in the multi-analyte sensor so that Cr-YAB is an evident choice here. Notably, other thermographic phosphors are not excitable with red light. Chromium(III)-doped yttrium aluminum garnet represents an exception (the excitation spectrum is similar to that of Cr-YAB) but its brightness is very low [24].
Spectral properties of the probes and optical set-up
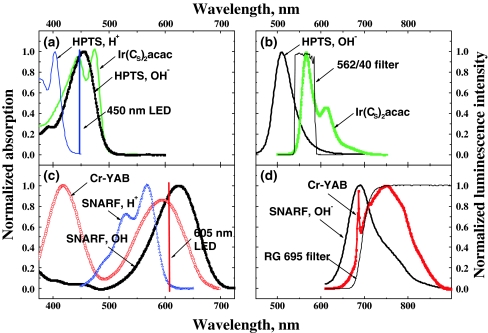
Figure 4 depicts the absorption and emission spectra of the probes as well as the emission spectra of the LEDs and the transmittance spectra of the optical filters. As was mentioned above, a fluorescent and a phosphorescent probe can be combined together, the latter serves also as a reference for the fluorescent one. Therefore, the four-parameter sensor can be viewed as a combination of two dual sensors which are spectrally independent on each other. Both HPTS in its basic form and the Ir(CS)2acac are efficiently excitable with a 450 nm LED (Fig. 4a). Notably, the absorption maximum of HPTS in its acidic form (in the presence of CO2) is located at ∼400 nm so that this form of the dye is not excitable with the blue LED. On the other hand, the blue LED does not excite the pH indicator in the hydrogel layer, and the Cr-YAB is excitable only to a minor extent (Fig. 4c). Both the pH indicator in its basic form and the temperature phosphor are excitable with the red 605-nm LED. Notably, neither the acidic form of the pH indicator nor the components of the CO2/O2 sensing system are excitable with the red LED. Two additional filters for the emission ensure complete separation of the luminescence signals from both systems (Fig. 4b, d). A band-pass interference filter (542–582 nm) is used for the CO2/O2 system and completely eliminates the emissions of the pH indicator and the temperature phosphor which can be excited either directly with the blue LED or indirectly (reabsorption of the light emitted by the CO2/O2 system). Finally, a long-pass RG 695 filter is used to isolate the emissions of SNARF-DE and Cr-YAB.
Fig. 4.
Spectral properties of the materials and optical components used in the multi-analyte sensor: a the absorption spectra of the pCO2 and pO2 probes; b the emission spectra of the same probes; c the absorption spectra of the pH and temperature probes; and d the emission spectra of the same probes. For convenience, the emission spectra of the LEDs and the transmittance spectra of the optical filters are also shown within on same scale
Method
A modified Dual Lifetime Referencing method [29] was used to obtain the unbiased signals in each pair of probes. Measurement at two modulation frequencies (12 and 22 kHz for the CO2/O2 sensor and 1.5 and 4.5 kHz for the pH/temperature sensor) provides the decay times for the phosphorescent component (in our case of the oxygen indicator and of the temperature probe, respectively) which are independent on the amount of fluorescence:
 |
1 |
where Φ 1 and Φ 2 are the overall phase shifts at modulation frequencies f 1 and f 2.
Once the decay times of the long-lived component are known, the phase shifts for this component can be calculated (Φ phos = arctan(2π⋅f⋅τ)) and the following equation be used to access the amplitude of the fluorescent indicator (A fluor) [35]:
 |
2 |
The amplitude of the phosphorescent indicator (A phos) is determined from the calibration plots obtained for luminescence intensity: A phos = I phos⋅dm, where dm is demodulation.
It should be mentioned here that although we used the frequency domain method, the sensor can also be interrogated in the time domain [36, 37] and used for 2D imaging of the analyte distribution.
Apparatus
The measuring unit (Fig. 1) is composed of 2 PMTs, a lock-in amplifier and a 4-armed optical fiber. Evidently, the current interrogation set-up is not compact which may be inconvenient for practical applications. A much more compact device can be constructed if the PMTs are substituted by photodiodes. Further, the four-armed optical fiber can be replaced with a two-armed fiber combined with a dichroic mirror. As far as the excitation sources are concerned, the two LEDs can be replaced by a single dually emitting blue/red LED or an RGB-LED in which two colors (blue and red) can be used for interrogation of the sensor. In case of commercially available dually emitting LEDs (see e.g., www.pur-led.de) the emission wavelengths (λ max 465 and 625 nm) are not completely identical to those used in the current set-up but they are still adequate for interrogation of the probes. It should be mentioned here that in case of dually emitting or RGB LEDs the use of a color subtraction filter along with a long-pass filter is likely to be necessary in order to eliminate the long-wavelength emission component of the blue light. Such filters (absorbing the light between 500 and 615 nm) are commercially available (see e.g., www.edmundoptics.com).
Temperature sensing
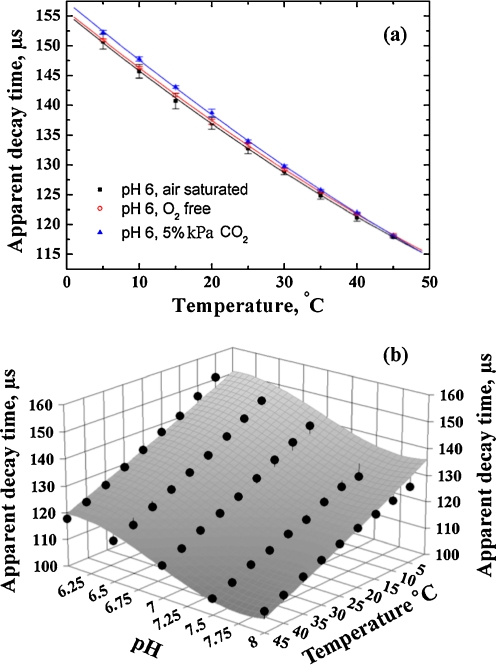
Figure 5 shows the calibration plots for temperature. As can be observed, the decay time of the temperature probe calculated according to Eq. 1 is influenced neither by oxygen nor by carbon dioxide. This demonstrates that carefully selected optical properties of the indicators, excitation sources and optical filters completely eliminate possible optical cross-talk from the O2/CO2 system. On the other hand, pH of the solution significantly affects the temperature calibration plots (Fig. 5b). Since the temperature probe itself is completely inert to pH changes, the origin of this cross-sensitivity originates entirely from the calculation algorithm. In fact, Eq. 1 is valid only for indicators having strictly mono-exponential luminescence decay and a deviation from this will result in error in decay time determination. As one can observe, the calculated decay time decreases at higher pH, i.e., when the amount of fluorescence increases. Based on this observation, decreasing of the amount of the pH indicator relative to the temperature probe may minimize this cross-talk. Nevertheless, since the pH is determined as well, the cross-talk can be easily compensated for. This can be performed, e.g., with the help of a 3D calibration plot shown in Fig. 5 which describes the dependency of the calculated decay time on both temperature and pH. Evidently, several iterations are required to obtain the correct temperatures and pH values. It should also be mentioned here that if the sensor is interrogated in time domain, the short-lived fluorescence is eliminated completely after a short delay and cannot affect the luminescence decay of the long-lived temperature probe. Therefore, no cross-talk to pH is expected to be observed with this method.
Fig. 5.
Calibration plots for the temperature probe in the multi-analyte sensor: a at varying oxygen and carbon dioxide content; b at varying pH. The luminescence decay times are calculated using Eq. 1 (modulation frequencies 1.5 and 4.5 kHz). The fit of the 3D dependency is performed in the Table Curve 3D software using the following empirical equation: τ = a + b⋅(T) + c⋅(T)2 + d⋅(pH) + e⋅(pH)2 + f⋅(pH)3, where a–f are numerical coefficients
Sensing of pH
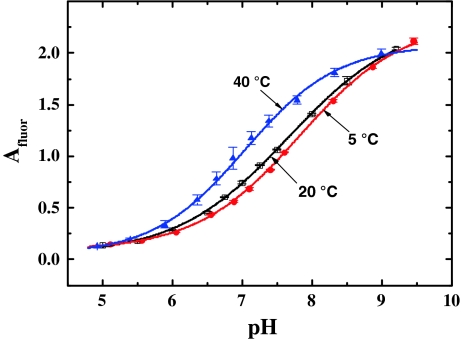
Figure 6 shows the calibration plots obtained for the pH probe at different temperatures. The amplitude of the pH probe (A fluor) represents a referenced parameter which does not depend on such settings as the intensity of excitation light, PMT voltage etc. Evidently, knowing temperature is essential here, since the phase angle of the temperature probe Φ phos and the amplitude of the same probe A phos in Eq. 2 are determined by the luminescence decay time. It is also evident that temperature has pronounced influence on the acidity constant of the pH indicator and the pK a decreases as the temperature increases. Therefore, it is absolutely essential to know temperature for precise determination of pH with the luminescent sensors. The pK a value of the pH probe at 20 °C was found to be 7.7. Considering this value, the sensor retains sufficient dynamics both at pH intervals of 6.5–7.5 and 7.5–8.5, and thus, is potentially suitable for physiological measurements and for applications in marine science, respectively.
Fig. 6.
Temperature dependence of the calibration plots of the pH probe in the multi-analyte sensor (modulation frequency f = 1.5 kHz, air saturation, 0% CO2)
It should be mentioned here that optical pH sensors are known to be cross-sensitive to ionic strength. This cross-sensitivity can vary from very high (in case of highly charged indicators [38]) to virtually negligible [39]. Cross-sensitivity to ionic strength also is influenced by the nature of polymer and typically is higher for the polymers bearing charged groups rather than for neutral ones such as hydrogel D4. Previously, we demonstrated that in case of seminaphthorhodafluor decylester, which is also used in this work, the cross-sensitivity to ionic strength is very low [19]. In fact, the change in the apparent pK a value does not exceed 0.1 units on going from 0.1 to 0.72 mM. Since the ionic strength does not influence the performance of the carbon dioxide, oxygen, and temperature probes, the overall effect on the performance of the multi-analyte sensor is virtually negligible.
Oxygen sensing
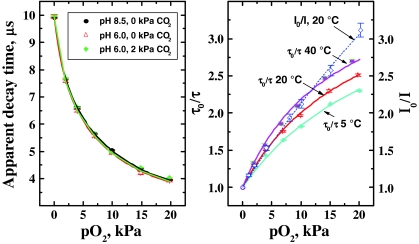
Figure 7 demonstrates the calibration plots obtained for the oxygen probe in the multi-analyte sensor. As can be seen, the calculated decay times of the oxygen probe are not influenced by the pH of the analyzed solution. Carbon dioxide partial pressure does not influence the calculated decay time of the oxygen probe either which confirms that Eq. 1 works very well in this case. On the other hand, temperature affects the decay times of the phosphorescent indicator (τ 0 = 10.05, 9.93, and 9.58 μs at 5, 20, and 50 °C, respectively) and has a pronounced effect on the Stern–Volmer plots (Fig. 7, right). This behavior is typical for luminescent oxygen indicators dissolved in polymeric matrices. As can be observed, the Stern–Volmer plots are not linear which indicates localization of the indicator in two regions having substantially different microenvironments. The so called “two-site model” proposed by Demas and co-workers is commonly used to describe such behavior [40]:
 |
3 |
where f and 1 − f are the fractions of the total emission for the first and the second component, respectively, and K 1SV and K 2SV are the Stern–Volmer constants for each component. We used the simplified equation (the K 2SV is assumed to be 0) to fit the decay time plots. Despite the fact that Eq. 3 has physical meaning only for the ratio of luminescence intensities and not for the decay times, the fit was found to be adequate (correlation coefficient > 0.998). The coefficient f is calculated to be 0.76 ± 0.02 for all the temperatures and the K SV constant are 0.150, 0.194, and 0.25 kPa−1 for 5, 20, and 40 °C, respectively. Notably, the sensitivity to oxygen for the iridium(III) coumarin embedded into the cross-linked beads is significantly higher than for the same dye in polystyrene [23] (K SV = 0.043 kPa−1; τ 0/τ = 1.59 at 25 °C and 19.8 kPa) which is likely to be due to higher free volume in the cross-linked beads.
Fig. 7.
Calibration plots for the oxygen probe in the multi-analyte sensor: left lifetime dependencies at varying pH and pCO2; right Stern–Volmer plots at three different temperatures. The decay times are calculated according to Eq. 1 (modulation frequencies 12 and 24 kHz)
Carbon dioxide sensing
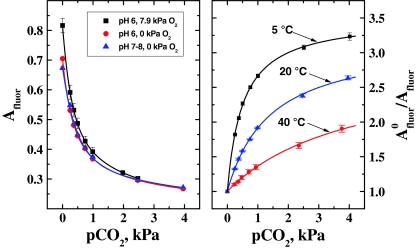
The calibration curves for carbon dioxide sensing are shown in Fig. 8. Evidently, the calibration is not influenced by pH. However, the amplitude of the carbon dioxide probe was found to be affected by oxygen. Since oxygen has no effect on the fluorescence intensity of the HPTS(TOA)3 it is evident that Eq. 2 is not fully adequate in this case. In fact, Φ phos depends on the decay time of the oxygen indicator and A phos depends both on its decay time (which is used to calculate the demodulation) and luminescence intensity. The latter parameter should be determined independently for the oxygen probe alone (Fig. 7, right). The potential errors arise from the fact that the above frequency domain algorithm allows calculating only the average decay times of the oxygen probe which is only a rough approximation. However, some deviation from mono-exponential behavior is likely in the presence of oxygen and this effect is not easily predictable. Therefore, it is easier to empirically compensate the cross-talk to oxygen since its partial pressure is known. It is also quite evident that temperature dramatically affects the sensitivity of the carbon dioxide sensor (Fig. 8, right) which decreases when temperature is increased. Such behavior of “plastic” carbon dioxide sensors is well documented in the literature [30] but is rarely compensated for. In terms of sensitivity, the sensor is suitable for monitoring of atmospheric carbon dioxide albeit with rather low sensitivity (A 0/A = 1.06 and 1.18 at 20 and 5 °C, respectively). Further improvement in sensitivity of the HPTS-based sensors is rather problematic so that other fluorescent indicators with higher pK a values may be needed. Indeed, as was demonstrated by Mills and Chang for the triphenylmethane dyes the sensitivity of the plastic carbon dioxide sensors improves with increase in pK a values [41]. Unfortunately, the fluorescent pH indicators with pK a values higher than that of HPTS are not readily available. On the other hand, the sensitivity of the sensor can be reduced (to make it more adequate for measurements of blood gases) by using ethylcellulose with lower ethoxyl content and by using less bulky quaternary ammonium bases.
Fig. 8.
Calibration plots for carbon dioxide probe in the multi-analyte sensor: left at varying pO2 and pH; right at varying temperature
Response times
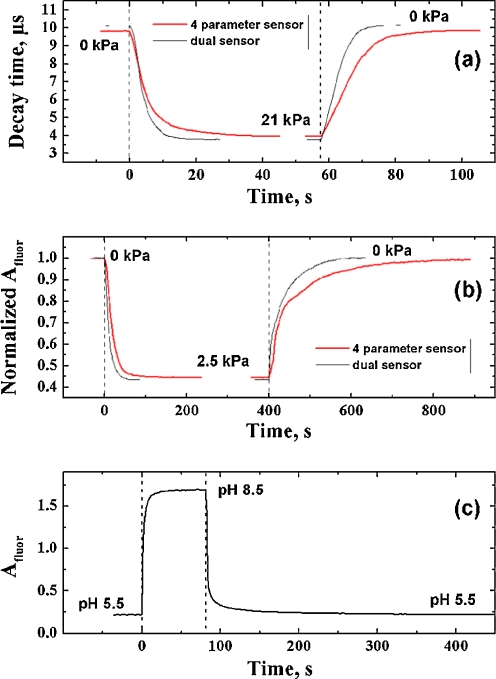
One of the potential problems associated with the multi-layer sensors is their longer dynamic response. Figure 9 shows the response and recovery curves for varying pO2, pCO2, and pH. As can be seen, the additional pH/temperature layer and silica gel beads significantly increase the response and the recovery times for oxygen and carbon dioxide compared to the dual pO2/pCO2 sensor. In fact, t 95 values (time needed for 95% of the signal change to occur) were found to be 10 s (0 kPa O2 → 21 kPa O2) and 12 s in the reverse direction for the dual sensor and 19 and 22 s, respectively, for the multi-analyte sensor. The sensor responds slower to carbon dioxide and the t 95 values are 35 s (0 kPa CO2 → 2.5 kPa O2) and 122 s in the reverse direction for the dual sensor and 49 and 274 s, respectively, for the multi-analyte sensor. Much slower recovery times for carbon dioxide are explained by high sensitivity of the sensor so that even small remaining concentrations of CO2 still produce significant drop in the amplitude.
Fig. 9.
Response of the multi-analyte sensor to changes in pO2 (a), pCO2 (b) and pH (c). The response to all analytes is measured in aqueous solutions at RT
Considering the response of the multi-analyte sensor to pH, the diffusion in the outer pH/temperature layer is not influenced by the O2/CO2 layer so that the sensor responds virtually identical to the dual sensor. The t 95 values were found to be 12 s for changing from pH 5.5 to 8.5 and 34 s in the reverse direction.
Due to the physical nature of the process which does not involve the diffusion of the analytes the response of the multi-analyte sensor to temperature can be, in principle, very fast. Evidently, it is limited by the time needed for the sensor to warm or to cool. Therefore, this value will depend on the thickness of the Mylar support (which significantly exceeds the thickness of the sensing layers) but also on the form and diameter of an optical fiber used.
Chemical and photochemical stability
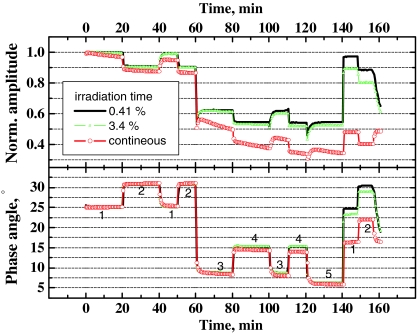
Evidently, any multi-analyte sensor is expected to inherit the problems associated with the individual probes. Therefore, chemical and photochemical stability of the indicators should always be considered. For example, all optical carbon dioxide sensors are irreversibly poisoned by some acidic gases such as HCl. The sensors show cross-sensitivity to other acidic gases, e.g., SO2 or H2S. When slowly oxidized by oxygen, these species may irreversibly poison the sensor. As a consequence, the carbon dioxide sensors are also cross-sensitive to sulfite and sulfide ions present in solution [42]. Therefore, to avoid poisoning in the lab atmosphere the sensors are best stored in a sealed pack filled with carbon dioxide. On the other side, the stability of the pH indicator SNARF-DE deteriorates at pH > 10 due to hydrolysis of the ester bond. These limitations should be always considered. The oxygen and the temperature probes are much more robust chemically but for the former photobleaching can be a critical issue as discussed in the following. Moreover, the photobleaching of the other probes may be enhanced in the multi-analyte sensor, e.g., due to production of singlet oxygen. Consequently, the probes located in the proximity to the pO2 probe (in our case HPTS(TOA)3 for carbon dioxide measurements) may show much faster photobleaching. Figure 10 provides an example how photobleaching affects the calibration of the pO2/pCO2 dual sensor (and, similarly, the multi-analyte sensor). As can be seen, photobleaching affects the luminescence amplitude to a much higher extent than the luminescence phase shift. This indicates that the photobleaching rates of both probes are similar and the ratio of the two luminescences does not change significantly. The iridium(III) coumarin complex still shows slightly faster bleaching rates than HPTS(TOA)3 since the overall phase shift decreases. As expected, the sensor drift depends on the overall irradiation time. The drift is rather fast if continuous irradiation is performed. In case of 200 ms irradiation (sufficient for acquiring phase shifts at two modulation frequencies) for each 6 s the drifts are much slower. Finally, virtually no drift is observed after 2.5 h if the acquisition is performed once in 50 s. It is also evident that photobleaching is much faster in presence of oxygen which confirms that singlet oxygen plays an important role in photobleaching pathways. Therefore, addition of singlet oxygen scavengers or quenchers [43] may significantly reduce the photobleaching rates but possible effects on the sensor chemistries (e.g., quenching) should be considered. On the first glance, it is also evident that the use of more photostable indicators will reduce the drifts caused by photobleaching. However, this is only true if the photostability of both indicators is improved to a similar extent. Significant improvement in the photostability of a single probe is expected to have a negative effect since the bleaching will result in faster change of luminescence ratio.
Fig. 10.
The effect of photobleaching on the overall amplitude and overall phase shift (f = 12 kHz) for the dual pO2/pCO2 sensor excited with the 605-nm LED. Conditions: 1 0 kPa O2, 0 kPa CO2; 2 0 kPa O2, 2 kPa CO2; 3 12 kPa O2, 0 kPa CO2; 4 12 kPa O2, 2 kPa CO2; 5 20 kPa O2, 0 kPa CO2
In case of the multi-analyte sensor, the temperature probe is virtually inert to photobleaching and it does not generate singlet oxygen so the drift in the calibration is determined by the photostability of the pH indicator. Singlet oxygen produced by the oxygen probe does not affect the pH indicator since the diffusion ways are too long and the lifetime of singlet oxygen is rather short. However, considering other sensor designs (e.g., when all the probes are contained in a single layer) the bleaching by photosensitized singlet oxygen is expected to affect all the probes.
Conclusions
A quadruple sensor is reported for the first time and the proof of concept is demonstrated. The sensor is capable of monitoring important chemical parameters and temperature which allows the other three probes to be compensated for the temperature effects. Two spatially separated sensing layers (pO2/pCO2 and pH/temperature) are interrogated independently by using a pair of LEDs and emission filters. The spectral properties of the indicators in each layer are carefully chosen to enable simultaneous excitation of both probes and simultaneous monitoring of the emission and to avoid optical interferences with the probes in the other sensing layer. Each layer contains a fluorescent probe (for pCO2 and pH, respectively) and a probe with a long-lived luminescence (for pO2 and temperature, respectively) which also serves as a reference for the fluorescent probe. The decay times of the luminescent probes are extracted from measurements at two modulation frequencies. The interrogation algorithms are adequate but some empirical correction is necessary presumably due deviation of the luminescence decay profiles from mono-exponential law. It is found that an additional outer pH/temperature layer roughly doubles the response times of the multi-analyte sensor to oxygen and carbon dioxide compared to the response of the dual pO2/pCO2 sensor. Photobleaching of the probes is found to alter the calibration plots and should be taken in consideration. Particularly, photodegradation of both pO2 and pCO2 probes is much faster in presence of oxygen. The multi-analyte sensor can be suitable for monitoring of chemical parameters in marine research and for analysis of blood gases and other applications are certainly possible.
Acknowledgment
The financial support from Austrian Science Fund FWF is gratefully acknowledged (Project M-1107-N22).
Open Access
This article is distributed under the terms of the Creative Commons Attribution Noncommercial License which permits any noncommercial use, distribution, and reproduction in any medium, provided the original author(s) and source are credited.
Footnotes
Published in the special issue Analytical Sciences in Austria with Guest Editors G. Allmaier, W. Buchberger, and K. Francesconi.
References
- 1.McDonagh C, Burke CS, MacCraith BD. Chem Rev. 2008;108:400–422. doi: 10.1021/cr068102g. [DOI] [PubMed] [Google Scholar]
- 2.Wolfbeis OS. J Mater Chem. 2005;15:2657–2669. doi: 10.1039/b501536g. [DOI] [Google Scholar]
- 3.Nagl S, Wolfbeis OS. Analyst. 2007;132:507–511. doi: 10.1039/b702753b. [DOI] [PubMed] [Google Scholar]
- 4.Stich MIJ, Fischer LH, Wolfbeis OS. Chem Soc Rev. 2010;39:3102–3114. doi: 10.1039/b909635n. [DOI] [PubMed] [Google Scholar]
- 5.Li L, Walt DR. Anal Chem. 1995;67:3746–3752. doi: 10.1021/ac00116a021. [DOI] [PubMed] [Google Scholar]
- 6.Weigl BH, Holobar A, Trettnak W, Klimant I, Kraus H, O’Leary P, Wolfbeis OS. J Biotechnol. 1994;32:127–138. doi: 10.1016/0168-1656(94)90175-9. [DOI] [PubMed] [Google Scholar]
- 7.Hwang EY, Pappas D, Jeevarajan AS, Anderson MM. Biomed Microdevices. 2004;6:241–249. doi: 10.1023/B:BMMD.0000042054.02940.b6. [DOI] [PubMed] [Google Scholar]
- 8.Pasic A, Koehler H, Klimant I, Schaupp L. Sens Actuators B. 2007;122:60–68. doi: 10.1016/j.snb.2006.05.010. [DOI] [Google Scholar]
- 9.Walt DR. Chem Soc Rev. 2010;39:38–50. doi: 10.1039/b809339n. [DOI] [PubMed] [Google Scholar]
- 10.LaFratta CN, Walt DR. Chem Rev. 2008;108:614–637. doi: 10.1021/cr0681142. [DOI] [PubMed] [Google Scholar]
- 11.Coyle LM, Gouterman M. Correcting lifetime measurements for temperature. Sens Actuators, B. 1999;61:92–99. doi: 10.1016/S0925-4005(99)00289-0. [DOI] [Google Scholar]
- 12.Zelelow B, Khalil GE, Phelan G, Carlson B, Gouterman M, Callis JB, Dalton LR. Sens Actuators, B. 2003;96:304–314. doi: 10.1016/S0925-4005(03)00547-1. [DOI] [Google Scholar]
- 13.Hradil J, Davis C, Mongey K, McDonagh C, MacCraith BD. Meas Sci Technol. 2002;13:1552–1557. doi: 10.1088/0957-0233/13/10/307. [DOI] [Google Scholar]
- 14.Borisov SM, Wolfbeis OS. Anal Chem. 2006;78:5094–5101. doi: 10.1021/ac060311d. [DOI] [PubMed] [Google Scholar]
- 15.Köse ME, Carroll BF, Schanze KS. Langmuir. 2005;21:9121–9129. doi: 10.1021/la050997p. [DOI] [PubMed] [Google Scholar]
- 16.Kocincova AS, Borisov SM, Krause C, Wolfbeis OS. Anal Chem. 2007;79:8486–8493. doi: 10.1021/ac070514h. [DOI] [PubMed] [Google Scholar]
- 17.Stich MIJ, Nagl S, Wolfbeis OS, Henne U, Schaeferling M. Adv Funct Mater. 2008;18:1399–1406. doi: 10.1002/adfm.200701199. [DOI] [Google Scholar]
- 18.Baleizão C, Nagl S, Schäferling M, Berberan-Santos MN, Wolfbeis OS. Anal Chem. 2008;80:6449–6457. doi: 10.1021/ac801034p. [DOI] [PubMed] [Google Scholar]
- 19.Borisov SM, Gatterer K, Klimant I. Analyst. 2010;135:1711–1717. doi: 10.1039/c0an00180e. [DOI] [PubMed] [Google Scholar]
- 20.Vasylevska GS, Borisov SM, Krause C, Wolfbeis OS. Chem Mater. 2006;18:4609–4616. doi: 10.1021/cm060967n. [DOI] [Google Scholar]
- 21.Borisov SM, Krause C, Arain S, Wolfbeis O. Adv Mater. 2006;18:1511–1516. doi: 10.1002/adma.200600120. [DOI] [Google Scholar]
- 22.Stich MIJ, Schaeferling M, Wolfbeis OS. Adv Mater. 2009;21:2216–2220. doi: 10.1002/adma.200803575. [DOI] [Google Scholar]
- 23.Borisov SM, Klimant I. Anal Chem. 2007;79:7501–7509. doi: 10.1021/ac0710836. [DOI] [PubMed] [Google Scholar]
- 24.Borisov SM, Gatterer K, Bitschnau B, Klimant I. J Phys Chem C. 2010;114:9118–9124. doi: 10.1021/jp1016467. [DOI] [PMC free article] [PubMed] [Google Scholar]
- 25.Christiansson L, Hellberg A, Koga I, Thelin S, Bergqvist D, Wiklund L, Karacagil S. Surgery. 2000;127:571–576. doi: 10.1067/msy.2000.105036. [DOI] [PubMed] [Google Scholar]
- 26.Uhlmann D, Pietsch U, Ludwig S, Hess J, Armann B, Gaebel G, Escher E, Schaffranietz L, Tannapfel A, Fiedler M, Hauss J, Witzigmann H. Microvasc Res. 2004;67:38–47. doi: 10.1016/j.mvr.2003.09.002. [DOI] [PubMed] [Google Scholar]
- 27.Huber C, Klimant I, Krause C, Werner T, Mayr T, Wolfbeis OS. Fres J Anal Chem. 2000;368:196–202. doi: 10.1007/s002160000493. [DOI] [PubMed] [Google Scholar]
- 28.Liebsch G, Klimant I, Krause C, Wolfbeis OS. Anal Chem. 2001;73:4354–4363. doi: 10.1021/ac0100852. [DOI] [PubMed] [Google Scholar]
- 29.Borisov SM, Neurauter G, Schroeder C, Klimant I, Wolfbeis OS. Appl Spectrosc. 2006;60:1167–1173. doi: 10.1366/000370206778664590. [DOI] [PubMed] [Google Scholar]
- 30.Mills A, Chang Q. Analyst. 1993;118:839–843. doi: 10.1039/an9931800839. [DOI] [Google Scholar]
- 31.Bultzingslowen CV, McEvoy AK, McDonagh C, MacCraith BD, Klimant I, Krause C, Wolfbeis OS. Analyst. 2002;127:1478–1483. doi: 10.1039/b207438a. [DOI] [PubMed] [Google Scholar]
- 32.Brandrup J, Immergut EH, Grulke EA. Polymer handbook. New York: Wiley; 1999. [Google Scholar]
- 33.Lai J, Lin Y, Denq Y, Shyu S, Chen J. J Adhes Sci Technol. 1996;10:231–242. doi: 10.1163/156856196X00364. [DOI] [Google Scholar]
- 34.Zhou Z, Shinar R, Allison A, Shinar J. Adv Funct Mater. 2007;17:3530–3537. doi: 10.1002/adfm.200700324. [DOI] [Google Scholar]
- 35.Huber C, Klimant I, Krause C, Wolfbeis OS. Anal Chem. 2001;73:2097–2103. doi: 10.1021/ac9914364. [DOI] [PubMed] [Google Scholar]
- 36.Schröder CR, Polerecky L, Klimant I. Anal Chem. 2007;79:60–70. doi: 10.1021/ac0606047. [DOI] [PubMed] [Google Scholar]
- 37.Schroeder CR, Neurauter G, Klimant I. Microchim Acta. 2007;158:205–218. doi: 10.1007/s00604-006-0696-5. [DOI] [Google Scholar]
- 38.Opitz N, Lübbers D. Sens Actuators. 1983;4:473–479. doi: 10.1016/0250-6874(83)85059-8. [DOI] [Google Scholar]
- 39.Weidgans BM, Krause C, Klimant I, Wolfbeis OS. Analyst. 2004;129:645–650. doi: 10.1039/b404098h. [DOI] [PubMed] [Google Scholar]
- 40.Carraway ER, Demas JN, DeGraff BA, Bacon JR. Anal Chem. 1991;63:337–342. doi: 10.1021/ac00004a007. [DOI] [Google Scholar]
- 41.Mills A, Chang Q. Anal Chim Acta. 1994;285:113–123. doi: 10.1016/0003-2670(94)85015-1. [DOI] [Google Scholar]
- 42.Zhujun Z, Seitz WR. Anal Chim Acta. 1984;160:305–309. doi: 10.1016/S0003-2670(00)84536-5. [DOI] [Google Scholar]
- 43.Hartmann P, Leiner MJP, Kohlbacher P. Sens Actuators, B. 1998;51:196–202. doi: 10.1016/S0925-4005(98)00188-9. [DOI] [Google Scholar]


