

Abstract
The machine learning and pervasive sensing technologies found in smart homes offer unprecedented opportunities for providing health monitoring and assistance to individuals experiencing difficulties living independently at home. In order to monitor the functional health of smart home residents, we need to design technologies that recognize and track activities that people normally perform as part of their daily routines. Although approaches do exist for recognizing activities, the approaches are applied to activities that have been pre-selected and for which labeled training data is available. In contrast, we introduce an automated approach to activity tracking that identifies frequent activities that naturally occur in an individual’s routine. With this capability we can then track the occurrence of regular activities to monitor functional health and to detect changes in an individual’s patterns and lifestyle. In this paper we describe our activity mining and tracking approach and validate our algorithms on data collected in physical smart environments.
Index Terms: Activity recognition, Data mining, Sequence mining, Clustering, Smart homes
1 Introduction
A Convergence of technologies in machine learning and pervasive computing as well as the increased accessibility of robust sensors and actuators has caused interest in the development of smart environments to emerge. Furthermore, researchers are recognizing that smart environments can assist with valuable functions such as remote health monitoring and intervention. The need for the development of such technologies is underscored by the aging of the population, the cost of formal health care, and the importance that individuals place on remaining independent in their own homes.
To function independently at home, individuals need to be able to complete Activities of Daily Living (ADLs) [1] such as eating, dressing, cooking, drinking, and taking medicine. Automating the recognition of activities is an important step toward monitoring the functional health of a smart home resident. When surveyed about assistive technologies, family caregivers of Alzheimer’s patients ranked activity identification and tracking at the top of their list of needs [2].
In response to this recognized need, researchers have designed a variety of approaches to model and recognize activities. The generally accepted approach is to model and recognize those activities that are frequently used to measure the functional health of an individual [3]. However, a number of difficulties arise with this approach. First, there is an assumption that each individual performs most, or all, standard ADL activities in a consistent pre-defined manner in their home environments where they can be monitored. This is certainly not always the case. For example, while an individual may regularly eat meals, they may go out to restaurants for the majority of their meals, which would make tracking this ADL activity challenging for a smart home. Even for an activity that is performed in the monitored environment, different individuals might perform it in vastly different ways, making the reliance on a list of pre-defined activities impractical due to the inter-subject variability. In addition, the same individual might perform even the same activity in different ways, requiring methods that can also deal with intra-subject variability.
Second, tracking only pre-selected activities ignores the important insights that other activities can provide on the functional health of individuals. For example, Hayes, et al. [4] found that variation in the overall activity level at home was correlated with mild cognitive impairment. This activity level was not restricted to predetermined activities but was related to the total activity level in the monitored environment. This highlights the fact that it is important for a caregiver to recognize and monitor all activities that an individual regularly performs in their daily environments.
Third, to track a predefined list of activities, a significant amount of training data must be labeled and be made available to the machine learning algorithm. Because individuals perform activities differently due to physical, mental, cultural, and lifestyle differences [5], sample data needs to be collected and labeled for each individual before the learned model can be used reliably to track the individual’s activities and functional well-being. Unfortunately, collecting and labeling such sensor data collected in a smart environment is an extremely time-consuming task. If the individual is asked to participate by keeping track of their own activities over a period of time, the process is additionally obtrusive, laborious, and prone to self-report error [6].
In this paper, we introduce an unsupervised method of discovering and tracking activities in a smart environment that addresses the above issues. We implement our approach in the context of the CASAS Smart Home project [7] by using sensor data that is collected in the CASAS smart apartment testbed. The unsupervised nature of our model provides a more automated approach for activity recognition than is offered by previous approaches, which take a supervised approach and annotate the available data for training. Compared to traditional methods for activity recognition which solely utilize HMM or other models for recognizing labeled activities, our approach first “discovers” interesting patterns of activity, and then recognizes these discovered activities to provide a more automated approach. We introduce a unique mining method for discovering activity patterns, along with a clustering step to group discovered patterns into activity definitions. For the recognition step we create a boosted version of a hidden Markov model to represent the activities and their variations, and to recognize those activities when they occur in the smart environment.
In the remainder of this paper we detail our approach to activity discovery, recognition, and tracking. In section 2 we compare our approach to related work in the field. Section 3 explains the discovery of activities using mining and clustering methods. Section 4 describes how discovered activities can be recognized using the HMM model. Finally in section 5 we will present the results of our experiments in the CASAS testbed for scripted ADL activities, interleaved ADL activities, and also long-term daily resident activities.
2 Related Work
We treat a smart environment as an intelligent agent that perceives the state of the resident and the physical surroundings using sensors, and acts on the environment using controllers in such a way that the specified performance measured is optimized [8]. Researchers have generated ideas for designing smart environments, such as software algorithms that track the location and activities of residents, generate reminders, or react to hazardous situations [9]. Smart environment projects with physical testbeds now exist, including the CASAS project [7], the MavHome project [10], the Gator Tech Smart House [11], the iDorm [12], and the Georgia Tech Aware Home [13]. Based on these advances, researchers are now beginning to recognize the importance of applying smart environment technology to health assistance [14], [15], [16], [17] and companies are recognizing the potential of this technology for a quickly-growing consumer base [18].
Activity recognition is not an untapped area of research. Because the need for activity recognition technology is great, researchers have explored a number of approaches to this problem. The approaches differ according to the type of sensor data that is used for classification, the model that is designed to learn activity definitions, and the method that is used to annotate sample data.
Sensor data
Researchers have found that different types of sensor information are effective for classifying different types of activities. When trying to recognize actions that involve repetitive body motions (e.g., walking, running, sitting, standing, climbing stairs), data collected from accelerometers positioned on the body has been used [19], [20]. For other activities that are not as easily distinguishable by body position, researchers such as Munguia-Tapia et al. [21] and Philipose et al. [22] observe the smart home resident’s interactions with objects in the environment such as doors, windows, refrigerators, keys, and medicine containers. Munguia-Tapia et al. installed state-change sensors on key items to collect object interaction data, while Philipose et al. put RFID tags on items and asked participants to wear gloves with RFID tag readers that recorded when the individual was close to a key item. Other researchers, including Cook and Schmitter-Edgecombe [23], rely upon motion sensors as well as item sensors to recognize ADL activities that are being performed. For recognition of specialized classes of activities researchers use more specialized sources of information. As an example, Yang, et al. [24] collected computer usage information to recognize computer-based activities including multiplayer gaming, movie downloading, and music streaming. In addition, some researchers such as Brdiczka et al. [25] video tape smart home residents and process the video to recognize activities. While individuals have traditionally been resistant to at-home video monitoring [26], the acceptance of this technology in the home is increasing. On the other hand, processing the video is very computationally expensive and relies upon first tracking the resident before the correct video data can be captured and analyzed [27]. Because our study participants are uniformly reluctant to allow video data or to wear sensors, our data collection has consisted solely of passive sensors that could be installed in a smart environment.
Activity models
The number of machine learning models that have been used for activity recognition varies almost as greatly as the types of sensor data that have been tested. Naive Bayes classifiers have been used with promising results for activity recognition [21], [23], [25], [28]. Naive Bayes classifiers identify the activity that corresponds with the greatest probability to the set of sensor values that were observed. Despite the fact that these classifiers assume conditional independence of the features, the classifiers yield good accuracy when large amounts of sample data are provided. Other researchers, including Maurer et al. [19], have employed decision trees to learn logical descriptions of the activities. This approach offers the advantage of generating rules that are understandable by the user, but it is often brittle when high precision numeric data is collected. Gu et al. [29] use the notion of emerging patterns to look for frequent sensor sequences that can be associated with each activity as an aid for recognition. An alternative approach that has been explored by other researchers is to encode the probabilistic sequence of sensor events using Markov models, dynamic Bayes networks, and conditional random fields [22], [23], [30], [31]. In our approach we employ a boosted version of a hidden Markov model to recognize possibly-interleaved activities from a stream of sensor events.
Annotation methods
An aspect of activity recognition that has been greatly under-explored is the method used to annotate sample data that the scientist can use to train the activity model. Most of the researchers have published results of experiments in which the participants are required to manually note each activity they perform at the time they perform it [21], [22], [30]. In other cases, the experimenters told the participants which specific activities should be performed, so the correct activity labels were identified before the sensor data was even collected [19], [23], [29]. In one case, the experimenter manually inspected the raw sensor data in order to annotate it with a corresponding activity label [9]. None of these approaches are practical for all situations. When activity monitoring is used for older adults with dementia, the resident cannot reasonably be expected to remember which activities they performed, let alone regularly and accurately record the correct activity labels and times. Hand labeling from raw sensor data is very time consuming and therefore may not be the best approach either.
We take a unique unsupervised approach to activity tracking in this paper. We discover activities that naturally occur frequently in an individual’s home environment and then build models to recognize these activities as they occur. As a result, no manual annotation of activity data or scripting of activities is required. Labeling of the data is automated because the models are trained on activities that are discovered in the raw data. By noting when these activities occur, caregivers and smart environment algorithms can assess how regularly, consistently, and completely [23] individuals are performing their own normal routines.
We introduce a new mining method, called discontinuous varied-order mining method (DVSM), which is able to find frequent patterns that may be discontinuous and might have variability in the ordering; thereby addressing the intra-subject variability issue. Because we discover activity patterns that are common for each individual instead of using pre-selected activities, we are also able to address the issue of inter-subject variability. We employ activity clustering to group the patterns into activity definitions, where the cluster centroids represent the activities that will be tracked and recognized. In the next step, we create a boosted version of a hidden Markov model to represent the activities and their variations, and to recognize those activities when they occur in the smart environment. The architecture of the system is shown in Fig. 1.
Fig. 1.

Main components of the proposed system for discovering and tracking activities.
By recognizing activities as they occur, the smart home can determine when the activities occur, and perform analysis on their timing to determine long-term trends and assess activity variability. This approach requires no annotation time and no input from the participant. As a result, it represents a fully-automated approach to performing activity tracking to support smart environment-based health assessment of an individual in their everyday environment.
3 Discovering Activities
The first step we must consider is how to identify the frequent and repeatable sequences of sensor events that comprise our smart environment’s notion of an activity. Once we identify the activity and associate specific occurrences of the activity, we can build a model to recognize the activity and begin to analyze the occurrences of the activity. But how then do we discover these activities? By applying frequent sequential pattern mining techniques we can identify contiguous, consistent sensor event sequences that might indicate an activity of interest. Many methods have been proposed for mining sequential data, including mining frequent sequences [32], mining frequent patterns using regular expressions [14], constraint-based mining [33], and frequent-periodic pattern mining [34]. One limitation of these approaches is that they do not discover discontinuous patterns, which can appear in daily activity data due to the erratic nature of human activities. For example, when an individual prepares a meal, the steps do not always follow the same strict sequence; rather, their order may be changed and be interleaved with steps that do not consistently appear each time.
Ruotsalainen et al. [35] introduce their Gais algorithm for detecting interleaved patterns using genetic algorithms, but this is a supervised learning approach that looks for matches to specific pattern templates. Other approaches have been proposed to mine discontinuous patterns but have difficulty finding hybrid continuous-discontinuous patterns [36], [37] and have difficulty finding patterns whose order may vary from one occurrence to another [38].
Given that we want to discover sequential patterns that may be discontinuous and have variability in the ordering, another possible approach is to cluster the sensor events. Keogh et al. [39] claim that the clusters that result from processing streaming time series data are essentially random. However, time series and sequence clustering algorithms have shown to be effective in constrained situations. For example, sequence mining algorithms have been successfully used in bioinformatics to discover related gene sequences [40]. The limitation of clustering algorithms for our problem is that we do not want to cluster all of the data points, but only those that are part of an activity sequence which is likely to occur frequently and with some degree of regularity or recognizability.
Because both sequence mining and clustering algorithms address a portion of our problem, we combine these two methods into an Activity Discovery Method (ADM) to identify frequent activities and cluster similar patterns together. Specifically, we apply our own frequent sequence miner algorithm, a Discontinuous Varied-Order Sequential Miner (DVSM), combined with a clustering algorithm to identify sensor event sequences that likely belong together and appear with enough frequency and regularity to comprise an activity that can be tracked and analyzed.
3.1 Discovering frequent discontinuous sequences
Our activity discovery method, ADM, performs frequent sequence mining using DVSM to discover frequent patterns, and then groups the similar discovered patterns into clusters. We use DVSM to find sequence patterns from discontinuous instances that might also exhibit varied order events. As an example, DVSM can extract the pattern 〈a, b〉 from instances {b, x, c, a}, {a, b, q}, and {a, u, b}, despite the fact that the events are discontinuous and have varied orders. It should be noted that our algorithm is also able to find continuous patterns by considering them as patterns with no discontinuity. Our approach is different from frequent itemset mining because we consider the order of items as they occur in the data. Unlike many other sequence mining algorithms, we report a general pattern that comprises all frequent variations of a single pattern that occur in the input dataset  . For general pattern a we denote the ith variation of the pattern as ai, and we call the variation that occurs most often among all variations of a the prevalent variation, ap. We also refer to each single component of a pattern as an event (such as a in the pattern 〈a, b〉).
To find these discontinuous order-varying sequences from the input data , DVSM first creates a reduced dataset Dr containing the top α most frequent events. Next, DVSM slides a window of size 2 across Dr to find patterns of length 2. After this first iteration, the whole dataset does not need to be scanned again. Instead, DVSM extends the patterns discovered in the previous iteration by their prefix and suffix events, and will match the extended pattern against the already-discovered patterns (in the same iteration) to see if it is a variation of a previous pattern, or if it is a new pattern [7]. To facilitate comparisons, we save general patterns along with their discovered variations in a hash table.
To see if two patterns should be considered as variations of the same pattern, we use the Levenshtein (edit) distance [41] to define a similarity measure sim(A, B) between the two patterns. The edit distance, e(A, B), is the number of edits (insertions, deletions, and substitutions) required to transform an event sequence A into another event sequence B. We define the similarity measure based on the edit distance as in Equation (1).
| (1) |
At the end of each iteration, we prune infrequent variations of a general pattern, as well as infrequent general patterns. We identify general patterns as interesting if they satisfy the Inequality (2), and variation i of the pattern as interesting if it satisfies the Inequality (3). In this inequality DL computes the description length of the argument, and C and Cv are minimum compression value thresholds.
| (2) |
| (3) |
Our approach to identifying interesting patterns aligns with the minimum description length principle [42] which advocates that the pattern which best describes a dataset is the one which maximally compresses the dataset by replacing instances of the pattern by pointers to the pattern definition. However, since we allow discontinuities to occur, each instance of the pattern needs to be encoded not only with a pointer to the pattern definition, but also with a continuity factor, Γ. The discontinuity of a pattern instance is calculated as the number of bits required to express how the pattern varies from the general definition.
To understand what the continuity function measures, consider a general pattern 〈a, b, c〉 as shown in Fig. 2. An instance of the pattern is found in the sequence {a, b, g, e, q, y, d, c} where symbols “g e q y d” separate the pattern subsequences {a, b} and {c}. Though this sequence may be considered as an instance of the general pattern 〈a, b, c〉, we still need to take into account the number of events that appear between subsequences {a, b} and {c}. In terms of calculating a pattern’s compression, discontinuities increase the description length of the data because the way in which the pattern is broken up needs to be encoded.
Fig. 2.
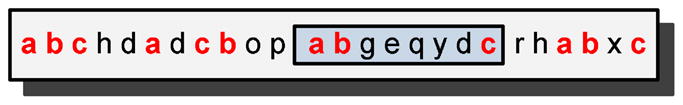
A small dataset containing pattern 〈a, b, c〉.
The continuity between component events, Γe, is defined for each two consecutive events in an instance. For each frequent event é, we record how far apart (or separated, denoted by sé) it is from a preceding frequent event in terms of the number of events that separate them in (in above example, sc = 5). Then Γe(é), the event continuity for é is defined as in Equation (4).
| (4) |
The more the separation that exists between two frequent events, the less will be the event continuity. Based on event continuity, the instance continuity Γi reflects how continuous its component events are. Such that , for an instance j of a variation ai will be defined as in Equation (5) where is the length of .
| (5) |
The continuity of a variation, Γv, is then defined as the average continuity of its instances. Γv(ai) is defined as in Equation (6), where nai shows the total number of instances for variation ai.
| (6) |
The continuity, Γg, of a general pattern g, is defined as the weighted average continuity of its variations. Γg is defined according to Equation (7), where the continuity for each ai is weighted by its frequency fai and na shows the total number of variations for general pattern a.
| (7) |
Building on this definition of continuity, we can update Inequalities (2) and (3) as shown in Inequalities (8) and (9).
| (8) |
| (9) |
Patterns that satisfy the inequality (8) are flagged as interesting, as are variations that satisfy the inequality (9). The rest of the patterns and variations are pruned. Every iteration, we also prune redundant non-maximal patterns; i.e., those patterns that are totally contained in another larger pattern. This considerably reduces the number of discovered patterns. We continue extending the patterns by prefix and suffix until no more interesting patterns are found. A post-processing step records attributes of the patterns, such as event durations.
3.2 Clustering sequences into Groups of Activities
The second step of the ADM algorithm is to identify pattern clusters that will represent the set of discovered activities. Specifically, ADM groups the set of discovered patterns  into a set of clusters
  . The resulting set of clusters centroids represents the activities that we will model, recognize, and track. Though ADM uses a standard k-means clustering method [43], we still need to define a method for determining cluster centroids and for comparing activities in order to form clusters. A number of methods have been reported in the literature for sequence clustering, such as the CLUSEQ algorithm by Yang et al. [44] and the ROCK algorithm by Noh et al. [45]. The difference between their approach and ours is that they consider purely symbolic sequences with no features attached to them. In contrast, sensor event sequences are not simply strings, but each entry in the sequence also has associated features such as temporal information that need to be considered during the discovery process.
Two methods that are commonly used for comparing the similarity of sequences are edit distance [41] and longest common subsequence (LCS) [46] for simple sequences. In addition, Saneifar et al. [47] proposed a similarity measure for more complex itemset sequences based on the number of common items. These methods are not sufficient to address our clustering problem. This is because while the methods do satisfy our definition of an activity as a sequence of events, they do not process the temporal information that is encoded in our sensor event data nor do they handle the special cases that occur in our application such as reasoning about ordering information. As a result, we refine these existing methods to apply them to our smart environment sensor event sequences.
The patterns discovered by DVSM were composed of sensor events. In the clustering algorithm the pattern is composed of states. States correspond to the pattern’s events, but are enhanced to include additional information such as the type and duration of the sensor events. In addition, we can combine several states together to form a new state (we call it an extended state). We combine all consecutive states corresponding to the sensors of the same type to form an extended state. For example, if a motion sensor in the kitchen is triggered several times in a row without another sensor event interrupting the sequence, the series of identical motion sensor events will be combined into one event with a longer duration. This allows our algorithm to have a more compact representation of activities and to allow similar activities to be more easily compared. We refer to the extended list of states for a pattern p as E(p).
To calculate the similarity between two activities X and Y, we compute the distance between their extended state lists E(X) and E(Y) using our general edit distance to account for the state information and the order mapping. In particular, we compute the number of edit operations that are required to make activity X the same as activity Y. The edit operations include adding a step or deleting a step (traditional edit distance), re-ordering a step (order distance), or changing the attributes of a step (for this application step attributes include the event duration and event frequencies). The general edit distance eg(X, Y) for two patterns X and Y can be defined based on the traditional edit distance (e(X, Y)), the order distance(eo(X, Y)), and the attribute distance (ea(X, Y)) as in Equation (10), where we refer to the additional term added to the traditional edit distance as Δ. Note that this similarity metric is different from the one used in Section ?? because state information such as event duration and ordering is taken into account.
| (10) |
It should also be noted that there will be multiple possible mappings between the states of the two activities X and Y, and one mapping will lead to the shortest edit distance (the optimal mapping). To find the optimal mapping for a state x ∈ E(X) (denoted by m(x)), the value of Δ(x, y) is computed for each possible mapping of x → (y ∈ E(Y)); the state y is chosen to minimize Δ(x, y) as in Equation (11).
| (11) |
The attribute distance between two states x and y is calculated as the sum of distances between individual attributes. An important attribute that can help us determine similarity is temporal information attribute (e.g. duration). The order distance between the two states x and y is defined as in Equation (12) where pos(x) shows the index of state x in the corresponding list of states
| (12) |
Based on the above descriptions, we can rewrite the term Δ in (10) as in (13):
| (13) |
The general edit distance gives us a measure to compare activities and also to define cluster centroids. The cluster centroid for each cluster is defined as the activity that has the highest degree of similarity with all the other activities in the same cluster, or equivalently the lowest edit distance to all the other activities in the cluster. Each cluster representative represents a class of similar activities, forming a compact representation of all the activities in the cluster. The activities represented by the final set of clusters are those that are modeled and recognized by the CASAS smart environment.
It should be noted that currently the number of clusters is provided to the clustering algorithm. However, alternative methods can be used to determine the number of clusters during runtime, by forming incremental clusters until no more change can be perceived, as proposed in the literature [44], [45], [48], [49].
4 Recognizing Activities
Once the activities are discovered for a particular individual, we want to build a model that will recognize future executions of the activity. This will allow the smart environment to track each activity and determine if an individual’s routine is being maintained. As described earlier, researchers have exploited the use of probabilistic models for activity recognition with some success for pre-defined activities. In our approach, we make use of a hidden Markov model to recognize activities from sensor data as they are being performed. Each model is trained to recognize the patterns that correspond to the cluster representatives found by ADM.
A Markov Model (MM) is a statistical model of a dynamic system, which models the system using a finite set of states, each of which is associated with a multidimensional probability distribution over a set of parameters. The system is assumed to have a Markovian property, such that the current state depends on a finite history of previous states. Transitions between states are governed by transition probabilities. Earlier approaches [23] use Markov chains to recognize activities from sensor event traces that were segmented into non-overlapping sequences. A separate Markov model could be learned for each activity and the model that best supports a new sequence of events would be selected as the activity label for the sequence. Because we are now processing data that is collected in real homes in which activities may be interrupted or interleaved, this type of approach would not be as effective. For this task, we employ a hidden Markov model.
A hidden Markov model (HMM) is a statistical model in which the underlying data is generated by a stochastic process that is not observable. The process is assumed to be Markovian and can be observed through another set of stochastic processes that produce the sequence of observed features. HMMs traditionally perform well in cases where temporal patterns need to be recognized; this aligns with our requirement to recognize possibly interleaved activities. As with a Markov chain, the conditional probability distribution of any hidden state depends only on the value of a finite number of preceding hidden states. The observable variable at time t, namely xt, depends only on the hidden variable yt at that time slice. We can specify an HMM using three probability distributions: the distribution over initial states Π = {πk}, the state transition probability distribution A = {akl}, with akl = p(yt = l|yt−1 = k) representing the probability of transitioning from state k to state l; and the observation distribution B = {bil}, with bil = p(xt = i|yt = l) indicating the probability that the state l would generate observation xt = i. We can find the most likely sequence of hidden states given the observation in Equation (14) and by using the Viterbi algorithm [50].
| (14) |
Though HMMs can prove to be useful in predicting activity labels, sometimes they make a very slow transition from one activity to another. For example, consider a case where a HMM is currently in some state y1 as the most likely activity, but the next sensor event belongs to some other activity y2. It will take the HMM several sensor events to slowly decrease the probability of activity y1 and increase the probability of activity y2. This problem is heightened when residents act in a natural manner and interweave multiple activities. To remedy this problem we use an event-based sliding window that limits the history of sensor events that the model remembers at any given time. The probability values calculated previously are flushed out whenever the model starts processing a new window.
For activity recognition, we use a voting multi-HMM model as a boosting mechanism. Boosting and other ensemble learning methods attempt to combine multiple hypotheses from a number of learning algorithms into a single hypothesis [51], [52], [53]. While the value of boosting for classification has been shown, research in the application of boosting to sequence learning has been comparatively limited [54], [55]. We construct multiple HMMs and recognize activities by combining their classifications using a voting mechanism. To generate an activity label L for a particular sensor event x, we apply the Viterbi algorithm to the sliding window of events that ends in event x for each HMM and choose the activity that receives the highest number of votes. For each individual HMM we let the hidden states represent the possible activities and we encode observable states to represent sensor values. The multiple HMMs in the multi-HMM model represent alternative variations of the patterns. Specifically, the first HMM represents the first variation of all patterns (one hidden state per pattern), the second HMM represents the second variation of patterns, and so on. The activity label L(x), is calculated as in Equation (15) where Pk(x, Li) shows the probability of assigning label Li to x by the k-th HMM. In this equation n is the number of HMMs.
| (15) |
As an example of our model, Fig. 3 shows a portion of an individual HMM for activity data collected in the CASAS smart apartment. The probabilistic relationships between hidden nodes and observable nodes, and the probabilistic transitions between hidden nodes, are estimated by the relative frequency with which these relationships occur in the sample data corresponding to the activity cluster.
Fig. 3.
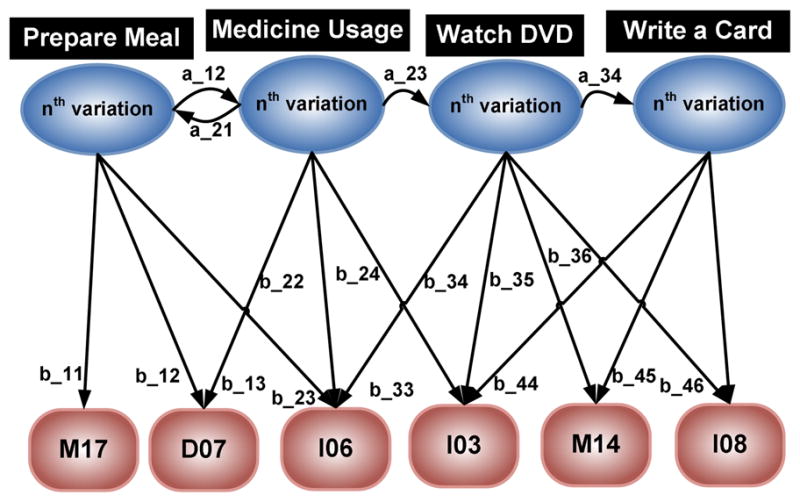
A section of an individual HMM, representing the nth variation of patterns. The ovals represent hidden states (i.e., activities) and the rectangles represent observable states. Values on horizontal edges represent transition probabilities aij between activities and values on vertical edges represent the emission probability bkl of the observable state given a particular current hidden state.
Given an input sequence of sensor events, our goal is to find the most likely sequence of hidden states, or activities, which could have generated the observed event sequence. We use the Viterbi algorithm [50] for each HMM to identify this sequence of hidden states, one hidden state at a time, and then using the described voting mechanism, we identify the most likely hidden state for the multi-HMM based on input from all individual HMMs (see Fig. 4). The multi HMM is built automatically using the output of ADM’s discovery and clustering algorithm.
Fig. 4.

A multi HMM consists of n HMMs. It uses a voting mechanism to choose the final output.
5 Experimental Results
We hypothesize that our ADM algorithm will accurately identify activities that are frequently performed in a smart environment. We also hypothesize that the algorithm can be used to track the occurrence of these regular activities. We validate these hypotheses here using data collected in a physical smart environment.
5.1 CASAS Testbed
The testbed for validating our algorithms is a three-bedroom apartment located on the Washington State University campus that is part of the ongoing CASAS smart home project [7]. As shown in Fig. 5, the smart apartment testbed includes three bedrooms, one bathroom, a kitchen, and a living/dining room. The apartment is equipped with motion sensors positioned on the ceiling approximately 1 meter apart throughout the space. In addition, we have installed sensors to provide ambient temperature readings, and custom-built analog sensors to provide readings for hot water, cold water, and stove burner use. Voice over IP using the Asterisk software [56] captures phone usage, contact switch sensors monitoring the open/closed status of doors and cabinets, and pressure sensors monitor usage of key items such as the medicine container, cooking pot, and phone book. Sensor data is captured using a sensor network that was designed in-house and is stored in a SQL database. Our middleware uses a jabber-based publish/subscribe protocol [57] as a lightweight platform and language-independent middleware to push data to client tools with minimal overhead and maximal flexibility. To maintain privacy we remove participant names and identifying information and encrypt collected data before it is transmitted over the network.
Fig. 5.
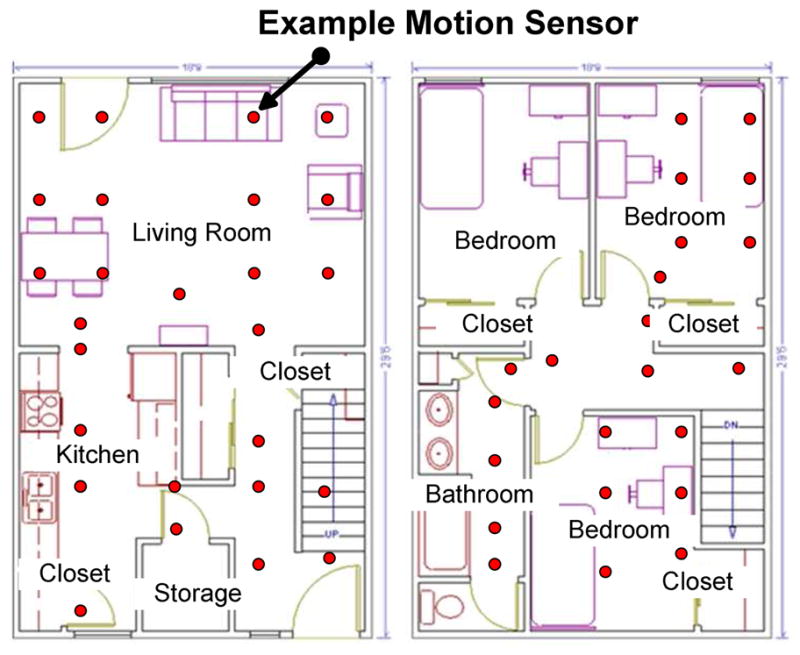
Three-bedroom smart apartment used for our data collection. The positions of motion sensors are indicated by circles in the figure.
5.2 Normal ADL Activity Discovery
For our first experiment, we applied the ADM algorithm to data that is collected in the CASAS testbed. Specifically, we gather data for a collection of repeated specific, scripted activities and analyze the data using ADM. Because the activities are repeated a number of times, ADM should discover activities that correspond to a high degree with the pre-selected activities. If ADM is successful in discovering these ADL activities this will provide evidence that the ADM unsupervised learning method will automatically identify, recognize, and track sensor event sequences that intuitively represent regular activities, and that ADM will identify ADL activities of interest if they occur frequently.
To provide physical training data, we brought 20 WSU undergraduate students recruited from the psychology subject pool into the smart apartment, one at a time, and had them perform the following five activities:
Telephone Use: Look up a specified number in a phone book, call the number, and write down the cooking directions given on the recorded message.
Hand Washing: Wash hands in the kitchen sink.
Meal Preparation: Cook oatmeal on the stove according to the recorded directions, adding brown sugar and raisins (from the kitchen cabinet) once done.
Eating and Medication Use: Eat the oatmeal together with a glass of water and medicine (a piece of candy).
Cleaning: Clean and put away the dishes and ingredients.
The selected activities include both basic and more complex ADLs that are found in clinical questionnaires [1]. Noted difficulties in these areas can help identify individuals who may be having difficulty functioning independently at home [58]. As shown in Fig. 6, each sensor reading is tagged with the date and time of the event, the ID of the sensor that generated the event, and the sensor value. Notice that performing activities by different subjects results in considerable inter-subject variability, as participants were performing activities in vastly different ways.
Fig. 6.
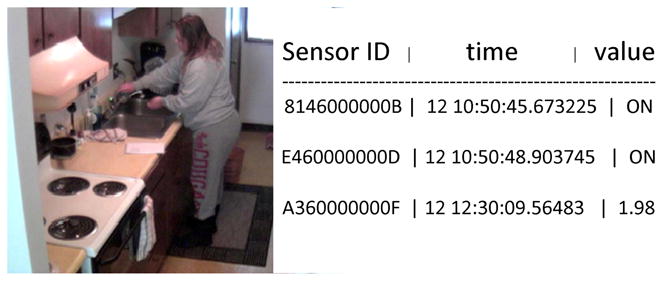
Resident performing “hand washing” activity (left). This activity triggers motion sensor ON/OFF events as well as water flow sensor values (right).
To validate the effectiveness of our activity discovery algorithm, we applied the ADM algorithm to the sensor data collected for the normal activities. Specifically, we first discover repeating sequential patterns in the sensor event data. We then cluster the pattern instances into five clusters (the same number as the number of activities in the scripted experiment) and determine if the discovered activities are similar to those that are pre-defined to exist in the sensor data.
In these experiments, we set the minimum compression thresholds C and Cv to 0.3 and 0.1, and the threshold of frequent events used α to 0.6. These are values we found to be effective based on experimentation across multiple datasets. When we analyzed the collected sensor events, DVSM discovered 9 general patterns with lengths varying from 2 to 39 events, and comprising up to 10 variations for each pattern. These results indicate that DVSM is able to find repetitive patterns in a compact form from 100 activity sensor streams, despite the inter-subject variability.
In the next step, we cluster the discovered activities. The resulting clusters provide an even more compact representation of all activities by assigning a centroid pattern for each cluster of similar activities. The attributes considered in these set of activities were duration of states and frequency. As mentioned earlier, the number of clusters was set to 5, equal to the number of pre-defined activities that occurred in the data collection.
In order to determine the ability of ADM to find these pre-defined activities, we compare the representatives of the automatically-discovered clusters with the sensor event sequences that occur for the pre-defined tasks. Because ADM would eventually be used to find naturally-occurring patterns for each individual, we repeat the discovery and assessment process for each of the participant data files, representing a total of 120 cases. We are interested in determining the percentage of cluster representatives that match the pre-defined activity sensor events. We consider a cluster representative as matching a pre-defined activity if it only contains events that occur within the activity sequence and if it does not overlap with any of the other cluster representative sequences.
We would also like to evaluate the quality of the clusters themselves. The purpose of the clustering algorithm in this project is ultimately to provide groupings of sensor sequences that reflect regularly-performed activities and that can be recognized. The primary performance criteria thus applies to the entire discovery and recognition approach rather than just to the clustering component. However, we do evaluate the clusters themselves based on two metrics defined below.
- First, we compute the fraction of clusters that map to the actual defined activity groups. If the number of actual defined activity groups is denoted by |A|, and the number of discovered clusters where the representative’s label maps to a distinct activity group is |S|, then our first cluster quality metric q1 can be expressed as in Equation (16):
(16) - Second, we compute the fraction of activities in each cluster that actually belong to the same defined activity group represented by the cluster representative (e.g., watching DVD). If we denote the cluster Si’s representative by mi and its actual label as L(mi), and we also denote each activity in the cluster as aj, its actual label as L(aj), and its discovered label as DL(aj), then our second cluster quality metric q2 will be defined as in Equation (17):
(17)
To be able to measure such metrics, in our experiments we embedded the actual labels of each sensor event. Note that these annotations do not play a role in the discovery and recognition of the activities; rather the whole purpose of using such annotation is to be able to measure the accuracy of our algorithms at the end, and one can easily remove these annotations in a deployed version of the system.
In our experiment, the ADM algorithm found cluster representatives corresponding to the pre-defined activities for 80.0% of the cases (q1). In addition, 87.5% of the individual sensor events were assigned to the correct clusters, or to the activity clusters that actually were responsible for generating the events (q2).
Some of the activities were assigned to a wrong but similar cluster. For example, because the set of sensors used for the hand washing and dish cleaning tasks are very similar, in many cases they were clustered together. A similar result occurred for DVSM as well, where in many cases the algorithm considered these two patterns to be variations of each other. To an extent this highlights the fact that some ADL activities are in fact very similar and could possibly be monitored together as a group. In addition, the large inter-subject variability made assigning an activity more difficult, because participants were performing activities in vastly different ways with missed and mistaken steps, such that in some cases the clustering algorithm clustered them into two different clusters. In a real world situation, as the discovery is usually performed for a single individual, we anticipate the accuracy will be higher. Refining the process of creating an initial assignment of clusters can also improve the accuracy.
Next, we used our multi-HMM model to recognize the discovered activities. Using such a model, our multi-HMM model was able to recognize 73.8% of the original activities and 95.2% of discovered activities by ADM. To provide a comparative analysis, we implemented a more simple clustering method that uses a traditional edit distance measure instead of our general edit distance measure to generate clusters. Using this simpler clustering method, the multi-HMM only achieved a recognition accuracy of 61.0% for the original activities, which indicates that considering additional information such as temporal features can improve the accuracy.
In order to determine the effect that clustering has on the entire activity recognition and discovery process, we perform a separate set of experiments to discover sequences and recognize the corresponding patterns without involving the clustering set. We randomly chose a number of activities from the DVSM patterns to act as the Markov model hidden nodes and then we used the constructed HMMs to recognize the activities. We expect that the resulting model will achieve a lower recognition accuracy because the randomly-selected activities might not be a good representative of the whole set of activities. It is possible, for example, that half of the hidden nodes might actually represent the same activity, such as watching a DVD, because they are selected randomly and there is no criteria to eliminate dissimilarity, as we applied for forming clusters. The results of the experiments confirm our hypothesis, such that for the normal activity recognition the constructed HMMs were able to recognize on average only 48.6% of the original activities over 10 runs (compared to 73.8% when clustering was used). These results show that the clustering step can improve the choice of activities for hidden nodes as it provides a more distinct set of activity groups with less possible overlaps and most dissimilarity.
5.3 Interwoven ADL Activity Discovery
In our second experiment, we again examine how well ADM can identify activities that are performed in a prescripted manner in the CASAS testbed. In this case, we complicate the situation by allowing the activities to be interwoven together when they are performed. Because ADM considers the disruption of sequences as part of its discovery process, we hypothesize that it will still be able to discover many of these pre-selected activities. To provide physical training data for our algorithm, we recruited 20 additional volunteer participants to perform a series of activities in the smart apartment, one at a time. For this study, we selected 8 ADL activities:
Fill medication dispenser: Here the participant removes the items from kitchen cupboard and fills the medication dispenser using the space on the kitchen counter.
Watch DVD: The participant selects the DVD labeled “Good Morning America” located on the shelf below the TV and watches it on the TV. After watching it, the participant turns off the TV and returns the DVD to the shelf.
Water plants: For this activity, the participant takes the watering can from the supply closet and lightly waters the 3 apartment plants, 2 of which are located on the kitchen windowsill and the third is located on the living room table. After finishing, he/she empties any extra water from the watering can into the sink and returns the watering can to the supply closet.
Converse on Phone: Here the participant answers the phone when it rings and hangs up after finishing the conversation. The conversation includes several questions about the DVD show that the participant watched as part of activity 2.
Write Birthday Card: The participant writes a birthday wish inside the birthday card and a fills out a check in a suitable amount for a birthday gift, using the supplies located on the dining room table. He/she then places the card and the check in an envelope and appropriately addresses the envelope.
Prepare meal: The participant uses the supplies located in the kitchen cupboard to prepare a cup of noodle soup according to the directions on the container. He/she also fills a glass with water using the pitcher of water located on the top shelf of the refrigerator.
Sweep and dust: For this task, the participant sweeps the kitchen floor and dusts the dining and the living room using the supplies located in the kitchen closet.
Select an outfit: Lastly, the participant selects an outfit from the clothes closet to be worn on an important job interview. He/she then lays out the selected clothes on the living room couch.
We instructed the participants to perform all of the activities by interweaving them in any fashion they liked with a goal of being efficient in performing the tasks. The order in which activities were performed and were interwoven was left to the discretion of the participant. Because different participants interwove the tasks differently, the resulting data set was rich and complex.
Similar to the previous experiment, we first ran DVSM on the datasets containing 160 activities, and then clustered the discovered patterns. The parameter values were defined as in the previous experiment, with the exception that the number of clusters was set to 8 to be equal to the new number of pre-defined activities. When it was applied to the collected sensor data, DVSM was able to find 11 general patterns. Averaging over 10 runs, the ADM algorithm found cluster representatives corresponding to the original activities in 76.4% of the participant datasets (q1), and 88.2% of the sensor events were assigned to the correct clusters (q2). The results of this experiment show that despite the fact that the second set of activities are interwoven and include a larger number of activities, due to the discontinuous order-varied nature of our algorithm, ADM is still able to discover activities that occur frequently and will likely discover ADL activities if they are performed frequently in a smart environment.
The next step of the process is to recognize and track the discovered activities as they occur in the smart apartment. We constructed our multi-HMM model based on the discovered eight activities and applied the Viterbi algorithm to the remaining data to identify when the discovered activities occurred. Using such a model, our multi-HMM model was able to recognize 77.3% of the original activities and 94.9% of the activities discovered by ADM. We also performed the experiment without clustering, as mentioned in the previous experiment for normal activities, which resulted in a recognition accuracy of 55.3% of the original activities (compared to 77.3% with clustering). This again shows the importance of clustering for forming more distinct activity groups that can be used as hidden nodes of the HMM model. In another experiment, a simple clustering method using the traditional edit distance resulted in a lower accuracy of 62.4% for the original activities, which again highlights the importance of incorporating additional context information into the construction of the activity models.
5.4 Long Term Activity Discovery
The first two experiments validated that ADM is able to discover frequent activities, including those that belong to known sets of ADL activities. A possible use of this technology is to perform activity discovery during a time when the resident is healthy and functionally independent, to establish a baseline of normal daily activities. By modeling and recognizing the activities, ADM can then track the activities as they are performed in the smart home. The resident or a caregiver can look at the reported activity times to determine whether activities are being performed as regularly as in the past. Alternatively, a variety of temporal analysis and data mining algorithms could be applied to detect trends in the frequency and regularity of the activities.
To demonstrate how ADM can be used for a combination of activity discovery, recognition, and tracking, we applied this process to a long-term data collection in our CASAS smart apartment. In this experiment, we collected 3 months of daily activity data from the smart apartment while two residents lived there and performed their normal daily routines. Sensor data was collected continuously, resulting in 987, 176 sensor events. We applied the activity discovery algorithms to this collected data. The parameter settings were similar to the previous experiments, although we modified the threshold α of frequent events used in pattern discovery in order to investigate its impact on the number of discovered patterns.
We note that increasing the value of α results in discovering more patterns, as a wider range of frequent events are involved, but at the same time results in pruning more patterns too. As Fig. 7 shows, the number of patterns ranged from 10 (α = 10%) to 794 (α = 90%). This validates that even when the top 90% of frequent events are captured from three months of data, our algorithm is still able to provide a rather compact representation of the activity patterns. We also note that the pruning process removes a large number of patterns, considerably reducing the number of redundant patterns (see Fig. 8).
Fig. 7.
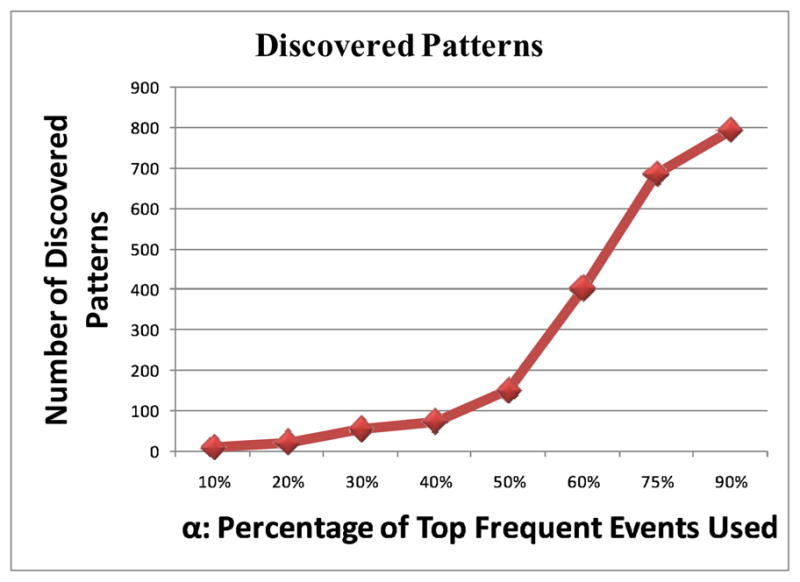
Number of discovered patterns as a function of α.
Fig. 8.
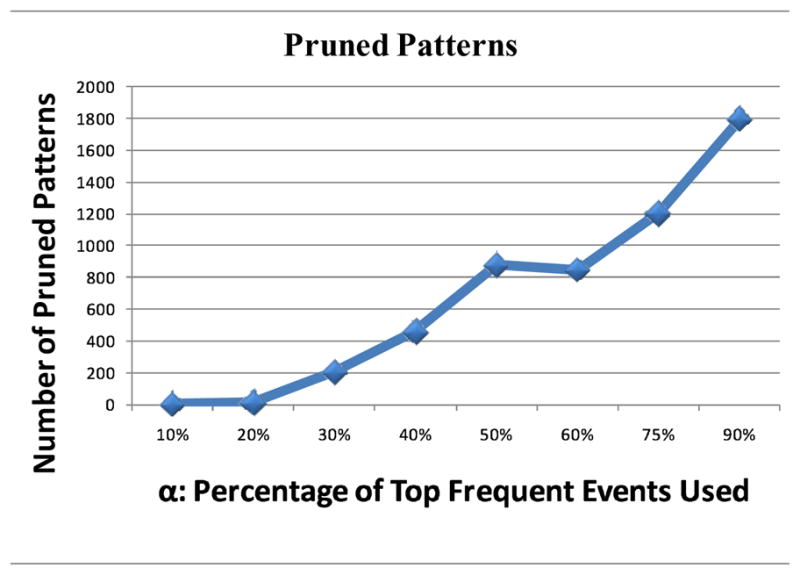
Number of pruned patterns as a function of α.
Also note that the compression thresholds (C and Cv) control the way that the “frequent continuous” patterns and the “frequent continuous variations” of patterns are discovered. We performed an experiment to observe the effect of changing the compression threshold. The experiments were run with α set to 30% where we changed C and Cv systematically. The lower we set the C compression threshold, the more patterns will be discovered as this allows for the relatively “less frequent” and “less continuous” patterns to be also included among the interesting patterns. Similarly, the lower we set the compression threshold Cv, the more pattern variations will be discovered (see Fig. 9). In our application we wanted to see how variations of patterns can be discovered, so we set Cv to a low number.
Fig. 9.
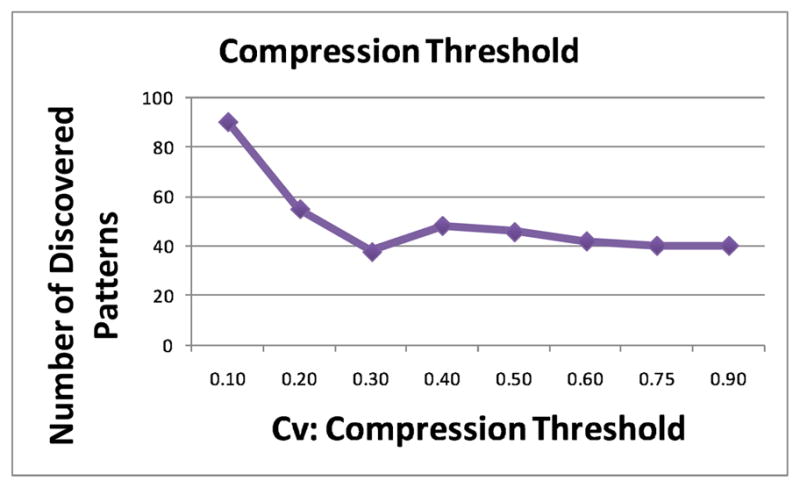
Number of discovered patterns as a function of Cv.
After discovering sequential patterns in the sensor event data, we clustered the discovered patterns into a maximum of 10, 15 and 20 clusters. Again, to investigate the impact of the number of discovered patterns on the number of formed clusters, we examined the results of varying the α threshold. For smaller values of α, the clusters tended to merge together, as there were less distinguishable patterns. As we increase α and therefore the number of discovered patterns, more distinctive clusters were formed. Once a threshold value of α was reached (α = 30%), the number of clusters remained the same, because fewer distinguishable patterns were discovered. These results are graphed in Fig. 10.
Fig. 10.

Number of discovered clusters as a function of α.
Next, we used our multi-HMM model to track the activities that had been identified by our ADM model. To verify the discovered activities, we presented the discovered activities to the residents to see if they can recognize any of those activities as their daily routines. For example, a shortened form of one discovered pattern is 〈M06, M07, M15, M17〉, which was interpreted by the residents as one person watching TV from the couch, getting up for a snack, then going back to the couch. Some of the patterns that were identified and tracked by the multi-HMM model are highlighted in Fig. 11. These patterns include preparing a meal, using the bathroom, watching TV/getting snack and resting in the bedroom (after working on the computer). These results show that DVSM can then track when the activities are performed on a continual basis in the smart home, and can be applied to large datasets collected over a long period of time.
Fig. 11.
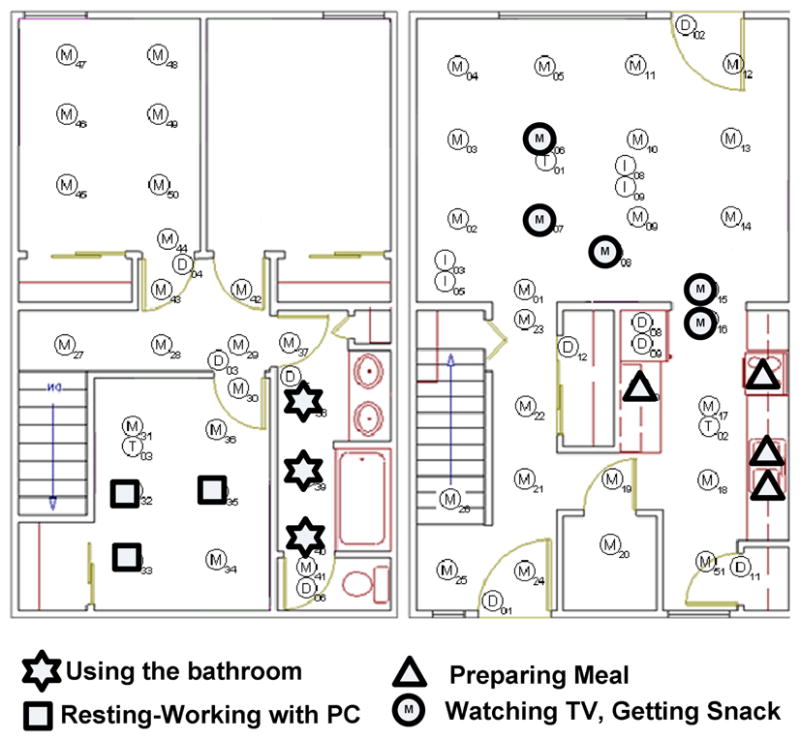
Visualization of selected discovered patterns (simplified).
6 Conclusions
In order to provide robust activity recognition and tracking capabilities for smart home residents, researchers need to consider techniques for identifying the activities to recognize and track. While most approaches target specific ADLs for tracking, this imposes a burden on annotators and residents and often introduces a source of error in the process.
We introduce an alternative method for tracking activities in smart environments. In our approach we employ our ADM algorithm to discover frequent activities that regularly and naturally occur in a resident’s environment. Models are then learned to recognize these particular activities, and the resulting findings can be used to assess the functional well being of smart environment residents.
While this is a useful advancement in the field of smart environment technologies for health monitoring and assessment, there is still additional research that can be pursued to enhance the algorithms. Currently the user specifies a desired number of activities to cluster and model. In future work we will investigate methods for automatically selecting this number based on the resident’s lifestyle. We will also investigate methods for seeding the clusters based on smart environment information and for incrementally modifying the patterns, clusters, and models as activities change over time.
Ultimately, we want to use our algorithm design as a component of a complete system that performs functional assessment of adults in their everyday environments. This type of automated assessment also provides a mechanism for evaluating the effectiveness of alternative health interventions. We believe these activity profiling technologies are valuable for providing automated health monitoring and assistance in an individual’s everyday environments.
Biographies
 Parisa Rashidi Parisa is currently a Ph.D student at Washington State University. She received her B.S.c in computer engineering from University of Tehran, Iran in 2005. In 2007, she received her M.Sc in computer science from Washington State University where she worked on CASAS project as her master thesis. Her interests include smart environments, AI and machine learning applications in health care, and human factors in pervasive computing applications.
 Diane J. Cook Dr. Diane J. Cook is a Huie-Rogers Chair Professor in the School of Electrical Engineering and Computer Science at Washington State Univeristy. Dr. Cook received a B.S. degree in Math/Computer Science from Wheaton College in 1985, a M.S. degree in Computer Science from the University of Illinois in 1987, and a Ph.D. degree in Computer Science from the University of Illinois in 1990. Her research interests include artificial intelligence, machine learning, graph-based relational data mining, smart environments, and robotics. Dr. Cook is an IEEE Fellow.
 Lawrence B. Holder Dr. Lawrence B. Holder is a Professor in the School of Electrical Engineering and Computer Science at Washington State University. Dr. Holder received a B.S., M.S., and Ph.D. from the University of Illinois in 1986, 1988, and 1991, respectively. Dr. Holder is a member of IEEE, and his research interests include artificial intelligence, machine learning, data mining, graph theory, security, and bioinformatics.
 Maureen Schmitter-Edgecombe Dr. Maureen Schmitter-Edgecombe is a Professor in the Department of Psychology at Washington State University. Dr. Schmitter-Edgecombe received a B.S. from Bucknell University in 1988 and a M.S. and Ph.D. from the University of Memphis in 1991 and 1994, respectively. Dr. Schmitter-Edgecombe’s research focuses on evaluating attention, memory, and executive functioning issues in neurological normal and clinical populations with the goal of designing and assessing rehabilitation techniques.
Contributor Information
Parisa Rashidi, Email: prashidi@eecs.wsu.edu, School of Electrical Engineering and Computer Science, Washington State University, Pullman, WA, 99163.
Diane J. Cook, School of Electrical Engineering and Computer Science, Washington State University, Pullman, WA, 99163.
Lawrence B. Holder, School of Electrical Engineering and Computer Science, Washington State University, Pullman, WA, 99163.
Maureen Schmitter-Edgecombe, Department of Psychology, Washington State University, Pullman, WA, 99163.
References
- 1.Reisberg B, Finkel S, Overall J, Schmidt-Gollas N, Kanowski S, Lehfeld H, Hulla F, Sclan SG, Wilms HU, Heininger K, Hindmarch I, Stemmler M, Poon L, Kluger A, Cooler C, Bergener M, Hugonot-Diener L, Robert PH, Erzigkeit H. The Alzheimer’s disease activities of daily living international scale (adl-is) International Psychogeriatrics. 2001;13(02):163–181. doi: 10.1017/s1041610201007566. [DOI] [PubMed] [Google Scholar]
- 2.Rialle V, Ollivet C, Guigui C, Hervé C. What do family caregivers of alzheimer’s disease patients desire in smart home technologies? contrasted results of a wide survey. Methods of Information in Medicine. 2008;47:63–9. [PubMed] [Google Scholar]
- 3.WVG, OO, CM, R-MLA Mild cognitive impairment and everyday function: Evidence of reduced speed in performing instrumental activities of daily living. American Journal of Geriatric Psychiatry. 2008 May;16(5):416–424. doi: 10.1097/JGP.0b013e31816b7303. [DOI] [PubMed] [Google Scholar]
- 4.Hayes TL, Pavel M, Larimer N, Tsay IA, Nutt J, Adami AG. Distributed healthcare: Simultaneous assessment of multiple individuals. IEEE Pervasive Computing. 2007;6(1):36–43. [Google Scholar]
- 5.Wray R, Laird J. Variability in human modeling of military simulations. Proceedings of the Behaviour Representation in Modeling and Simulation Conference; 2003. pp. 160–169. [Google Scholar]
- 6.Szewcyzk S, Dwan K, Minor B, Swedlove B, Cook D. Technology and Health Care, special issue on Smart environments: Technology to support health care. 2009. Annotating smart environment sensor data for activity learning. [DOI] [PubMed] [Google Scholar]
- 7.Parisa Rashidi DJC. the resident in the loop: Adapting the smart home to the user. IEEE Transactions on Systems, Man, and Cybernetics journal, Part A. 2009 September;39(5):949–959. [Google Scholar]
- 8.Cook D, Das S. Smart Environments: Technology, Protocols and Applications (Wiley Series on Parallel and Distributed Computing) Wiley-Interscience; 2004. [Google Scholar]
- 9.Wren C, Munguia-Tapia E. Toward scalable activity recognition for sensor networks. Proceedings of the Workshop on Location and Context-Awareness; 2006. pp. 218–235. [Google Scholar]
- 10.Cook D, Youngblood M, Heierman I, EO, Gopalratnam K, Rao S, Litvin A, Khawaja F. Mavhome: an agent-based smart home. Proceedings of the First IEEE International Conference on Pervasive Computing and Communications; March 2003; pp. 521–524. [Google Scholar]
- 11.Helal S, Mann W, El-Zabadani H, King J, Kaddoura Y, Jansen E. The gator tech smart house: A programmable pervasive space. Computer. 2005;38(3):50–60. [Google Scholar]
- 12.Doctor F, Hagras H, Callaghan V. A fuzzy embedded agent-based approach for realizing ambient intelligence in intelligent inhabited environments. IEEE Transactions on Systems, Man and Cybernetics, Part A: Systems and Humans. 2005 Jan;35(1):55–65. [Google Scholar]
- 13.Abowd G, Mynatt E. ch. Designing for the human experience in smart environments. Wiley; 2004. Smart Environments: Technology, Protocols, and Applications; pp. 153–174. [Google Scholar]
- 14.Barger T, Brown D, Alwan M. Health-status monitoring through analysis of behavioral patterns. IEEE Transactions on Systems, Man and Cybernetics, Part A: Systems and Humans. 2005 Jan;35(1):22–27. [Google Scholar]
- 15.Dieter HK, Fox D, Etzioni O, Borriello G, Arnstein L. An overview of the assisted cognition project. In AAAI-2002 Workshop on Automation as Caregiver: The Role of Intelligent Technology in Elder; 2002. [Google Scholar]
- 16.Mihailidis A, Barbenl J, Fernie G. The efficacy of an intelligent cognitive orthosis to facilitate handwashing by persons with moderate-to-severe dementia. Neuropsychological Rehabilitation. 2004;14(1):135–171. [Google Scholar]
- 17.Pollack M. Intelligent technology for an aging population: The use of ai to assist elders with cognitive impairment. AI Magazine. 2005;26(2):9–24. [Google Scholar]
- 18.Health IP. Aging in place. 2007 http://www.intel.com/research/prohealth/cs-aging_in_place.htm.
- 19.Maurer U, Smailagic A, Siewiorek D, Deisher M. Activity recognition and monitoring using multiple sensors on different body positions. International Workshop on Wearable and Implantable Body Sensor Networks, 2006. BSN 2006; April 2006; pp. 4–116. [Google Scholar]
- 20.Yin J, Yang Q, Pan JJ. Sensor-based abnormal human-activity detection. IEEE Transactions on Knowledge and Data Engineering. 2008;20(8):1082–1090. [Google Scholar]
- 21.Tapia EM, Intille SS, Larson K. Activity recognition in the home using simple and ubiquitous sensors. Pervasive Computing. 2004:158–175. [Google Scholar]
- 22.Philipose M, Fishkin KP, Perkowitz M, Patterson DJ, Fox D, Kautz H, Hahnel D. Inferring activities from interactions with objects. IEEE Pervasive Computing. 2004;3(4):50–57. [Google Scholar]
- 23.Cook D, Schmitter-Edgecombe M. Assessing the quality of activities in a smart environment. Methods of Information in Medicine. 2009 doi: 10.3414/ME0592. in press. [DOI] [PMC free article] [PubMed] [Google Scholar]
- 24.Yang J, Schilit BN, McDonald DW. Activity recognition for the digital home. Computer. 2008;41(4):102–104. [Google Scholar]
- 25.Brdiczka O, Reignier P, Crowley JL. Detecting individual activities from video in a smart home. LNCS; Proceedings of 11th International Conference on Knowledge-Based & Intelligent Information & Engineering Systems (KES), ser; Springer; 2007. pp. 363–370. [Google Scholar]
- 26.Hensel GDBK, Courtney K. Defining obtrusiveness in home telehealth technologies: A conceptual framework. Journal of the American Medical Informatics Association. 2006;13:428–431. doi: 10.1197/jamia.M2026. [DOI] [PMC free article] [PubMed] [Google Scholar]
- 27.Stauffer C, Grimson W. Learning patterns of activity using real-time tracking. IEEE Transactions on Pattern Analysis and Machine Intelligence. 2000 Aug;22(8):747–757. [Google Scholar]
- 28.van Kasteren T, Krose B. Bayesian activity recognition in residence for elders. 3rd IET International Conference on Intelligent Environments, 2007. IE 07; Sept. 2007; pp. 209–212. [Google Scholar]
- 29.Gu T, Wu Z, Tao X, Pung H, Lu J. epsicar: An emerging patterns based approach to sequential, interleaved and concurrent activity recognition. Proceedings of the IEEE International Conference on Pervasive Computing and Communication; 2009. [Google Scholar]
- 30.Liao L, Fox D, Kautz H. Location-based activity recognition using relational markov networks. Proceedings of the International Joint Conference on Artificial Intelligence; 2005. pp. 773–778. [Google Scholar]
- 31.Sánchez D, Tentori M, Favela J. Activity recognition for the smart hospital. IEEE Intelligent Systems. 2008;23(2):50–57. [Google Scholar]
- 32.Agrawal R, Srikant R. Mining sequential patterns. International Conference on Data Engineering; 1995. p. 3. [Google Scholar]
- 33.Pei J, Han J, Wang W. Constraint-based sequential pattern mining: the pattern-growth methods. Journal of Intelligent Information Systems. 2007;28(2):133–160. [Google Scholar]
- 34.Heierman I, EO, Cook D. Improving home automation by discovering regularly occurring device usage patterns. Third IEEE International Conference on Data Mining, 2003. ICDM 2003; Nov. 2003; pp. 537–540. [Google Scholar]
- 35.Ruotsalainen A, Ala-Kleemola T. Gais: A method for detecting discontinuous sequential patterns from imperfect data. Proceedings of the International Conference on Data Mining; 2007. pp. 530–534. [Google Scholar]
- 36.Pei J, Han J, Asl MB, Pinto H, Chen Q, Dayal U, Hsu MC. Prefixspan mining sequential patterns efficiently by prefix projected pattern growth. Proceedings of 17th International Conference on Data Engineering; 2001. pp. 215–226. [Google Scholar]
- 37.Zaki MJ, Lesh N, Ogihara M. Planmine: Sequence mining for plan failures. 4th International Conference of Knowledge Discovery and Data Mining; 1998. pp. 369–373. [Google Scholar]
- 38.Chen YL, Chen SS, Hsu PY. Mining hybrid sequential patterns and sequential rules. Information Systems. 2002;27(5):345–362. [Google Scholar]
- 39.Keogh E, Lin J, Truppel W. Clustering of time series subsequences is meaningless: Implications for previous and future research. ICDM ’03: Proceedings of the Third IEEE International Conference on Data Mining; Washington, DC, USA: IEEE Computer Society; 2003. p. 115. [Google Scholar]
- 40.Malde K, Coward E, Jonassen I. Fast sequence clustering using a suffix array algorithm. Bioinformatics. 2003 July;19(10):1221–1226. doi: 10.1093/bioinformatics/btg138. [DOI] [PubMed] [Google Scholar]
- 41.Levenshtein VI. Binary codes capable of correcting deletions, insertions, and reversals. Tech Rep. 1966;8 [Google Scholar]
- 42.Rissanen J. Modeling by shortest data description. Automatica. 1978;14:465–471. [Google Scholar]
- 43.Hartigan JA, Wong MA. A K-means clustering algorithm. Applied Statistics. 1979;28:100–108. [Google Scholar]
- 44.Yang J, Wang W. Towards automatic clustering of protein sequences. IEEE Computer Society Bioinformatics Conference; 2002; 2002. pp. 175–186. [PubMed] [Google Scholar]
- 45.Noh S-K, Kim Y-M, Kim D, Noh B-N. ch. Network Anomaly Detection Based on Clustering of Sequence Patterns; Computational Science and Its Applications, ser. Lecture Notes in Computer Science; May 2006; Berlin Heidelberg: Springer; 2006. pp. 349–358. [Google Scholar]
- 46.Sequeira K, Zaki M. Admit: anomaly-based data mining for intrusions. Proceedings of the International Conference on Knowledge Discovery and Data Mining; 2002. pp. 386–395. [Google Scholar]
- 47.Saneifar H, Bringay S, Laurent A, Teisseire M. S2mp: Similarity measure for sequential patterns. AusDM. 2008;87:95–104. [Google Scholar]
- 48.Sugar CA, Gareth, James M. Finding the number of clusters in a data set: An information theoretic approach. Journal of the American Statistical Association. 2003;98:750–763. [Google Scholar]
- 49.Milligan GW, Cooper MC. An examination of procedures for determining the number of clusters in a data set. Psychometrika. 1985 [Google Scholar]
- 50.Viterbi A. Error bounds for convolutional codes and an asymptotically optimum decoding algorithm. IEEE Transactions on Information Theory. 1967 Apr;13(2):260–269. [Google Scholar]
- 51.Meir R, Rätsch G. An introduction to boosting and lever-aging. Advanced Lectures on Machine Learning. 2003:118–183. [Google Scholar]
- 52.Schapire RE, Singer Y. Improved boosting algorithms using confidence-rated predictions. Machine Learning. 1999;37(3):297–336. [Google Scholar]
- 53.Freund Y, Schapire RE. EuroCOLT ’95: Proceedings of the Second European Conference on Computational Learning Theory. London, UK: Springer-Verlag; 1995. A decision-theoretic generalization of on-line learning and an application to boosting; pp. 23–37. [Google Scholar]
- 54.International HS. Using boosting to improve a hybrid hmm/neural network speech recognizer. 1999. [Google Scholar]
- 55.Dimitrakakis C, Bengio S. Boosting hmms with an application to speech recognition. 2004. [Google Scholar]
- 56.Asterisk guru. 2009 www.asteriskguru.com/tutorials.
- 57.Open instant messaging and presence. 2009 http://www.jabber.org.
- 58.Schmitter-Edgecombe M, Woo E, Greeley D. Memory deficits, everyday functioning, and mild cognitive impairment. Proceedings of the Annual Rehabilitation Psychology Conference; 2008. [Google Scholar]