Abstract
The objective of this paper is the reconstruction of upper airway geometric models as hybrid meshes from clinically used Computed Tomography (CT) data sets in order to understand the dynamics and behaviors of the pre- and postoperative upper airway systems of Obstructive Sleep Apnea Syndrome (OSAS) patients by viscous Computational Fluid Dynamics (CFD) simulations. The selection criteria for OSAS cases studied are discussed because two reasonable pre- and postoperative upper airway models for CFD simulations may not be created for every case without a special protocol for CT scanning. The geometry extraction and manipulation methods are presented with technical barriers that must be overcome so that they can be used along with computational simulation software as a daily clinical evaluation tool. Eight cases are presented in this paper, and each case consists of pre- and postoperative configurations. The results of computational simulations of two cases are included in this paper as demonstration.
Keywords: image processing, mesh generation, grid generation, hybrid meshes, Computational Fluid Dynamics (CFD), Computed Tomography (CT), Obstructive Sleep Apnea Syndrome (OSAS), Maxillomandibular Advancement (MMA)
1 Introduction
Obstructive Sleep Apnea Syndrome (OSAS) is one of the most common sleep disorders and an important public health problem to address. There is increasing evidence that OSAS is associated with a considerable number of adverse sequelae, both behavioral and physical. Behavioral consequences include daytime sleepiness, impaired concentration and neuropsychological dysfunction, whereas physical consequences include cardiovascular disorders, particularly myocardial infarction and hypertension. Young et al. estimated that 2% of women and 4% of men in the middle-aged work force meet the minimal diagnostic criteria for sleep apnea syndrome [36]. Approximately one in five adults has at least mild OSAS, and one in 15 adults has OSAS of moderate or worse severity [37]. The prevalence of OSAS increases with age, with a 2- to 3-fold higher prevalence in older persons (≥ 65 years) compared with those in middle age (30–64 years) [37]. It is estimated that 98% of adults with OSAS lack specific upper airway pathology of an obstructing nature, such as benign or malignant neoplastic lesions originating in pharyngeal structures or inflammatory or metabolic enlargement of pharyngeal soft tissue structures [25].
In order to treat OSAS, it is important to understand the severity of OSAS and the site of obstruction in each patient. Clinical indications for upper airway imaging, including nasopharyngoscopy, cephalometrics, Computed Tomography (CT), and Magnetic Resonance Imaging (MRI), are evolving for patients being treated with dental appliances and upper airway surgery. MRI and CT allow quantification of the airway and surrounding soft tissue structures in three dimensions (3D). Imaging studies provide significant insight into the static and dynamic structure and function of the upper airway and soft-tissue structure during wakefulness and sleep. However, after many attempts to assess and predict physical pathologies and outcomes of treatment for OSAS [6] [17] [18] [23], it is still difficult to demonstrate, predict, and compare the anatomy of the pharynx in patients with OSAS. Therefore, better diagnostic methods must be developed to help direct treatment options and to improve surgical outcomes.
Computational simulations have recently been performed to better understand the 3D flow in human nasal cavities and/or upper airways [5] [8] [9] [13] [14] [19] [20] [21] [22] [26] [27] [29] [32] [33] [34] [38]. However, there are several technical barriers that must be overcome so that Computational Fluid Dynamics (CFD) can be used as a daily clinical evaluation tool. Those barriers are due to not only the complex flow patterns in flexible airway walls including laminar, turbulent and transitional flow phenomena, but also the geometrical complexity of the human airways, which need to be reconstructed from medical image data. We in hold and Mlynski reported that the most time-consuming and error-prone step of their approach for simulating airflow in the human nose was the manual geometrical reconstruction of the nasal cavity from coronal CT scans because of the existence of a variety of possible causes for uncertainties, such as the spatial resolution and quality of the medical images, difficulties in precisely determining the boundary between the flow domain and the mucous membrane, or the transient nature of the interior nasal anatomy [33]. Although the small slice thickness of medical image data can greatly improve the quality of extracted airway models, their anatomical accuracy should still be validated by medical professionals. Yu et al. used the CT data with a slice thickness of 0.6 mm for OSAS pre- and postoperative upper airway simulations [38], but the details of their geometry extraction and mesh generation processes were not available.
Therefore, the focus of this paper is the reconstruction of upper airway geometric models from CT data as computational meshes (triangular meshes for the upper airway walls and hybrid meshes inside) to analyze and understand the dynamics and behavior of the human respiratory system. The hypothesis of our study is that the chances of correction of OSAS by Maxillomandibular Advancement (MMA) can be predicted by analyzing anatomical airway changes using 3D geometrical reconstruction and CFD simulations. MMA is one of the most effective surgical options to treat OSAS [30] [31]. Generalized multi-level pharyngeal collapse is thought to be the etiology of OSAS. It is difficult to clinically identify the specific site of obstruction, and it is anticipated that computational simulations will help the surgical prognosis. Since CT data has been used for pre- and postoperative clinical evaluation by measuring the anteroposterior and lateral airway dimensions, there is no extra burden for each patient to participate in this study. Pre- and postoperative CT upper airway data have been taken from 23 patients, eight of which have been chosen to generate 16 airways for CFD simulations. Two airway models are needed for every patient, which induces issues on the head position and the condition of nasal cavities to be discussed in Sections 2 and 3, respectively. Those issues are not trivial for CFD simulations, but have not been discussed in literature. Mihaescu et al. used two pharyngeal airway models of a patient before and after adenotonsillectomy [19]. Although the exclusion of the nasal cavities could make the geometry extraction process simple, the selection of a proper boundary condition could be difficult. Yu et al. created two upper airway models for each of two patients [38]. The head positions of both of the preoperative upper airway models were slightly different from those of the corresponding postoperative upper airway models, which could affect the computational results and their comparisons between pre- and postoperative changes. It is assumed in our study that the airways are rigid. This assumption poses a concern of neglecting tissue flexibility. The degree of this effect, including material property changes due to aging effects especially for children [15], has not been understood completely and should be thoroughly investigated in future studies.
There are a couple technical challenges in the reconstruction of upper airways. The extraction of geometrical models from the CT scan data can be done using open-source or commercial software tools (e.g., [1] [2]). However, the extraction often cannot be done automatically. There is expertise in choosing extraction methods and applying them with appropriate parameters in the proper order. Mesh generation is an essential preprocess for many computational simulations. It is important to have meshes of high quality while maintaining geometric fidelity so that the computational simulations can be performed in a robust and accurate manner. However, mesh generation for complex airway geometry can be challenging. The remainder of the paper is organized as follows. In Section 2, selection criteria for OSAS cases are presented. Section 3 introduces geometry extraction and manipulation methods used in our study to create upper airway models from CT data sets, which do not have high enough axial resolution for extracting detailed nasal cavities. Several technical issues are provided to discuss the reasons why the automation of this process is difficult. Next, mesh generation methods are presented in Section 4. In Section 5, resulting meshes and preliminary computational results are reported. Closing remarks are given in Section 6.
2 Selection of OSAS Cases
Upper airway CT data sets for 23 OSAS cases that have been entered into our study are listed in Table 1. Selection criteria of OSAS cases are based on not only statistical analysis of significant and very minor improvement cases from the MMA surgery, but also the condition of airway geometries in the CT data sets. There is a limitation of medical image scanning systems. A CT scan of an upper airway takes a few seconds. Compared to an MRI scan, this is fast enough for patients to hold their breath. However, different sections of the airway are still scanned at different times, so the airway geometry can be altered. The CT data sets used in our study were originally obtained for clinical evaluation purposes. As a result, some of the CT data sets are not appropriate for numerical analyses.
Table 1.
Condition of CT data sets for 23 cases and basic patient information including pre- and postoperative Respiratory Disturbance Indices (RDIs): Cases suitable for CFD simulations indicated by gray cells
| Case | Upper airways in CT data | Slice thickness [mm] | In-plane resolution [mm] | Gender | Race | Age | RDI | |||||
|---|---|---|---|---|---|---|---|---|---|---|---|---|
| Pre-op | Post-op | Head position | Pre-op | Post-op | Pre-op | Post-op | Pre-op | Post-op | ||||
| 1 | OK | OK | OK | 2.50 | 2.00 | 0.49 | 0.49 | F | White | 70 | 22.6 | 9.7 |
| 2 | Pharynx closed | Pharynx closed | 2.50 | 2.00 | 0.49 | 0.49 | M | White | 52 | 88.0 | N/A | |
| 3 | Pharynx closed | OK | 2.50 | 2.00 | 0.48 | 0.49 | M | White | 67 | 60.0 | N/A | |
| 4 | OK | Data only around mouth | 5.00 | 5.00 | 0.50 | 0.49 | F | White | 56 | 134.0 | 15.0 | |
| 5 | OK | OK | OK | 3.00 | 3.00 | 0.47 | 0.49 | M | White | 56 | 38.0 | 8.2 |
| 6 | OK | OK | OK | 2.00 | 2.50 | 0.48 | 0.43 | F | White | 62 | 17.1 | 5.4 |
| 7 | OK | OK | Mismatched | 2.00 | 2.50 | 0.51 | 0.51 | M | Black | 50 | 55.9 | N/A |
| 8 | Pharynx closed | Pharynx closed | 2.00 | 2.50 | 0.45 | 0.43 | M | White | 43 | 85.9 | 9.0 | |
| 9 | Pharynx closed | Pharynx closed | 2.50 | 2.00 | 0.43 | 0.45 | M | White | 45 | 44.0 | 0.0 | |
| 10 | Pharynx closed | Pharynx closed | 2.00 | 2.50 | 0.45 | 0.49 | F | White | 57 | 53.0 | 8.7 | |
| 11 | OK | Pharynx closed | 2.01 | 2.50 | 0.58 | 0.52 | M | Black | 42 | 77.6 | 47.0 | |
| 12 | OK | OK | OK | 2.00 | 2.50 | 0.49 | 0.49 | F | White | 63 | 14.0 | 0.7 |
| 13 | OK | OK | OK | 1.25 | 2.50 | 0.39 | 0.51 | F | White | 55 | 50.0 | 13.0 |
| 14 | Right nasal cavity closed | Left nasal cavity closed | 2.50 | 2.00 | 0.55 | 0.55 | M | White | 62 | 81.0 | “No apnea” | |
| 15 | Pharynx closed | OK | 2.00 | 2.50 | 0.45 | 0.53 | M | White | 59 | 94.0 | 1.7 | |
| 16 | OK | OK | Mismatched | 2.00 | 1.00 | 0.49 | 0.49 | M | White | 69 | 37.2 | 6.0 |
| 17 | OK | OK | Mismatched | 2.50 | 2.50 | 0.49 | 0.49 | M | White | 35 | 45.7 | N/A |
| 18 | OK | OK | OK | 2.50 | 2.50 | 0.49 | 0.50 | M | White | 52 | 40.3 | 6.0 |
| 19 | OK | OK | OK | 2.00 | 2.50 | 0.49 | 0.49 | M | White | 68 | 48.0 | 7.0 |
| 20 | Pharynx closed | OK | 2.50 | 2.50 | 0.49 | 0.49 | M | White | 76 | 58.0 | 13.0 | |
| 21 | Pharynx closed | OK | 2.50 | 2.50 | 0.49 | 0.53 | M | Black | 37 | 122.0 | 33.0 | |
| 22 | OK | Pharynx closed | Slightly mismatched | 2.50 | 2.00 | 0.51 | 0.47 | M | White | 42 | 26.5 | 1.6 |
| 23 | OK | OK | OK | 2.00 | 2.00 | 0.47 | 0.49 | M | White | 42 | 30.9 | 0.5 |
There are two important selection criteria for the CT data sets in our CFD study, which are not explicitly discussed in literature. First, an airway can be very narrow at the pharynx, but should not be closed for calculating pressure efforts. Many OSAS patients have airway collapse at the end of expiration (exhalation) when supine in the CT scanner as shown in Figure 1. There is no easy way to correct the collapsed airways. Although this problem can also be seen in literature [29], it is not discussed as a potential limitation of image- based computational and experimental simulations. Second, head positions should be similar in the two CT data sets for each patient scanned before and after the MMA surgery. Two airway models need to be created from the data sets to evaluate the surgical effect. If the head positions are changed as shown in Figure 2, for example, the airway geometries are also changed, which will affect CFD results. Despite the widespread use of the CT scanning technology in airway assessment in OSAS patients, no standard scanning protocol exists [26]. A new protocol for CT scanning must be developed in the future in order to reconstruct appropriate upper airway models for every MMA surgery evaluation.
Fig. 1.
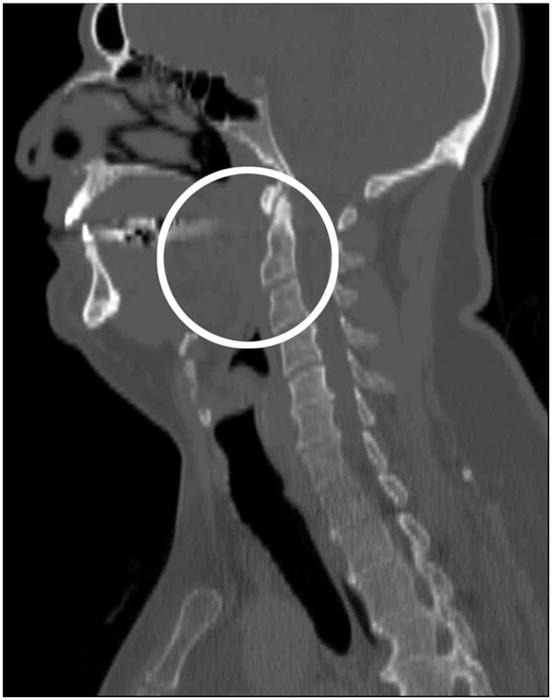
Side view of Case 2 preoperative CT data set with a closed pharyngeal airway
Fig. 2.
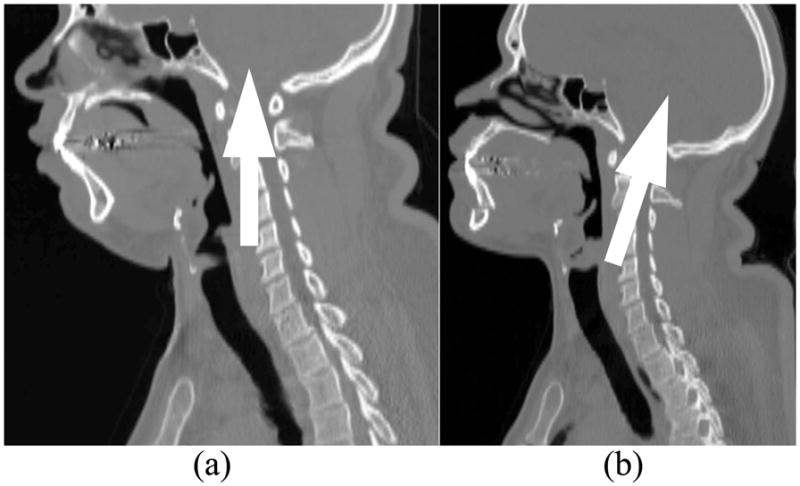
Side view of Case 7 CT data sets with arrows indicating head direction: (a) Preoperative; (b) Postoperative
3 Geometry Extraction and Manipulation
To extract patient-specific airway geometries from CT data, the open-source libraries, the Insight Segmentation and Registration Toolkit (ITK) [1] and the Visualization Toolkit (VTK) [2], are used. CT data is provided by an imaging system as a series of two dimensional (2D) axial slices through a subject. The slice thickness varies from 1.25 to 3.00 mm in each CT data set as listed in Table 1, but most are 2.50 mm thick. The in-plane resolution is approximately 0.5 mm × 0.5 mm. When calibrated to provide a high density of slices that overlap each other slightly, this data can be treated as a 3D volume image of the subject. This raw CT data is then smoothed to remove high-frequency noise by light Gaussian blurring filter. This approach provides superior results to typical 2D filtering on individual slices, as the additional information from neighboring slices is exploited. The resulting volume image is then segmented using a region-growing algorithm based on seed points that are specified by the user. This resulting volume is then used as the foundation for the creation of a triangulated surface using the Marching Cubes approach [16].
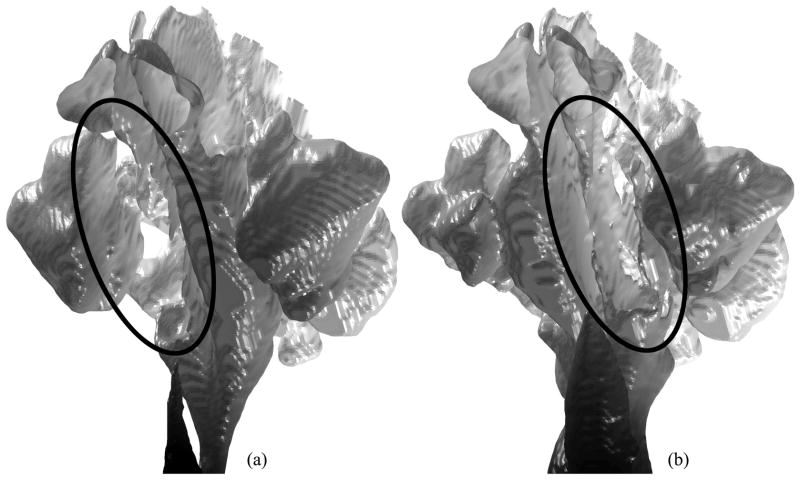
The geometry manipulation process for creating upper airway models for CFD simulations from low-resolution CT data sets is difficult to be automated. To analyze the air flow in the pharyngeal airway of a patient by CFD, an upper airway model including the nasal cavity is needed to develop the flow properly before it reaches the pharynx. However, the nasal cavity is geometrically complex, and the CT data slice thickness of 2.5 mm is still not enough to represent all of the details of the morphology of the nasal cavity and to separate it from the sinuses. Note that the large slice thickness also appears on extracted surfaces as an unavoidable stair stepping effect as shown in Figure 3, even after a shape smoothing method is applied [28]. The border between the nasal cavity and sinuses is often unclear. To create a better nasal cavity model, the border between nasal cavity and sinuses can be reconstructed from a stack of planar contours, each of which is segmented from a coronal slice [8]. Many manual modifications are still expected with the large slice thickness. Moreover, two airway models are needed for each patient at the time of pre- and postoperative evaluation in our study to evaluate the surgical effect, but the condition of the nasal cavity can be significantly changed, an unintentional effect of MMA surgery. A change in the amount of nasal mucus may be involved. The biggest change of the nasal cavity in the 23 cases in this study is observed in Case 14 as shown in Figure 3. The right nasal cavity is completely closed in the preoperative upper airway model, while the left is almost closed in the postoperative model. Although Case 14 is precluded from the CFD study because of the closed nasal cavities, minor changes in the other cases may still affect computational results.
Fig. 3.
Nasal cavity and sinus models for Case 14 (viewing from lower left; surfaces graded in axial direction from white to black): (a) Missing right nasal cavity (circled) in preoperative model; (b) Almost closed left nasal cavity (circled) in postoperative model
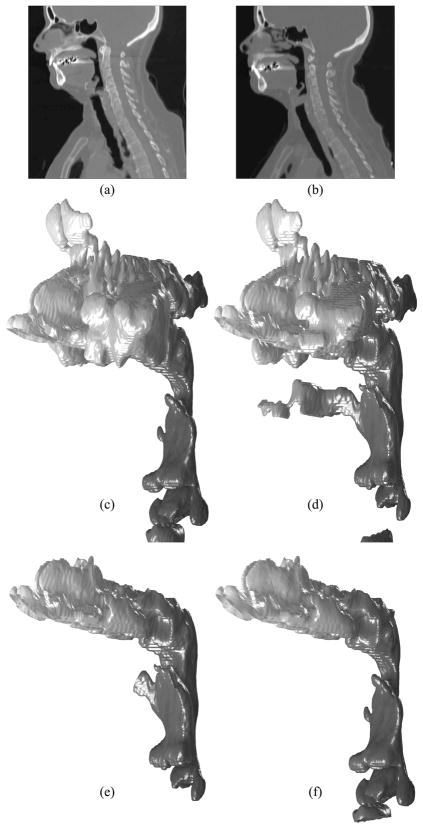
The purpose of our CFD simulations is to calculate the pressure difference at the pharyngeal airway, where the MMA surgery increases the space post- operatively. The nasal cavities are included in our upper airway models to develop airflows properly, not to analyze the detailed flow patterns at the nasal cavities. We assume that the nasal cavity geometry extracted from the CT data sets with the large slice thickness is sufficient for calculating the pressure difference at the pharyngeal airway. The following geometry extraction and manipulation steps are taken to create a pair of upper airway models for each patient as shown in Figure 4:
Fig. 4.
Geometry extraction and manipulation for Case 12: Side view of (a) pre- and (b) postoperative CT data sets; Extracted (c) pre- and (d) postoperative upper airway models without facial skin; (e) Postoperative model without sinuses; (f) Preoperative model with the nasal cavity superimposed from the postoperative model
Geometry extraction from CT data sets in Digital Imaging and Communications in Medicine (DICOM) format (Figures 4a and b) as 3D volume images using ITK and VTK to create triangulated pre- (Figures 4c) and postoperative (Figures 4d) upper airway models. Four filters are used: VTK resample filter to halve the slice thickness, VTK Gaussian smoothing filter for noise suppression, ITK connected threshold filter for segmenting airways based on the Hounsfield unit (HU), and VTK contour filter for extracting airway surface geometries. The same parameters can be used for those filters except the connected threshold filter, which is applied in the range from −1024 HU to around −300 HU. The upper threshold usually depends on each data set, and the outcome of the skin, especially around the mouth, is used as a good indicator to see if the selected upper threshold is reasonable.
Geometry manipulation of the postoperative upper airway model to remove the facial skin, sinuses, and oral cavity if shown (Figure 4e).
Extraction of the postoperative nasal cavity and superimposing it on the preoperative upper airway model (Figure 4f and Figure 5).
Cropping of the upper airway models to create outlet boundaries.
Fig. 5.
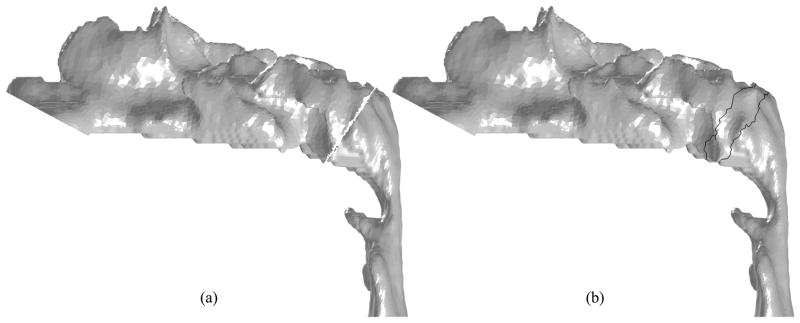
Superimposing Case 12 postoperative nasal cavity to preoperative model (side view): (a) Removal of unnecessary surfaces by a manually-selected cutting plane; (b) Triangulation of the gap and shape smoothing around it (the area surrounded by the black lines)
The detailed structure of the nasal cavity may not be available in Step 1 because of the large slice thickness of original CT data, but this approach ensures the same nasal cavity for pre- and postoperative upper airway models for each case. The preoperative nasal cavity may be selected if it is better than the postoperative one. Steps 2 and 3 are done using the Mixed-Element Grid Generator in 3D (MEGG3D) to be introduced in Section 4.
The inlet boundary for the postoperative nasal cavity and outlet boundaries for the pre- and postoperative upper airway models are created in Steps 2 and 4, respectively, by manually defining cutting planes. The outlet plane is defined at the site of the vocal cords in such a way that it is perpendicular to the longitudinal direction of the airway in this region. In Step 3, a cutting plane is also manually defined to remove the lower portion of the postoperative model and the upper portion of the preoperative model as shown in Figure 5a. Since these models are triangulated, triangles intersecting the cutting plane are also removed. The resulting gap is then filled using a Delaunay triangulation method. A shape smoothing method [28] is applied to the surface only around the cutting plane to remove the artifacts (Figure 5b).
4 Mesh Generation
To create meshes from the triangulated surface models, MEGG3D, developed by Ito et al. [10] [11] [12], is used. MEGG3D is a discrete surface based unstructured surface and volume mesh generator with mesh modification and mesh quality improvement tools. The quality of triangulated surfaces created by the Marching Cubes approach is usually poor and cannot be used as computational meshes as-is. A mesh-decimation method combined with a node-smoothing method and an edge-swapping method based on the Delaunay property enables high-quality surface mesh generation semi-automatically [12]. To control the surface mesh density, local surface curvature and volume thickness (i.e., the distance between two surfaces) can be considered.
To create hybrid meshes from surface meshes, a multiple marching direction approach is used for the near-field mesh generation to improve the quality of elements around sharp convex corners [10] [11], which are not usually evident in upper airway models. For the far-field tetrahedral mesh generation, an advancing front method is used.
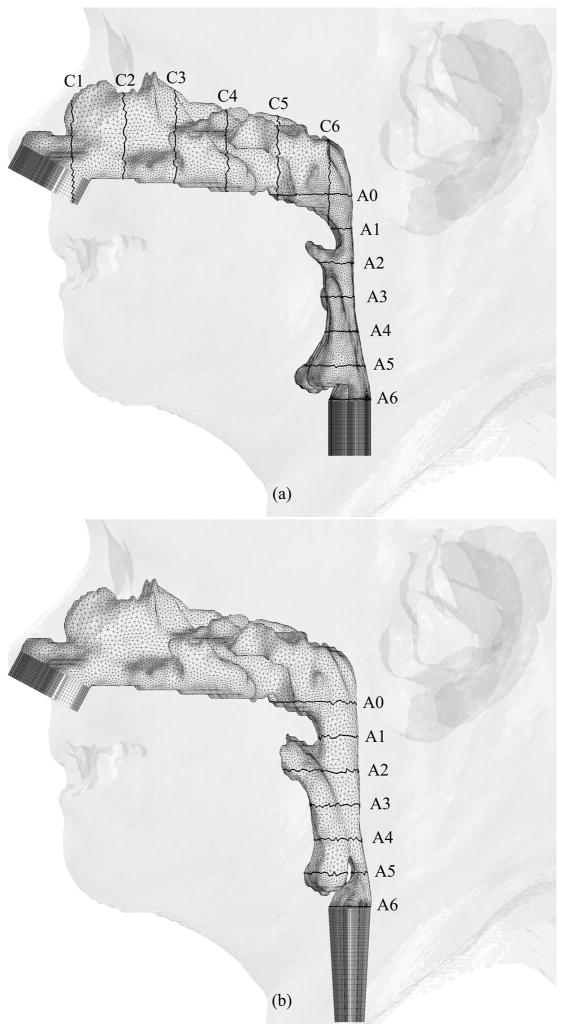
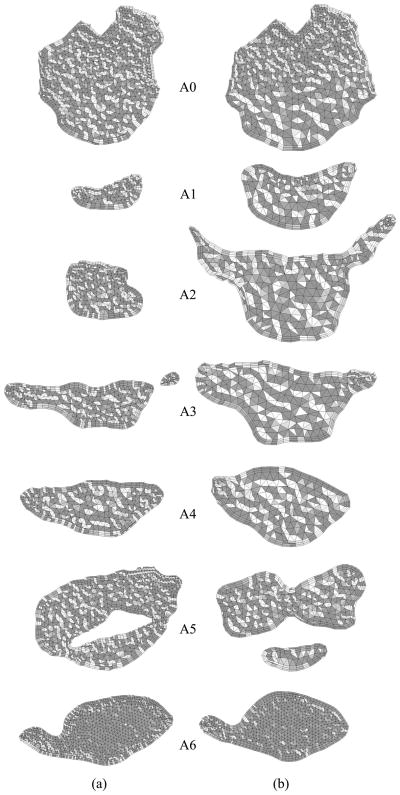
Figures 6, 7 and 8 show hybrid meshes generated for pre- and postoperative upper airway models of Case 12. The pre- and postoperative meshes have 173k and 158k nodes, respectively. Note that the increased postoperative pharyngeal airway space is also clearly shown. Our computational simulations are confined to steady laminar and turbulent inspiratory flow because negative intraluminal pressure appears during inspiration, which predisposes to collapse of the airway, while the activity of the pharyngeal dilator muscles increases to oppose these collapsing forces [7] [35]. At the inlet and outlet of each upper airway model, extensions are added by extruding inlet and outlet planes to set inlet and outlet boundary conditions easily for viscous flow simulations, shown as dark gray surfaces in Figure 6. Ten layers of the inlet plane are added at each inlet. The length of each outlet extension depends on the shape of the airway at the outlet to avoid creating recirculation regions. The cross-sections of the hybrid meshes illustrated in Figures 7 and 8 represent the complexity of the upper airway models, while good-quality elements are created even in narrow domains.
Fig. 6.
Hybrid meshes generated for Case 12 (a) pre- and (b) postoperative upper airway models with postoperative skin as reference and black lines showing positions of cross-sections illustrated in Figures 7 and 8
Fig. 7.
Coronal cross-sections of the hybrid mesh generated for Case 12 preoperative upper airway model
Fig. 8.
Axial cross-sections of hybrid meshes generated for Case 12 (a) pre- and (b) postoperative upper airway models
5 Result and Discussion
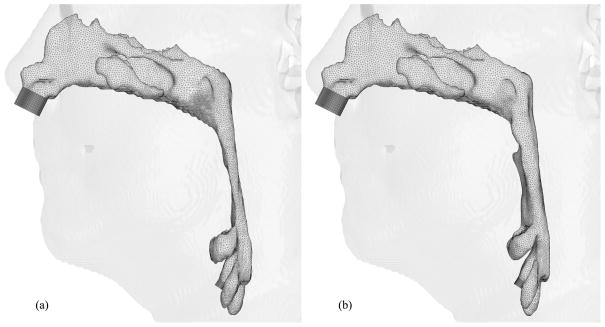
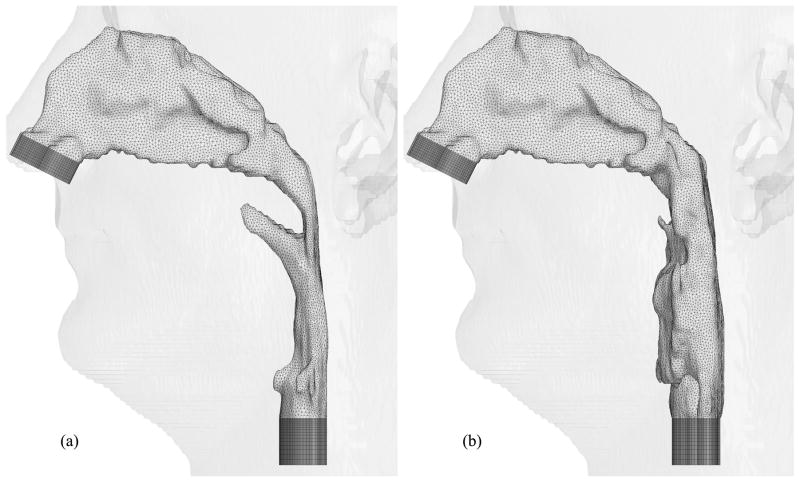
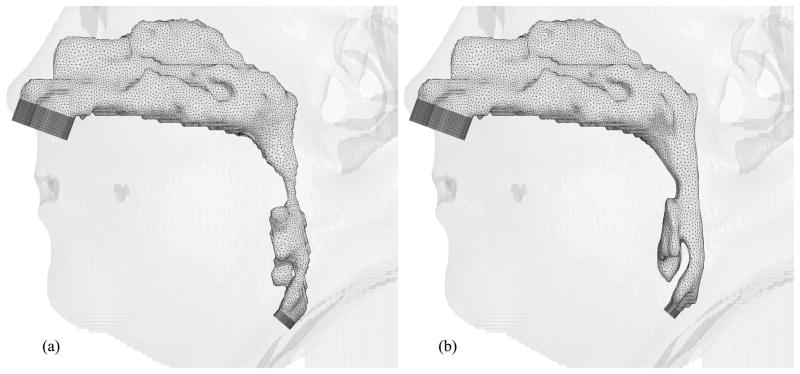
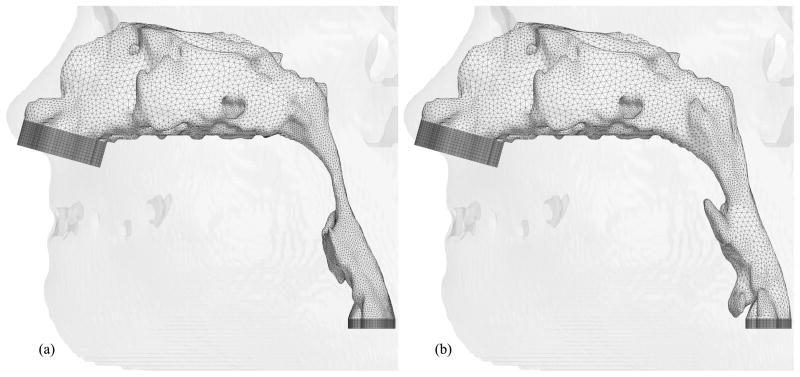
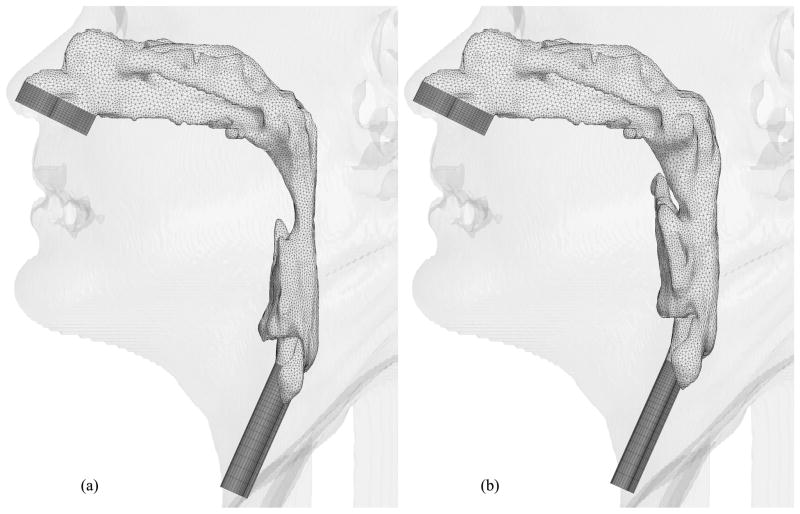
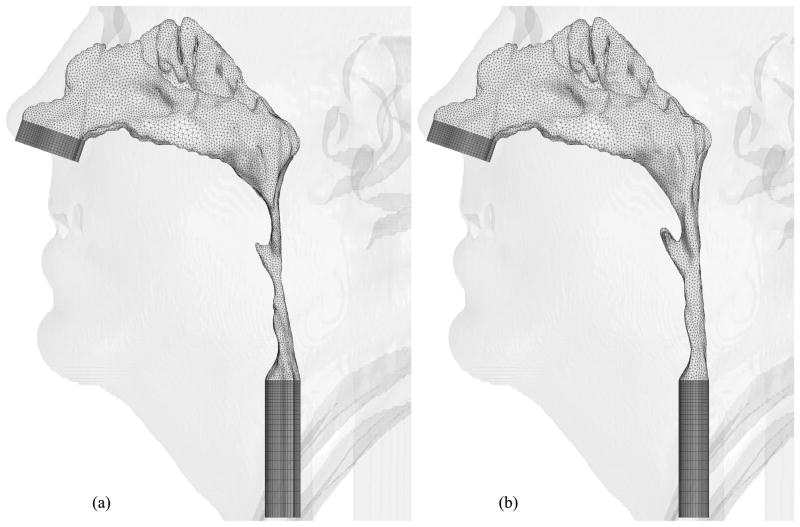
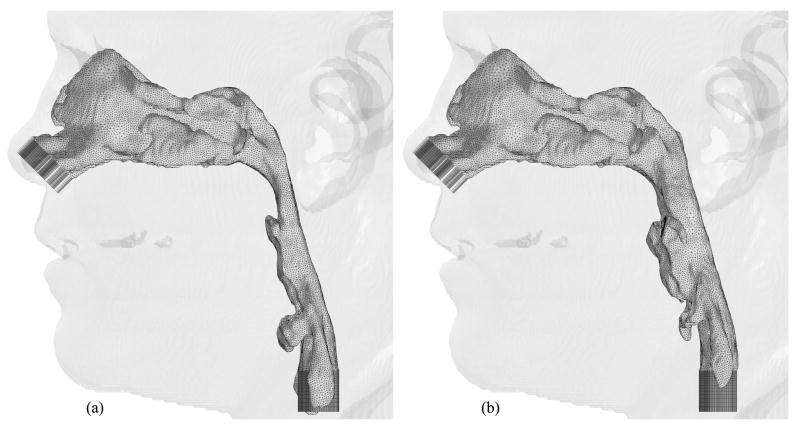
Hybrid meshes have been created for eight selected cases thus far. Figures 9, 10, 11, 12, 13, 14 and 15 illustrate the meshes other than those for Case 12 which were presented in Figures 6 through 8. The postoperative nasal cavities were superimposed on the corresponding preoperative upper airway models except Case 5 shown in Figure 10. The postoperative pharyngeal airway spaces are increased in all cases. Under the assumption of rigid airway walls, the most challenging part of our CFD simulations is the geometry manipulation and extraction process. Once this process is finished, mesh generation and computational simulations can be done quickly. The large slice thickness of CT data sets is one of the reasons why the geometry manipulation and extraction process is difficult, but even with smaller slice thickness, all the details of complex nasal cavities and sinuses are probably not available due to noise in the medical image and other reasons reported by Weinhold and Mlynski [33].
Fig. 9.
Hybrid meshes generated for Case 1 (a) pre- and (b) postoperative upper airway models with postoperative skin as reference
Fig. 10.
Hybrid meshes generated for Case 5 (a) pre- and (b) postoperative upper airway models with preoperative skin as reference
Fig. 11.
Hybrid meshes generated for Case 6 (a) pre- and (b) postoperative upper airway models with postoperative skin as reference
Fig. 12.
Hybrid meshes generated for Case 13 (a) pre- and (b) postoperative upper airway models with postoperative skin as reference
Fig. 13.
Hybrid meshes generated for Case 18 (a) pre- and (b) postoperative upper airway models with postoperative skin as reference
Fig. 14.
Hybrid meshes generated for Case 19 (a) pre- and (b) postoperative upper airway models with postoperative skin as reference
Fig. 15.
Hybrid meshes generated for Case 23 (a) pre- and (b) postoperative upper airway models with postoperative skin as reference
Since the focus of this paper is on the geometry and mesh generation for the analysis of OSAS, the CFD model used in our study is briefly described and the computational results for two patients, Cases 1 and 12, are included here for completeness. An unstructured-grid pressure-based Reynolds-averaged Navier- Stokes flow solver called UNIC [3] [24] is used. UNIC has been well validated and employed to simulate a variety of engineering problems ranging from internal to external flows and incompressible to compressible flows. In the present study, a second-order accurate spatial discretization scheme was used. The airflow was modeled as laminar and turbulent in separate simulations. The laminar viscosity of air was calculated using the Sutherland’s correlation. An extended k-ε turbulence model [4] was employed to account for the turbulence effect on the flow through the airway. Only the turbulent flow results are included here for demonstration. As mentioned earlier, the dynamic upper airway model was not available; hence, steady-state numerical simulations were performed. In the presented airflow simulations, the air had a pressure of 1 atm at the inlet and was treated as incompressible because of low flow speed. A nominal flow rate, an averaged value calculated based on the weight of the patient and a tidal volume of 7 cc/kg for one breathing cycle (12 cycles/min), was specified at the inlet. At the outlet plane of each upper airway model, a mass flow rate conservation condition was imposed, and the pressure at the outlet was calculated as a part of the solution. The density and viscosity of air used were 1.23 kg/m−3 and 1.81 × 10⁻⁵ kg/m/s, respectively. To illustrate the computational efficiency, the preoperative upper airway of Case 1 has 520k cells, and parallel computing with eight CPUs and a time step size of 5.0 × 10⁻⁴ s were used to simulate this case. 50,000 time steps were performed, which required about 40 hours of wall clock time.
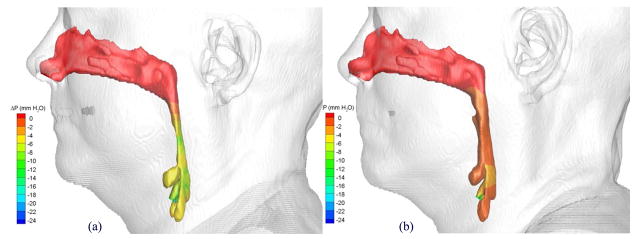
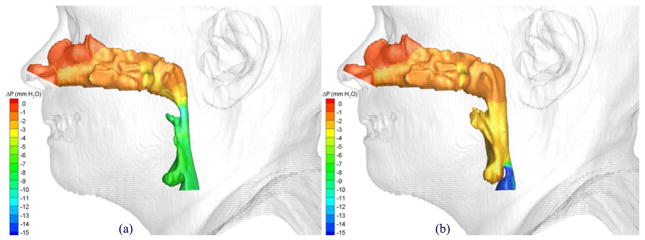
The pressure effort, ΔP, defined as the difference between the pressure along the upper airway walls and that at a reference location, was used as the key parameter for assessing the effect of the postoperative pharyngeal airway space increase due to the MMA surgery. A larger negative value of the pressure effort indicates the patient needs to breathe harder to inspire the specified air flow rate. Figures 16 and 17 show distributions of computed pressure efforts on pre- and postoperative upper airway walls of Cases 1 and 12, respectively. Colors are used to indicate the magnitude of the pressure effort in mm water, where red indicates the smallest effort and blue indicates the largest effort. It can be clearly seen that for both cases the pharyngeal airway cross-sections were enlarged due to the MMA surgery, and thus, the postoperative upper airways required less pressure efforts.
Fig. 16.
Comparison of pressures efforts of the airflow in Case 1 (a) pre- and (b) postoperative upper airway models with postoperative skin as reference
Fig. 17.
Comparison of pressures efforts of the airflow in Case 12 (a) pre- and (b) postoperative upper airway models with postoperative skin as reference
In our CFD simulations, the nasal cavities were used to develop airflows properly for pharyngeal airways. We assume that a generic nasal cavity geometric model can be developed for this purpose. It will be adjusted to every patient with several size parameters and then superimposed to the pharyngeal airways. This approach will be tested with several cases. We expect that it will ease the geometry extraction and manipulation process significantly.
6 Closing Remarks
Pre- and postoperative upper airway models were created for each of eight OSAS cases from clinically-used CT data sets to perform viscous CFD simulations. A new protocol for CT scanning is needed to create pre- and postoperative upper airway models for each patient suitable for CFD simulations. The geometry extraction and manipulation process was the most time-consuming and labor-intensive because of the low-resolution CT data sets compared to the complex human nasal cavity structure. Our steady-state, turbulent inspiratory flow simulation results for two cases clearly showed that the postoperative upper airways required less pressure efforts because of the enlarged pharyngeal airway space due to the MMA surgery. Mesh generation and CFD simulations were performed quickly once upper airway models were created. A generic nasal cavity geometric model with several size parameters will be created and tested to ease the geometry extraction and manipulation process.
Acknowledgments
This research is supported in part by the National Institute of Dental and Craniofacial Research (NIDCR) at the National Institutes of Health (NIH) No. 5R21DE017613-02. The work reported here involves intellectual property developed by Yasushi Ito, Alan Shih, and Bharat Soni and owned by Yasushi Ito, Alan Shih, Bharat Soni, and the UAB Research Foundation. This intellectual property has been licensed to Amplicode, Inc. in which Yasushi Ito and Alan Shih have a financial interest.
Footnotes
Publisher's Disclaimer: This is a PDF file of an unedited manuscript that has been accepted for publication. As a service to our customers we are providing this early version of the manuscript. The manuscript will undergo copyediting, typesetting, and review of the resulting proof before it is published in its final citable form. Please note that during the production process errors may be discovered which could affect the content, and all legal disclaimers that apply to the journal pertain.
Contributor Information
Gary C. Cheng, Email: gcheng@uab.edu.
Alan M. Shih, Email: ashih@uab.edu.
Roy P. Koomullil, Email: rkoomul@uab.edu.
Bharat K. Soni, Email: bsoni@uab.edu.
Somsak Sittitavornwong, Email: sjade@uab.edu.
Peter D. Waite, Email: pwaite@uab.edu.
References
- 1.Insight segmentation and registration toolkit (itk) doi: 10.1109/IEMBS.2007.4352434. URL http://www.itk.org/ [DOI] [PubMed]
- 2.Visualization toolkit (vtk) URL http://www.vtk.org/
- 3.Chen Y. An unstructured finite volume method for viscous flow computations. Proceedings of the 7th International Conference on Finite Element Methods in Flow Problems; Huntsville, AL: University of Alabama in Huntsville; 1989. [Google Scholar]
- 4.Chen Y-S, Kim S-W. Tech Rep NASA-CR-179204. NASA; 1987. Computation of turbulent flows using an extended k-ε turbulence closure model. [Google Scholar]
- 5.De Backer JW, Vos WG, Verhulst SL, De Backer W. Novel imaging techniques using computer methods for the evaluation of the upper airway in patients with sleep-disordered breathing: A comprehensive review. Sleep Medicine Reviews. 2008;12(6):437–447. doi: 10.1016/j.smrv.2008.07.009. [DOI] [PubMed] [Google Scholar]
- 6.Faber CE, Grymer L. Available techniques for objective assessment of upper airway narrowing in snoring and sleep apnea. Sleep and Breathing. 2003;7(2):77–86. doi: 10.1007/s11325-003-0077-9. [DOI] [PubMed] [Google Scholar]
- 7.Fogel RB, Malhotra A, White DP. Sleep 2: Pathophysiology of obstructive sleep apnoea/hypopnoea syndrome. Thorax. 2004;59:159–163. doi: 10.1136/thorax.2003.015859. [DOI] [PMC free article] [PubMed] [Google Scholar]
- 8.Gambaruto AM, Taylor DJ, Doorly DJ. Modelling nasal airflow using a fourier descriptor representation of geometry. International Journal for Numerical Methods in Fluids. 2009;59(11):1259–1283. [Google Scholar]
- 9.Huynh J, Kim KB, McQuilling M. Pharyngeal airflow analysis in obstructive sleep apnea patients pre- and post-maxillomandibular advancement surgery. Journal of Fluids Engineering. 2009;131(9):91–101. [Google Scholar]
- 10.Ito Y, Shih AM, Soni BK. Hybrid mesh generation with embedded surfaces using a multiple marching direction approach. International Journal for Numerical Methods in Fluids. in press. [Google Scholar]
- 11.Ito Y, Shih AM, Soni BK, Nakahashi K. Multiple marching direction approach to generate high quality hybrid meshes. AIAA Journal. 2007;45(1):162–167. [Google Scholar]
- 12.Ito Y, Shum PC, Shih AM, Soni BK, Nakahashi K. Robust generation of high-quality unstructured meshes on realistic biomedical geometry. International Journal for Numerical Methods in Engineering. 2006;65(6):943–973. [Google Scholar]
- 13.Jeong SJ, Kim WS, Sung SJ. Numerical investigation on the flow characteristics and aerodynamic force of the upper airway of patient with obstructive sleep apnea using computational fluid dynamics. Medical Engineering & Physics. 2007;29(6):637–651. doi: 10.1016/j.medengphy.2006.08.017. [DOI] [PubMed] [Google Scholar]
- 14.Keyhani K, Scherer PW, Mozell MM. Numerical simulation of airflow in the human nasal cavity. J Biomech Eng. 1995;117(4):429–441. doi: 10.1115/1.2794204. [DOI] [PubMed] [Google Scholar]
- 15.Kim JE, Li Z, Ito Y, Huber CD, Shih AM, Eberhardt AW, Yang KH, King AI, Soni BK. Finite element model development of a child pelvis with optimization-based material identification. Journal of Biomechanics. 2009;42(13):2191–2195. doi: 10.1016/j.jbiomech.2009.06.010. [DOI] [PubMed] [Google Scholar]
- 16.Lorensen WE, Cline HE. Marching cubes: A high resolution 3d surface construction algorithm. Computer Graphics. 1987;21(4):163–169. [Google Scholar]
- 17.Mariën S, Schmelzer B. Velopharyngeal anatomy in snorers and patients with obstructive sleep apnea. Acta Otorhinolaryngol Belg. 2002;56(2):93–99. [PubMed] [Google Scholar]
- 18.Metes A, Hoffstein V, Direnfeld V, Chapnik JS, Zamel N. Three- dimensional ct reconstruction and volume measurements of the pharyngeal airway before and after maxillofacial surgery in obstructive sleep apnea. J Otolaryngol. 1993;22(4):261–264. [PubMed] [Google Scholar]
- 19.Mihaescu M, Murugappan S, Gutmark E, Donnelly LF, Kalra M. Computational modeling of upper airway before and after adenotonsillectomy for obstructive sleep apnea. The Laryngoscope. 2008;118(2):360–362. doi: 10.1097/MLG.0b013e31815937c1. [DOI] [PubMed] [Google Scholar]
- 20.Mihaescu M, Murugappan S, Kalra M, Khosla S, Gutmark E. Large eddy simulation and reynolds-averaged navier-stokes modeling of flow in a realistic pharyngeal airway model: An investigation of obstructive sleep apnea. Journal of Biomechanics. 2008;41(10):2279–2288. doi: 10.1016/j.jbiomech.2008.04.013. [DOI] [PubMed] [Google Scholar]
- 21.Mylavarapu G, Murugappan S, Mihaescu M, Kalra M, Khosla S, Gutmark E. Validation of computational fluid dynamics methodology used for human upper airway flow simulations. Journal of Biomechanics. 2009;42(10):1553–1559. doi: 10.1016/j.jbiomech.2009.03.035. [DOI] [PubMed] [Google Scholar]
- 22.Nithiarasu P, Hassan O, Morgan K, Weatherill NP, Fielder C, Whittet H, Ebden P, Lewis KR. Steady flow through a realistic human upper airway geometry. International Journal for Numerical Methods in Fluids. 2008;57:631–651. [Google Scholar]
- 23.Schwab RJ. Upper airway imaging. Clinics in Chest Medicine. 1998;19(1):33–54. doi: 10.1016/s0272-5231(05)70430-5. [DOI] [PubMed] [Google Scholar]
- 24.Shang H, Shih M, Chen Y, Liaw P. Flow calculation on unstructured grids with a pressure-based method. Proceedings of the 6th International Symposium on Computational Fluid Dynamics; Lake Tahoe, NV. 1995. [Google Scholar]
- 25.Sher AE. Surgical management of obstructive sleep apnea. Prog Cardiovasc Dis. 1999;41(5):387–396. doi: 10.1053/pcad.1999.0410387. [DOI] [PubMed] [Google Scholar]
- 26.Stuck BA, Maurer JT. Airway evaluation in obstructive sleep apnea. Sleep Med Rev. 2008;12(6):411–436. doi: 10.1016/j.smrv.2007.08.009. [DOI] [PubMed] [Google Scholar]
- 27.Sung SJ, Jeong SJ, Yu YS, Hwang CJ, Pae EK. Customized three- dimensional computational fluid dynamics simulation of the upper airway of obstructive sleep apnea. Angle Orthodontist. 2006;76(5):791–799. doi: 10.1043/0003-3219(2006)076[0791:CTCFDS]2.0.CO;2. [DOI] [PubMed] [Google Scholar]
- 28.Taubin G. A signal processing approach to fair surface design. Proceedings of the 22nd annual conference on Computer graphics and interactive techniques; 1995. pp. 351–358. [Google Scholar]
- 29.Vos W, De Backer J, Devolder A, Vanderveken O, Verhulst S, Salgado R, Germonpre P, Partoens B, Wuyts F, Parizel P, De Backer W. Correlation between severity of sleep apnea and upper airway morphology based on advanced anatomical and functional imaging. Journal of Biomechanics. 2007;40(10):2207–2213. doi: 10.1016/j.jbiomech.2006.10.024. [DOI] [PubMed] [Google Scholar]
- 30.Waite PD, Shetter SM. Maxillomandibular advancement surgery: a cure for obstructive sleep apnea syndrome. Oral and Maxillofacial Surgery Clinics of North America. 1995;7(2):327–336. [Google Scholar]
- 31.Waite PD, Wooten V, Lachner J, Guyette RF. Maxillomandibular advancement surgery in 23 patients with obstructive sleep apnea syndrome. J Oral Maxillofac Surg. 1989;47(12):1256–61. doi: 10.1016/0278-2391(89)90719-2. discussion 1262. [DOI] [PubMed] [Google Scholar]
- 32.Wang K, Denney TS, Morrison EE, Vodyanoy VJ. Numerical simulation of air flow in the human nasal cavity. Conf Proc IEEE Eng Med Biol Soc. 2005;6:5607–5610. doi: 10.1109/IEMBS.2005.1615757. [DOI] [PubMed] [Google Scholar]
- 33.Weinhold I, Mlynski G. Numerical simulation of airflow in the human nose. European Archives of Oto-Rhino-Laryngology. 2004;261(8):452–455. doi: 10.1007/s00405-003-0675-y. [DOI] [PubMed] [Google Scholar]
- 34.Xu C, Sin S, McDonough JM, Udupa JK, Guez A, Arens R, Wootton DM. Computational fluid dynamics modeling of the upper airway of children with obstructive sleep apnea syndrome in steady flow. Journal of Biomechanics. 2006;39(11):2043–2054. doi: 10.1016/j.jbiomech.2005.06.021. [DOI] [PubMed] [Google Scholar]
- 35.Yaggi HK, Strohl KP. Adult obstructive sleep apnea/hypopnea syndrome: Definitions, risk factors, and pathogenesis. Clinics in Chest Medicine. 2010;31(2):179–186. doi: 10.1016/j.ccm.2010.02.011. [DOI] [PubMed] [Google Scholar]
- 36.Young T, Palta M, Dempsey J, Skatrud J, Weber S, Badr S. The occurrence of sleep-disordered breathing among middle-aged adults. N Engl J Med. 1993;328(17):1230–1235. doi: 10.1056/NEJM199304293281704. [DOI] [PubMed] [Google Scholar]
- 37.Young T, Skatrud J, Peppard PE. Risk factors for obstructive sleep apnea in adults. JAMA. 2004;291(16):2013–2016. doi: 10.1001/jama.291.16.2013. [DOI] [PubMed] [Google Scholar]
- 38.Yu CC, Hsiao HD, Lee LC, Yao CM, Chen NH, Wang CJ, Chen YR. Computational fluid dynamic study on obstructive sleep apnea syndrome treated with maxillomandibular advancement. Journal of Craniofacial Surgery. 2009;20(2):426–430. doi: 10.1097/SCS.0b013e31819b9671. [DOI] [PubMed] [Google Scholar]


