

Abstract
Vulnerability to abused drugs is influenced by multiple genes unique to each drug as well as to risk genes for polydrug abuse. If several inbred mouse strains respond to different drugs similarly, this implies the action of a common group of genes. Simultaneous analysis of multiple responses to multiple drugs has been attempted infrequently. We performed multivariate analyses of published strain responses to four drugs. Genetic similarity in responses did not simply track pharmacological class. Withdrawal severity and preference for ethanol and diazepam were affected by many genes in common, although inversely. We focused on behavioral responses, but there is a growing archival data base of physiological, pharmacological and biochemical strain traits. The genomics community is increasingly focusing on single nucleotide polymorphism (SNP) and haplotype-based gene mapping approaches, for which inbred strain data are also useful. Thus, similar analyses should be applicable to other laboratories, traits, and genotypes.
Introduction
Panels of genetically diverse inbred strains are a rich resource for detecting the presence of common genetic influences on multiple behavioral, pharmacological or physiological traits 1. Multiple phenotypes are measured in a number of inbred strains, and strain means for each trait are used to compare strain performance in a given test. The strain means can then be used to calculate correlation coefficients between all pairs of traits (correlation matrix), which can then be subjected to multivariate analyses. Each individual within an inbred strain is genetically identical to all other individuals of that strain, while individual differences within a strain reflect non-genetic or environmental influences. Because such correlations are based on inbred strain means, they are estimates of genetic correlations, which index the degree to which any pair of traits share common genetic influences, a condition termed pleiotropy 1. The matrix of all such correlations is a genetic correlation matrix.
Some examples of this approach include identification of similar genetic influences on withdrawal severity induced by drugs of abuse with similar pharmacological mechanisms 2, which in turn led to the identification of a chromosomal region with genes affecting severity of withdrawal from pentobarbital, ethanol and zolpidem. This region of mouse chromosome 11 harbors several GABA-A receptor subunit genes 3. Similar genetic influences affect multiple bone strength parameters 4, and multiple cardiovascular indices related to blood pressure covary among strains 5,6. Strain covariation in kainate and serotonin receptor densities in amygdala are correlated with fear-sensitized acoustic startle response 7. In another recent example, commonalities among 22 different assays of pain sensitivity were assessed in a panel of 11-12 standard inbred mouse strains by first estimating the (bivariate) genetic correlations among all pairs of assays. These were subjected to multivariate methods which suggested several clusters of common genetic influence among some of the assays, and thus presumably also common mechanisms 8,9. This approach can also be taken to study common genetic influences among diverse responses to a single drug, such as locomotor stimulation and reduction in body temperature induced by pentobarbital 10. In another analysis in inbred mouse strains, genetic correlations among many different responses to ethanol thought to reflect intoxication were generally small, suggesting that each assay (e.g., rotarod, balance beam) was reflecting a genetically unique trait and therefore could not easily be thought to represent the broad domain of “ethanol-induced intoxication.” 11.
Each correlation coefficient in a genetic correlation matrix represents the bivariate case (one pair of variables), but all of them in the aggregate (the covariance matrix) provides the starting point for most multivariate analyses where variables are analyzed in greater-than-pairwise fashion. Among the advantages of multivariate methods are the reduction in redundancy among variables (data reduction), and to reveal groups of related variables at higher levels of association than the bivariate. Studies involving a relatively large number of inbred strains offer a number of advantages over studying only one or two strains. First, they allow a more accurate assessment of the heritability, which estimates the proportion of the observed variability that is genetically determined. Second, they allow an assessment of genetic correlations, or the degree to which two traits show common genetic influences 1. For example, alcohol withdrawal severity and alcohol preference drinking are known to be genetically negatively correlated in a variety of populations derived from the C57BL/6 and DBA/2 inbred strains 12. In the analysis reported here, we sought to determine whether this same relationship also exists for the other three drugs of abuse we tested, and whether it exists when sampling alleles from 15 inbred strains rather than just two. Third, they allow the identification of genotypes (strains) that possess useful and/or interesting characteristics, such as those exhibiting very high or very low drug-seeking behavior. This can lead to further studies of the trait extremes, which may serve to model some genetic determinants of high and low abuse risk in humans. Opposite-scoring strains are often good choices for creating two-strain crosses for gene mapping efforts. Fourth, they can be useful for gene mapping studies directly rather than through crosses because of the large number of marker loci, especially SNPs, that are now available for most standard inbred strains 13-17. In addition, the fine haplotype structure mapping this new method provides can be valuable for increasing map resolution of already mapped genome regions [e.g., 14-18].
We have previously assessed the genetic influences on behavioral responses to four drugs of abuse - ethanol, pentobarbital, diazepam, and morphine. We selected four drugs that shared some common neuropharmacological actions but which also had unique actions. Ethanol acts on many neurotransmitter receptors, inhibiting N-methyl-d-aspartate (NMDA) type glutamate receptors, and potentiating glycine receptors, type-A γ-aminobutyric acid receptors (GABAA receptors), 5-hydroxytryptamine (serotonin) type-3 receptors, and neuronal nicotinic acetylcholine (neuronal nACh) receptors. Further, ethanol inhibits voltage-gated L-type calcium channels, and potentiates G-protein-coupled inward rectifier potassium (GIRK) channels 19. Like ethanol, pentobarbital potentiates GABAA receptors, but in contrast to ethanol it inhibits neuronal nACh receptors and additionally inhibits α-amino-3-hydroxy-5-methyl-4-isoxazole propionic acid (AMPA) type glutamate receptors and voltage-gated sodium and calcium channels 20. It is not clear from these studies whether the calcium channels inhibited by pentobarbital are the same as those inhibited by ethanol. Morphine is an agonist at μ-opioid, κ-opioid, and δ-opioid receptors, with highest binding to the μ-opioid receptor 21. Diazepam is a full agonist at the benzodiazepine binding site on GABAA receptors 22, similar to pentobarbital and ethanol.
All four drugs exert pronounced dose-dependent effects on locomotor activity. Locomotor stimulation, thought principally to reflect mesolimbic dopamine release, has been proposed as a behavioral surrogate for the euphoric response to drugs of abuse 23. Nearly all drugs affect thermoregulation, but the mechanisms by which they do so are myriad, and could be either genetically unique or due to common genes. All drugs will be taken orally by mice with varying degrees of preference when compared to water, and this offered a tractable method to assess reinforcement. Finally, all four drugs result in physical dependence, which can be indexed by the severity of a drug-specific withdrawal reaction. The choice of drugs allowed us to study the same group of behavioral responses - had we included a psychostimulant, for example, we could not have analyzed withdrawal easily.
We applied multivariate analyses to these published data to seek evidence for common gene action. Besides these data, few other studies have explored the drugs analyzed here in multiple inbred strains. The major exception is ethanol, for which there is a long tradition of genetic studies, and those studies have made it clear that the patterns of mouse strain differences in ethanol preference drinking are highly stable over many laboratories and over a 45+ year period 24. These analyses allowed us to address several questions, including: a) Is withdrawal severity influenced by common genes across all drugs? b) Is the locomotor stimulant response similar across drugs? c) Do stimulant and thermal sensitivity covary genetically? d) Do either stimulant or thermal responses predict withdrawal severity? e) Do withdrawal severity and reinforcement assessed from self-administration show coordinate, negatively-coupled genetic control? We assessed these response across a panel of 14-15 inbred strains. Because there were also available preference drinking data for many tastants, including these data also allowed us to ask whether preference for ethanol and sweet solutions were co-regulated, and to consider the role of taste in preference drinking of drugs of abuse.
Multivariate assessments of genetic codetermination
Our laboratories have previously published the patterns of strain differences in dose-response studies of the above responses for each drug 10,12,25-32. The data we analyzed were derived from tests of 14-15 inbred strains: A/HeJ, AKR/J, BALB/cJ, CBA/J, CE/J, C3H/HeJ, DBA/1J, DBA/2J, C57BL/6J, C57BR/cdJ, C57L/J, PL/J, SJL/J, SWR/J, and 129P3/J. Some strain data also exist for morphine-related traits 33. To compare with the preference drinking data, selected strain surveys of sweet and bitter tastants were also examined 34-38. A summary of the variables analyzed is given in Box 1, and a more detailed description of the behavioral methods is given in the Online Supplementary Material. We used multidimensional scaling (MDS) and cluster analysis to analyze the patterns of strain responses. Discussion of the multivariate methods as well as the primary bivariate strain mean correlations on which we based those analyses are also given in the Online Supplementary Material..
Box 1. Phenotypes assessed with multivariate analyses.
| Phenotype | Time tested | Drug | Doses | References |
|---|---|---|---|---|
| (time post- injection) |
(mg/kg unless noted) |
|||
|
Activity (distance traveled in cm) 0-15 |
0-30 min | Morphine Ethanol Pentobarbital Diazepam |
4,8,16,32 1,2,3 (g/kg) 10,20,30,40 2,4,8,16 |
27 28 10 26 |
|
Thermal change (°C) |
30 min | Morphine Ethanol Pentobarbital Diazepam |
4,8,16,32 1,2,3 (g/kg) 10,20,30,40 2,4,8,16 |
27 28 10 26 |
|
Withdrawal jumping |
0-15 min | Morphine (+ 12 mg/kg naloxone) |
200 | 32 |
|
Withdrawal -Acute1-12 hr |
2-12 hr | Ethanol Pentobarbital |
4 g/kg 60 |
2 2 |
| (Peak HICa) | 1-12 min | Diazepam | 20 |
25 (+ 10 mg/kg flumazenil) |
|
Withdrawal -Chronic (HIC area under the curve) |
0-25 hr | Ethanol (~150 mg% blood ethanol concentration for 72 hr) |
vapor | 29 |
|
Consumption (g/kg/day) |
4 days | Ethanol Pentobarbital Diazepam |
3,6,10% 25,50,100 mg/100 ml 10,20 |
31 |
| Morphine Quinine PTC Cycloheximide Glycine Sucrose Saccharin |
0.3 mg/ml 0.3 mg/ml 0.01% 1 μM 1.5% 1.7% 0.033% 0.2% |
32 34 38 37 36 35 35 35 |
||
HIC: handling-induced convulsion
Drug-induced activity and thermoregulation
We found a highly significant degree of genetic covariation among all of these drug responses. MDS and cluster analysis showed that activity and thermal responses clustered together (showed common genetic influences) for diazepam and pentobarbital (Figure 1A, 1B). In contrast, morphine was distinctly different, which was perhaps not surprising given its pharmacology. More surprising was that thermal responses to ethanol were also uncorrelated with those to the other drugs. This implies that the genetically-mediated mechanisms determining strain differences in thermal responses to ethanol are distinctly different from those for pentobarbital and diazepam even though all three are considered to be sedative-hypnotic drugs and all have strong GABAergic effects.
Figure 1A.
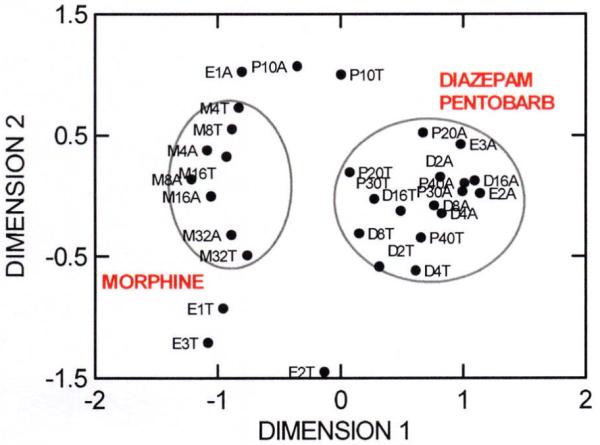
Multidimensional scaling (MDS) plot of all locomotor activity (distance traveled) in a small open field (A) and thermal response (T) traits (strain patterns represented by black dots) tested for four drugs (ethanol, E; diazepam, D; pentobarbital, P; morphine, M) across 15 inbred mouse strains. The 2nd character in each trait symbol refers to dose in g/kg (E) or mg/kg (all others) given i.p. In an MDS plot, a two-factor solution is forced, and these factors are labeled “Dimension 1” and “Dimension 2” which provide the axes for plotting aggregations or clusters among traits based on strain means. Methods and references are given in Box 1 and Supplementary Online Material. Correlation tables from which the MDS analyses were generated are given in Supplementary Table 1. Symbols for genetically correlated traits (with similar patterns of strain means) appear close together in the XY plot, while those on diametrically opposite sides of the plot are negatively correlated. Traits showing no correlation are plotted at an intermediate distance apart. Morphine responses clustered together (left oval) and were distinct from a cluster of diazepam and pentobarbital responses (right oval). Ethanol responses were less strongly correlated with pentobarbital and diazepam.
The patterns of association were also dose related. This was most clear for activity changes following drugs. It is well known that activity in mice is stimulated by low doses of ethanol and pentobarbital and tends to be reduced with higher doses. The responses to diazepam are similarly biphasic but smaller, and those to morphine tend to follow the inverse to this pattern. We saw this general pattern across strains, though individual strains varied widely (see Figure 1A, 1B and Supplementary Table 4). The novel finding from the multivariate analyses was that different genetically-mediated mechanisms are evident for activity at low doses compared to higher ones for ethanol and pentobarbital, but not diazepam or morphine. The lowest doses of ethanol and pentobarbital were themselves genetically correlated across strains for activity (r = 0.58, p = .025), suggesting that the genetic pathways that differentiate effects of low doses from larger doses are similar for both drugs. The biphasic effects of ethanol on many responses, particularly activity in mice, is well known 28,39. A similar dose-dependent pattern of common genetic influence was previously reported for ethanol, diazepam and pentobarbital among mice selectively bred for genetic resistance or sensitivity to the ataxic effect of diazepam. Mice genetically resistant to diazepam sedation exhibited greater activity in response to 1.5 and 2.0 g/kg ethanol than 1.0 g/kg, but locomotor activity did not vary significantly by dose in mice genetically sensitive mice 40.
In addition to corroborating the common genetic influence on activation to ethanol and diazepam, the current analysis shows that thermal response to these drugs is not strongly co-determined. Although all drugs generally dose-dependently reduced body temperature (see Supplementary Table 4), they probably do so through somewhat different mechanisms. For example, ethanol is known to reduce set point in mice, leading to a regulated reduction in core temperature that drives an animal to seek a colder ambient environment if one is available 41. The mechanisms underlying thermal responses to diazepam and pentobarbital are less well understood, but the current analysis suggests they may well differ from ethanol.
Consumption and withdrawal
One index of a drug’s reinforcing effects is the willingness of rodents to ingest it when offered water as an alternative fluid. We have tested two-bottle choice preference drinking data for each drug vs water from naive mice of each strain. Morphine and ethanol were preferred by the same strains, but different sets of strains preferred diazepam and pentobarbital (Figure 2 and Supplementary Table 2). Strain preferences were similar across concentrations for each drug. Preference for the other tastants was not similar to any drug preference except for the sweet tastants (sucrose, saccharin), which were genetically similar to the ethanol preference scores across strains. The genetic association of preference for sweet taste and ethanol has been well documented 42-45 and common genetic influences on morphine and ethanol consumption has also been noted 46,47. Sweet, bitter, umami, and salt taste preferences all appear to show genetic influences in mice, but those influences are largely distinct 48. If voluntary consumption is a good index of drug-seeking, our analyses, which show the distinct genetic contributions to taste preference for each drug do not strongly support a general physiological substrate for reward from all drugs.
Figure 1B.
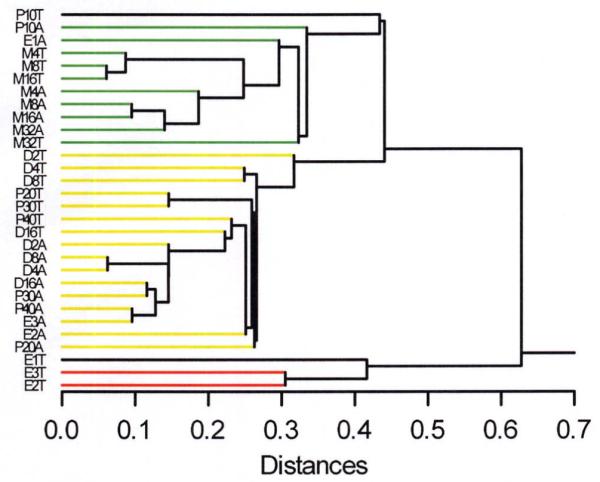
Cluster analysis tree diagram (single linkage) resulting from cluster analysis (see Online Supplementary Material) carried out on the same matrix of all correlations (Supplementary Table 1) used for MDS. Traits closely similar are connected by branches far to the left (small distances), while relatively dissimilar traits are connected far to the right (large distances).
The substrate for physical dependence also did not follow a pattern suggesting unitary genetic influences. Strains showed similar patterns of withdrawal severity from ethanol, pentobarbital, and diazepam, as shown by the clustering of withdrawal traits for these drugs in Figure 3, but morphine withdrawal was distinctly different. This is consistent with the tendency of sedative-hypnotic drugs to show similar withdrawal phenomena in humans and rodents while morphine is largely different, presumably due to its differing spectrum of effects and mechanisms of action. An additional factor that may contribute is that withdrawal was assessed using the handling-induced convulsion (HIC) for all drugs but morphine, for which other behavioral signs characteristic of opioid withdrawal were used (e.g., diarrhea, jumping) 49,50. Morphine withdrawal does not induce HIC.
Figure 2.

MDS plot of all two-bottle choice voluntary consumption (C) traits tested for the four drugs. The 2nd character in each trait symbol (black dots) refers to drug concentration in percent (E only), mg/100ml (P, D) or mg/10ml (M). Preferences for drugs were similar across concentrations (circles) and were generally unrelated to one another (see Supplementary Table 2). In addition, five tastants representing sweet (sucrose, SUC; saccharin, SAC; glycine, GLY) and bitter (phenothiocarbamide, PTC; cycloheximide, CYC; quinine, QUI) were included using data (gray squares) from previous papers (see Box 1) for the same strains. Preference for ethanol and morphine shared genetic similarity with sweet tastants.
We have previously reported a negative genetic correlation between ethanol withdrawal and ethanol preference drinking among mouse crosses and selectively bred lines derived from the C57BL/6 and DBA/2 inbred strains 12. Genotypes that drink a lot of ethanol are genetically predisposed to have low withdrawal severity, and vice versa, when exposed to only one of these two testing regimens. We therefore constructed a withdrawal/preference correlation matrix (Supplementary Table 3) in part to explore the possibility that this negative association might exist for other drugs and for a wider sampling of alleles. The negative relationship for ethanol was seen albeit less strikingly than in the earlier, more limited data. As depicted by the near opposite map positions of the withdrawal and consumption traits in Figure 3, the result was strongly corroborated for diazepam. Little evidence for parallel findings was evident for pentobarbital or morphine.
Pharmacodynamic, not pharmacokinetic basis for genetic similarities
Inbred strain differences in drug responses could be due to either effects on relevant receptors or target sites in the brain (pharmacodynamics) or to differences in the rates of drug elimination, usually by liver metabolism to inactive products (pharmacokinetics). We measured active drug concentrations in the brain or in plasma 30 min after drug administration and found no appreciable correlations between drug concentrations and any of the drug response measures taken for either morphine 27, ethanol 28 diazepam 26 or pentobarbital 10 among these 14-15 inbred strains. Thus, the contribution of pharmacokinetic factors to inbred strain drug responses, if any, were too small to be detectable. Another observation suggesting a very small role for pharmacokinetic factors is the fact that the range of drug concentrations in brain or blood among strains rarely exceeded 15%, while the activity and thermal response differences observed were often several-fold.
Future applications: gene mapping and bioinformatics
A panel of standard inbred strains was shown to be useful as a resource for gene mapping efforts for traits that are determined by the actions of many genes with individually small effects 13. However, some controversy was generated because this study was underpowered, used nonstandard statistical methods, and lacked adequate marker coverage. Now that new single nucleotide polymorphism (SNP) high-density marker sets have been developed, comprised of over 200,000 SNPs across 40 or more inbred strains and 8 million across 15 strains [Mouse Phenome Database, MPD, 2008; see below], the power of gene mapping approaches with standard inbred strains has been greatly enhanced 15-17. Even so, the effectiveness of such inbred populations is greatest when used in conjunction with mapping data for the same trait(s) from other, more traditional mapping populations such as an F2 from a two-strain cross. The primary advantages of doing this with inbreds are a much increased map resolution owing to the small haplotype block structure among inbreds, and an extension of the findings to a greater sampling of alleles, both of which can facilitate identifying the specific genes affecting the trait of interest 15-17. Gene expression microarray analysis adds tens of thousands of additional traits for analysis in the search for underpinnings of drug abuse-related traits. Multistrain analyses are increasingly being coupled with microarray data to explore drug responses and map effective specific loci because the genes whose expression is studied are known 51-53. These uses of standard inbred strain panels can be applied to the many traits being phenotyped on a panel of up to 40 inbred strains as part of the mouse phenome project 54. A useful database (Mouse Phenome Database) has been constructed at the Jackson Laboratory containing data and references for more than 1000 phenotypes for most multiple inbred strain studies in the literature (http://aretha.jax.org/pub-cgi/phenome/mpdcgi?rtn=docs/home). For example, the MPD contains data on preference for many additional tastants beyond those we studied.
This analysis has illustrated the utility of multivatiate genetic analyses to support findings from older methods and has revealed some novel relationships. Most importantly, the effects of genes to promote similar responses across genotypes do not necessarily follow drug pharmacological class (viz., the independent genetic contributions to preference for the four drugs). Also, genes do not appear to influence these drug responses through pharmakokinetic mechanisms, but rather through pharmacodynamic substrates. The previously published primary data papers found that the strain differences analyzed here were generally similar to those from other publications with many fewer strains. Thus, there is reason to believe that the relationships suggested in these analyses will generalize to other laboratories and to novel genotypes. Coupled with the steadily growing Mouse Phenome Database, this approach should be useful for many other questions regarding the pharmacological mechanisms of action of drugs of abuse.
Box 2. Glossary.
Allele: One of two or more alternative forms of a gene at a specific locus on a chromosome.
Cluster analysis: A type of multivariate analysis that groups variables based on their similarity to one another in terms of individual (strain) differences on each variable. The groupings are achieved through a hierarchical, iterative process and the results are displayed as a branching tree (dendrogram). Cluster analysis is often used to determine the phylogenetic similarity of receptor subtypes, for example.
Genetic correlation: A bivariate correlation coefficient based on genetic covariance rather than phenotypic covariance. This statistic can be estimated by the Pearson correlation between two traits based on inbred strain means (genetic correlation) rather than individual mice (phenotypic correlation).
Genotype: The genetic constitution of an organism. For each gene, an individual may be a homozygote (i.e., possess two identical alleles) or a heterozygote (i.e., possess two different alleles). Inbred strains (vide infra) are obligate homozygotes at each gene locus.
Haplotype: A set of closely linked alleles that tend to be inherited as a unit. Variation in haplotypes rather than in individual alleles are often used as the object of genetic studies seeking association (or linkage) of particular forms of a gene with a disease.
Inbred strain: At each gene, all members of an inbred strain possess the same two, identical alleles. All same-sex members of an inbred strain are therefore genetically identical. Inbred strains are typically produced by more than 20 generations of brother-sister matings.
Multivariate analyses: In contrast to statistical analyses that consider a single variable for analysis, or two variables (bivariate), multivariate approaches simultaneously consider variation for more than two variables. The primary goal is to assess higher-order relationships among variables that extend beyond the bivariate case of looking at all possible pairs of variables.
Multidimensional scaling (MDS): A type of multivariate analysis similar to cluster analysis or principal components analysis. Relationships among multiple variables are displayed in a graphic plot resembling a map. Map distance reflects the collective degree of overall similarity among multiple variables based on individual differences (strains in the current case) on each variable.
Phenotypic correlation: A bivariate correlation coefficient based on phenotypic covariance. The general degree of relationship between individuals’ scores on two phenotypes. The underlying covariance used to estimate phenotypic correlations can be partitioned into genetic covariance and environmental covariance (i.e., all that is not genetic). The genetic covariance determines the genetic correlation (vide supra).
Phenotype: Any measured trait. Phenotypes in the current paper include drug withdrawal severity and change in body temperature after a given dose of a given drug.
Single nucleotide polymorphism (SNP): A genetic difference of a single nucleotide within a DNA sequence resulting in different alleles within a given population. SNPs are very common (about every 1000 bases) and can be used singly, or as part of a haplotype (vide infra) to track inheritance.
Supplementary Material
Figure 3.

MDS plot of all two-bottle choice voluntary consumption (C) and acute withdrawal severity (WD) traits. EWDC refers to withdrawal from chronic exposure to ethanol vapor. Similar groups of strains had severe withdrawal scores from ethanol, diazepam and pentobarbital (left circle). These same strains tended to have low preference for ethanol and morphine, as well as high concentrations of pentobarbital and 10 mg/100 mL diazepam (right circle). See Box 1, Supplementary Table 3, and Online Supplementary Material).
Acknowledgments
These studies were supported by grants AA10760, AA06243, AA05828, DA10913, DA05228 from the NIH and by two grants from the Department of Veterans Affairs. PM and EHB were supported by NIH training grants DA07262 and AA07468.
Reference List
- 1.Crabbe JC, et al. Genetic animal models of alcohol and drug abuse. Science. 1994;264:1715–1723. doi: 10.1126/science.8209252. [DOI] [PubMed] [Google Scholar]
- 2.Metten P, Crabbe JC. Common genetic determinants of severity of acute withdrawal from ethanol, pentobarbital and diazepam in inbred mice. Behav Pharmacol. 1994;5:533–547. doi: 10.1097/00008877-199408000-00014. [DOI] [PubMed] [Google Scholar]
- 3.Hood HM, et al. Fine mapping of a sedative-hypnotic drug withdrawal locus on mouse chromosome 11. Genes Brain Behav. 2006;5:1–10. doi: 10.1111/j.1601-183X.2005.00122.x. [DOI] [PubMed] [Google Scholar]
- 4.Wergedal JE, et al. Genetic variation in femur extrinsic strength in 29 different inbred strains of mice is dependent on variations in femur cross-sectional geometry and bone density. Bone. 2005;36:111–122. doi: 10.1016/j.bone.2004.09.012. [DOI] [PubMed] [Google Scholar]
- 5.Tsukahara C, et al. Blood pressure in 15 inbred mouse strains and its lack of relation with obesity and insulin resistance in the progeny of an NZO/HILtJ x C3H/HeJ intercross. Mamm Genome. 2004;15:943–950. doi: 10.1007/s00335-004-2411-3. [DOI] [PubMed] [Google Scholar]
- 6.Halushka MK, et al. Patterns of single-nucleotide polymorphisms in candidate genes for blood-pressure homeostasis. Nat Genet. 1999;22:239–247. doi: 10.1038/10297. [DOI] [PubMed] [Google Scholar]
- 7.Bouwknecht JA, Paylor R. Behavioral and physiological mouse assays for anxiety: a survey in nine mouse strains. Behav Brain Res. 2002;136:489–501. doi: 10.1016/s0166-4328(02)00200-0. [DOI] [PubMed] [Google Scholar]
- 8.Mogil JS, et al. Heritability of nociception II. ‘Types’ of nociception revealed by genetic correlation analysis. Pain. 1999;80:83–93. doi: 10.1016/s0304-3959(98)00196-1. [DOI] [PubMed] [Google Scholar]
- 9.Lariviere WR, et al. Heritability of nociception. III. Genetic relationships among commonly used assays of nociception and hypersensitivity. Pain. 2002;97:75–86. doi: 10.1016/s0304-3959(01)00492-4. [DOI] [PubMed] [Google Scholar]
- 10.Crabbe JC, et al. Genetic determinants of sensitivity to pentobarbital in inbred mice. Psychopharmacology. 2002;161:408–416. doi: 10.1007/s00213-002-1042-1. [DOI] [PubMed] [Google Scholar]
- 11.Crabbe JC, et al. An analysis of the genetics of alcohol intoxication in inbred mice. Neurosci Biobehav Rev. 2005;28:785–802. doi: 10.1016/j.neubiorev.2004.08.002. [DOI] [PubMed] [Google Scholar]
- 12.Metten P, et al. High genetic susceptibility to ethanol withdrawal predicts low ethanol consumption. Mamm Genome. 1998;9:983–990. doi: 10.1007/s003359900911. [DOI] [PubMed] [Google Scholar]
- 13.Grupe A, et al. In silico mapping of complex disease-related traits in mice. Science. 2001;292:1915–1918. doi: 10.1126/science.1058889. [DOI] [PubMed] [Google Scholar]
- 14.Wiltshire T, et al. Genome-wide single-nucleotide polymorphism analysis defines haplotype patterns in mouse. Proc Natl Acad Sci USA. 2003;100:3380–5. doi: 10.1073/pnas.0130101100. [DOI] [PMC free article] [PubMed] [Google Scholar]
- 15.Cervino AC, et al. An integrated in silico gene mapping strategy in inbred mice. Genetics. 2007;175:321–333. doi: 10.1534/genetics.106.065359. [DOI] [PMC free article] [PubMed] [Google Scholar]
- 16.Kang HM, et al. Efficient control of population structure in model organism association mapping. Genetics. 2008;178:1709–1723. doi: 10.1534/genetics.107.080101. [DOI] [PMC free article] [PubMed] [Google Scholar]
- 17.Wang J, et al. Computational genetics: from mouse to human? Trends Genet. 2005;21:526–532. doi: 10.1016/j.tig.2005.06.010. [DOI] [PubMed] [Google Scholar]
- 18.Fehr C, et al. Congenic mapping of alcohol and pentobarbital withdrawal liability loci to a <1 centimorgan interval of murine chromosome 4: Identification of Mpdz as a candidate gene. J Neurosci. 2002;22:3730–3738. doi: 10.1523/JNEUROSCI.22-09-03730.2002. [DOI] [PMC free article] [PubMed] [Google Scholar]
- 19.Vengeliene V, et al. Neuropharmacology of alcohol addiction. Br J Pharmacol. 2008;154:299–315. doi: 10.1038/bjp.2008.30. [DOI] [PMC free article] [PubMed] [Google Scholar]
- 20.Kawai J, et al. Functional annotation of a full-length mouse cDNA collection. Nature. 2001;409:685–690. doi: 10.1038/35055500. [DOI] [PubMed] [Google Scholar]
- 21.McClung CA. The molecular mechanisms of morphine addiction. Rev Neurosci. 2006;17:393–402. doi: 10.1515/revneuro.2006.17.4.393. [DOI] [PubMed] [Google Scholar]
- 22.Krogsgaard-Larsen P, et al. Specific GABA(A) agonists and partial agonists. Chem Rec. 2002;2:419–430. doi: 10.1002/tcr.10040. [DOI] [PubMed] [Google Scholar]
- 23.Wise RA, Bozarth MA. A psychomotor stimulant theory of addiction. Psychol Rev. 1987;94:469–492. [PubMed] [Google Scholar]
- 24.Wahlsten D, et al. Stability of inbred mouse strain differences in behavior and brain size between laboratories and across decades. Proc Nat Acad Sci USA. 2006;103:16364–16369. doi: 10.1073/pnas.0605342103. [DOI] [PMC free article] [PubMed] [Google Scholar]
- 25.Metten P, Crabbe JC. Genetic determinants of severity of acute withdrawal from diazepam in mice: commonality with ethanol and pentobarbital. Pharmacol Biochem Behav. 1999;63:473–479. doi: 10.1016/s0091-3057(99)00017-9. [DOI] [PubMed] [Google Scholar]
- 26.Crabbe JC, et al. Genetic determinants of sensitivity to diazepam in inbred mice. Behav Neurosci. 1998;112:668–677. doi: 10.1037//0735-7044.112.3.668. [DOI] [PubMed] [Google Scholar]
- 27.Belknap JK, et al. Genetic determinants of morphine activity and thermal responses in 15 inbred mouse strains. Pharmacol Biochem Behav. 1998;59:353–360. doi: 10.1016/s0091-3057(97)00421-8. [DOI] [PubMed] [Google Scholar]
- 28.Crabbe JC, et al. Genetic determinants of sensitivity to ethanol in inbred mice. Behav Neurosci. 1994;108:186–195. doi: 10.1037//0735-7044.108.1.186. [DOI] [PubMed] [Google Scholar]
- 29.Metten P, Crabbe JC. Alcohol withdrawal severity in inbred mouse (Mus musculus) strains. Behav Neurosci. 2005;119:911–925. doi: 10.1037/0735-7044.119.4.911. [DOI] [PubMed] [Google Scholar]
- 30.Belknap JK, et al. Voluntary consumption of morphine in 15 inbred mouse strains. Psychopharmacology. 1993;112:352–358. doi: 10.1007/BF02244932. [DOI] [PubMed] [Google Scholar]
- 31.Belknap JK, et al. Voluntary consumption of ethanol in 15 inbred mouse strains. Psychopharmacology. 1993;112:503–510. doi: 10.1007/BF02244901. [DOI] [PubMed] [Google Scholar]
- 32.Metten P, et al. Genetic correlates of morphine withdrawal in fourteen inbred mouse strains. Drug Alc Depen. 2008 doi: 10.1016/j.drugalcdep.2008.07.006. accepted pending minor revision. [DOI] [PMC free article] [PubMed] [Google Scholar]
- 33.Kest B, et al. Genetic variation in morphine analgesic tolerance. A survey of 11 inbred mouse strains. Pharmacol Biochem Behav. 2002;73:821. doi: 10.1016/s0091-3057(02)00908-5. [DOI] [PubMed] [Google Scholar]
- 34.Lush IE. The genetics of tasting in mice III. Quinine. Genet Res Cambridge. 1984;44:151–160. doi: 10.1017/s0016672300026355. [DOI] [PubMed] [Google Scholar]
- 35.Lush IE. The genetics of tasting in mice. VI. Saccharin, acesulfame, dulcin and sucrose. Genet Res. 1989;53:95–99. doi: 10.1017/s0016672300027968. [DOI] [PubMed] [Google Scholar]
- 36.Lush IE, et al. The genetics of tasting in mice VII. Glycine revisited, and the chromosomal location of Sac and Soa. Gen Res Cambridge. 1995;66:167–174. doi: 10.1017/s0016672300034510. [DOI] [PubMed] [Google Scholar]
- 37.Lush IE, Holland G. The genetics of tasting in mice. V. Glycine and cycloheximide. Genet Res. 1988;52:207–212. doi: 10.1017/s0016672300027671. [DOI] [PubMed] [Google Scholar]
- 38.Lush IE. Differences between mouse strains in their consumption of phenylthiourea (PTC) Heredity. 1986;57(Pt 3):319–323. doi: 10.1038/hdy.1986.129. [DOI] [PubMed] [Google Scholar]
- 39.Pohorecky LA. Biphasic actions of alcohol. Biobehav Rev. 1977;1:231–240. [Google Scholar]
- 40.Phillips T, Gallaher EJ. Locomotor responses to benzodiazepines, barbiturates and ethanol in diazepam-sensitive(DS) and -resistant(DR) mice. Psychopharmacology. 1992;107:125–131. doi: 10.1007/BF02244976. [DOI] [PubMed] [Google Scholar]
- 41.Gordon CJ. Temperature Regulation in Laboratory Rodents. Cambridge University Press; 1993. [Google Scholar]
- 42.Overstreet DH, et al. Saccharin intake predicts ethanol intake in genetically heterogeneous rats as well as different rat strains. Alcohol Clin Exp Res. 1993;17(2):366–369. doi: 10.1111/j.1530-0277.1993.tb00777.x. [DOI] [PubMed] [Google Scholar]
- 43.Blizard DA, McClearn GE. Association between ethanol and sucrose intake in the laboratory mouse: exploration via congenic strains and conditioned taste aversion. Alcohol Clin Exp Res. 2000;24:253–258. [PubMed] [Google Scholar]
- 44.Lemon CH, et al. Alcohol activates a sucrose-responsive gustatory neural pathway. J Neurophysiol. 2004;92:536–544. doi: 10.1152/jn.00097.2004. [DOI] [PubMed] [Google Scholar]
- 45.Dess NK, et al. Ethanol consumption in rats selectively bred for differential saccharin intake. Alcohol. 1998;16:275–278. doi: 10.1016/s0741-8329(98)00010-x. [DOI] [PubMed] [Google Scholar]
- 46.Nichols JR, Hsiao S. Addiction liability of albino rats: breeding for quantitive differences in morphine drinking. Science. 1967;157:561–563. doi: 10.1126/science.157.3788.561. [DOI] [PubMed] [Google Scholar]
- 47.Satinder KP. Alcohol-morphine interaction: oral intake in genetically selected Maudsley rats. Pharmacol Biochem Behav. 1982;16:707–711. doi: 10.1016/0091-3057(82)90222-2. [DOI] [PubMed] [Google Scholar]
- 48.Boughter JD, Jr., Bachmanov AA. Behavioral genetics and taste. BMC Neurosci. 2007;8(Suppl 3):S3. doi: 10.1186/1471-2202-8-S3-S3. [DOI] [PMC free article] [PubMed] [Google Scholar]
- 49.Kliethermes CK, et al. Selection for pentobarbital withdrawal severity: Correlated differences in withdrawal from other sedative drugs. Brain Res. 2004;1009:17–25. doi: 10.1016/j.brainres.2004.02.040. [DOI] [PubMed] [Google Scholar]
- 50.O’Brien CP. Drug addiction and drug abuse. In: Hardman J, Limbird L, editors. The Pharmacological Basis of Therapeutics. 10th edn McGraw-Hill Publishing Company; 2001. pp. 621–642. [Google Scholar]
- 51.Letwin NE, et al. Combined application of behavior genetics and microarray analysis to identify regional expression themes and gene-behavior associations. J Neurosci. 2006;26:5277–5287. doi: 10.1523/JNEUROSCI.4602-05.2006. [DOI] [PMC free article] [PubMed] [Google Scholar]
- 52.Mulligan MK, et al. Toward understanding the genetics of alcohol drinking through transcriptome meta-analysis. Proc Nat Acad Sci USA. 2006;103:6368–6373. doi: 10.1073/pnas.0510188103. [DOI] [PMC free article] [PubMed] [Google Scholar]
- 53.Mulligan MK, et al. Alcohol trait and transcriptional genomic analysis of C57BL/6 substrains. Genes Brain Behav. 2008 doi: 10.1111/j.1601-183X.2008.00405.x. online ahead of print doi: 10.1111/j.1601-183X.2008.00405. [DOI] [PubMed] [Google Scholar]
- 54.Grubb SC, et al. A collaborative database of inbred mouse strain characteristics. Bioinformatics. 2004;20:2857–2859. doi: 10.1093/bioinformatics/bth299. [DOI] [PubMed] [Google Scholar]
Associated Data
This section collects any data citations, data availability statements, or supplementary materials included in this article.