

Abstract
Rapamycin is an inhibitor of the mammalian Target of Rapamycin, mTOR, a nutrient-sensing signaling kinase and a key regulator of cell growth and proliferation. While rapamycin and related compounds have anti-tumor activity, a prevalent characteristic of cancer cells is resistance to their anti-proliferative effects. Our studies on nutrient regulation of fetal development showed that hepatocyte proliferation in the late gestation fetal rat is resistant to rapamycin. Extension of these studies to other tissues in the fetal and neonatal rat indicated that rapamycin resistance is a characteristic of normal cell proliferation in the growing organism. In hepatic cells, ribosomal biogenesis and cap-dependent protein translation were found to be relatively insensitive to the drug even though mTOR signaling was highly sensitive. Cell cycle progression was also resistant at the level of cyclin E-dependent kinase activity. Studies on the effect of rapamycin on gene expression in vitro and in vivo demonstrated that mTOR-mediated regulation of gene expression is independent of effects on cell proliferation and cannot be accounted for by functional regulation of identifiable transcription factors. Genes involved in cell metabolism were overrepresented among rapamycin-sensitive genes. We conclude that normal cellular proliferation in the context of a developing organism can be independent of mTOR signaling, that cyclin E-containing complexes are a critical locus for rapamycin sensitivity, and that mTOR functions as a modulator of metabolic gene expression in cells that are resistant to the anti-proliferative effects of the drug.
Key words: mTOR, mammalian target of rapamycin, cell cycle, translation control, gene expression, cell signaling, protein phosphorylation
Introduction
Rapamycin, a macrolytic lactone produced by the soil bacteria Streptomyces hygroscopicus, was originally identified in the early 1970s.1 Nearly a decade after its discovery, rapamycin, also known as sirolimus, was found to have anti-tumor effects in vivo.2 Upon entering the cell, rapamycin forms an intracellular complex with a 12 kDa member of the immunophilin protein family termed FK506-binding protein 12 (FKBP12).3 This complex binds to a large cytoplasmic protein (∼290 kDa) that functions as a nutrient-sensing Ser/Thr kinase in mammalian cells. Based on an interaction with the rapamycin-FKBP12 complex, two proteins, first discovered in yeast, were assigned the name “Target of Rapamycin,” or TOR.4 The mammalian counterpart of these proteins, mTOR, was soon identified and characterized.5
mTOR is present in mammalian cells as a component of two complexes, termed mTOR Complex 1 and 2 (mTORC1, mTORC2).6 mTORC2, which is a regulator of the cytoskeleton, is insensitive to the inhibitory effects of rapamycin.7 In contrast, mTORC1-mediated signaling events are generally sensitive to rapamycin, albeit to varying degrees.7 Rapamycin, which is not known to interact with any cell signaling component other than mTORC1, attenuates the biological effects of mTORC1 activation. These include, but are not limited to, activation of protein translation,8 promotion of G1 cell cycle progression,9 suppression of autophagy,10 both activation and inhibition of apoptosis,11 and modulation of whole body metabolism.12
Rapamycin Resistance
The original observation that rapamycin has anti-tumor properties led to its use as an anti-cancer drug.13 Clinicaltrials.gov, a registry maintained by the National Institutes of Health, shows over three hundred clinical trials utilizing rapamycin as a therapeutic agent in relationship to cancer. Some of these trials are focused on the immunosuppressive effects of rapamycin (to suppress, for example, graft versus host disease), while others are aimed at assessing the effects of rapamycin on coincident cancer in patients receiving this immunosuppressive drug post-transplant. However, the majority of these trials are focused on the direct anti-tumor effects of rapamycin and its analogs. While the anti-tumor effects of rapamycin are well documented,14,15 a prevalent characteristic of rapamycin as a cancer chemotherapeutic agent is the phenomenon of rapamycin resistance.16–18 The cytostatic effect of rapamycin and its analogs has been found to wane or to be absent at the outset of therapy in a variety of human cancers. Clinical observations have indicated rapamycin resistance across a broad spectrum of malignancies, including acute myelogenous leukemia,19 renal cancer,20 pancreatic cancer,21 and perivascular epithelioid cell tumors.22 Most relevant to our work is the observation that the mTOR pathway is dysregulated in 40–50% of hepatocellular carcinoma (HCC),23 although the therapeutic efficacy of mTOR inhibitors in HCC is not known.
While not always explicitly stated, the term “rapamycin resistance” refers to a loss of the ability of rapamycin to inhibit cell cycle progression. It is often presumed that this action of the drug is directly related to its ability to inhibit protein translation. However, a variety of mechanisms of rapamycin resistance have been identified in various cell lines.16,17 They include mutations in mTOR itself, or in FKBP12, which directly blocks the biological activity of rapamycin. Mutations or altered expression of the downstream effectors of mTOR, including ribosomal protein S6 kinase (S6K), the regulator of eukaryotic initiation factor 4E (eIF4E) termed eIF4E binding protein 1 (4E-BP1), and the cyclin-dependent kinase inhibitor (CKI) p27kip1, can also lead to rapamycin resistance. A failure of rapamycin to inhibit c-myc translation or overexpression is also associated with intrinsic and acquired rapamycin resistance.16,24 An important observation made more recently is that rapamycin may have differential effects on the phosphorylation of two well established mTOR substrates, S6K and 4E-BP1.18 The molecular basis for this observation remains unknown, but it provides a compelling rationale for the search for more effective mTOR kinase inhibitors. Indeed, such inhibitors have been described as producing a more general and potent effect on both the mTORC1 and mTORC2 arms of the mTOR signaling pathway.7
Is Rapamycin Resistance a Pathological State?
Several years ago, we initiated studies on the role of mTOR signaling in late gestation liver development in rats.25 The underlying goal of these studies was to elucidate the mechanisms by which an altered nutrient environment attenuated fetal liver growth and fetal hepatocyte proliferation. To study the role of mTOR, late gestation fetal rats [embryonic day (ED) 19; term being ED21] were administered rapamycin by intraperitoneal injection in situ.25 The comparison condition was liver regeneration following partial hepatectomy in the rat. It had been shown previously in reference 26, that S6K was activated following partial hepatectomy, an indicator of mTOR activation during liver regeneration. Subsequent studies had shown that rapamycin could indeed inhibit liver regeneration.27 It was later shown that the inhibitory effect of rapamycin was confined to the phase of the process during which hepatocyte proliferation is most active.28
While we were able to confirm that a single dose of rapamycin prior to partial hepatectomy markedly inhibited hepatocyte DNA synthesis at 24 h,25 we were surprised to observe that rapamycin did not inhibit fetal hepatocyte proliferation (Fig. 1). Phospho-specific western immunoblotting showing a marked inhibition of ribosomal protein S6 phosphorylation in rapamycin-administered fetuses (Fig. 1) indicated that rapamycin administered by this route was bioavailable and active. This result was further supported by the demonstration that hepatic S6K activity was inhibited in rapamycin administered fetuses. These results were interpreted as indicating that fetal hepatocyte proliferation in vivo is resistant to the anti-proliferative effect of rapamycin, but that the locus for this resistance is downstream from mTOR and S6K.
Figure 1.

The effect of rapamycin on hepatocyte proliferation and mTOR signaling in late gestation fetal and regenerating adult liver. Fetal rats were administered rapamycin (5 µg per fetus) or DMSO vehicle (control) in situ by intraperitoneal injection. The fetuses were replaced, the laparotomy incision was closed and gestation was allowed to continue for an additional 24 h. Adult rats underwent partial hepatectomy following intraperitoneal administration of rapamycin (2.5 mg per kg body weight) or DMSO vehicle. Animals were sacrificed 24 h later. In both cases, BrdU (50 mg per kg body weight) was administered at the time of rapamycin or DMSO administration. (A) The photomicrographs show BrdU immunohistochemical staining of liver sections from representative fetal or adult animals (from ref. 25; Boylan et al. J Biol Chem 2001; 276:44457). (B) Livers were analyzed by immunoblotting for phosphorylated (P-S6235/236) and total ribosomal protein S6.
In order to assess the specificity of this finding for liver, rapamycin was administered along with BrdU to ED19 fetal rats. Whole mount fetuses were examined for BrdU incorporation into DNA. S6 phosphorylation was assessed by immunohistochemical staining and by phospho-specific immunoblotting.29 A spectrum of tissues including kidney, stomach, intestine, heart and metatarsals showed no effect of rapamycin on DNA synthesis despite effective inhibition of the mTORC1 signaling pathway (Fig. 2). Fetal weight, an indicator of fetal size, was also unaffected. Similar to the late gestation fetus, rapamycin administration to 10-day-old postnatal rats did not affect cell proliferation, size or tissue morphology in liver, kidney or intestine despite marked inhibition of S6 phosphorylation. These studies were interpreted as suggesting that basal cellular proliferation and normal tissue remodeling are “rapamycin-resistant” and are independent of mTORC1 signaling.
Figure 2.
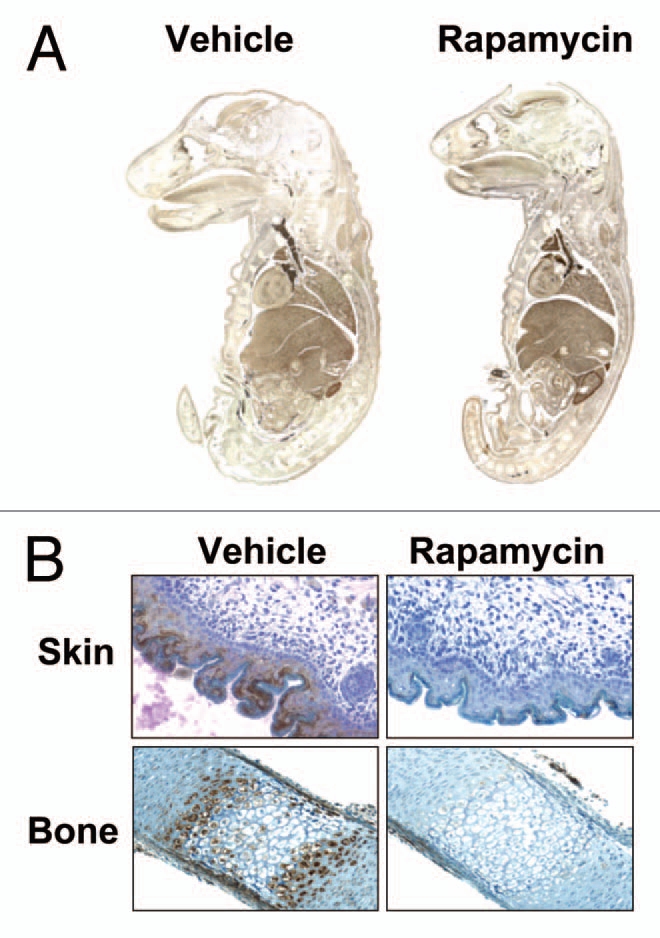
Effect of rapamycin on DNA synthesis in E19 fetal rats. E19 fetuses were injected in situ with DMSO vehicle or rapamycin plus BrdU. The fetuses were replaced and gestation was allowed to continue for 24 h. (A) Fetal whole mounts were fixed in formalin, paraffin-embedded and stained for BrdU. (B) Formalin-fixed, paraffin embedded tissues were stained for P-S6235/236 and counterstained with hematoxylin (from ref. 29; Sanders et al. Am J Physiol Cell Physiol 2008; 295:406).
We also examined the effect of rapamycin in a non-proliferative model of liver growth, refeeding after a period of starvation in the rat.30 In this model, 48 h of food deprivation results in a decrease in total liver protein of approximately 40% that is largely recovered within 24 h of refeeding. We found that administration of rapamycin prior to refeeding delays recovery of liver protein content. However, our data indicated that rapamycin did not inhibit cap-binding complex formation under these circumstances. This finding was consistent with the prior observation that rapamycin could inhibit S6K signaling during liver regeneration, but that there was no inhibitory effect on 4E-BP1 phosphorylation.31
Given the absence of an effect of rapamycin on fetal hepatocyte proliferation, we hypothesized that global protein synthesis in the late gestation fetal liver would similarly be resistant to the drug. This hypothesis was tested using the model of direct administration of rapamycin to late gestation (ED19) fetal rats in situ.32 We first examined the ability of rapamycin to inhibit the translation of mRNAs encoding ribosomal proteins; that is, those mRNAs containing 5′-terminal oligopyrimidine (5′TOP) tracts. As expected, the activation of hepatic translation of 5′TOP mRNAs that occurred during refeeding after food deprivation was sensitive to rapamycin. However, fetal liver 5′TOP translation was unaffected by rapamycin. In addition, rapamycin administration before refeeding in adult rats inhibited formation of the preinitiation complex. This was not the case when rapamycin was administered to fetal rats in situ.
These observations led us to reevaluate the prevailing concept of rapamycin resistance, which considers it a pathological condition that contributes to the pathogenesis of cancer through dysregulation of mTOR signaling. Our observations in the case of the late gestation fetal rat and early postnatal rat indicated that normal cell proliferation in the context of somatic growth or ongoing, normal tissue remodeling is resistant to the anti-proliferative actions of rapamycin. The synchronous, extracellular signal-directed proliferation associated with liver regeneration, on the other hand, was susceptible to rapamycin's anti-proliferative effects. Furthermore, it appeared that at least two pathways downstream from mTOR, protein translation and G1-to-S phase progression, were coordinately regulated during liver development. Based on these observations, we asked if the mechanism of rapamycin resistance in late gestation fetal rat hepatocytes might be recapitulated in the pathogenesis of liver cancer.
A Comparative Analysis of Rapamycin Effect on Rat Liver Cell Lines and Developing Liver
In order to extend our in vivo observations on liver development, we characterized a panel of rat hepatic cell lines representing a spectrum of cell transformation and tumorigenicity.33 We studied two non-tumorigenic hepatic cell lines, H4IIE and WB-F344. The former, derived in 1964 from a rat Reuber hepatoma,34 has characteristics consistent with a well differentiated hepatocyte phenotype. WB-F344 cells represent a diploid liver epithelial cell line that phenotypically resembles hepatic “oval cells,”35 which are bipotential (hepatocyte and biliary epithelial) cells that are thought to represent facultative hepatic stem cells. The WB311 is a transformed cell line derived spontaneously from the WB-F344 line by repeated passage.36 A number of the remaining cell lines were derived from the WB-F344 cells using in vitro exposure to chemical carcinogens, resulting in tumorigenic cells,36 while others were derived from transplantable rat hepatocellular carcinomas.37,38
We first determined the dose response for rapamycin inhibition of DNA synthesis using 3H-thymidine incorporation. The results showed marked variability in rapamycin responsiveness across the panel of cells. This was reflected in IC50 values ranging from 2 to >200 nM, and maximal DNA synthesis achieved at the highest rapamycin concentration ranging from 25 to 70% of control. The sensitivity of the cells to rapamycin did not correspond to individual cell lines' degree of transformation, nor was there a correlation with the ability of the drug to inhibit protein synthesis, as determined by radio-labeled leucine incorporation into protein.33 Of note, the WB-F344 cell line, while highly sensitive to the anti-proliferative effect of rapamycin, showed no effect of rapamycin on 3H-leucine incorporation.
The H4IIE and WB-F344 cells were highly sensitive to rapamycin. The WB311 cell line was highly resistant. Two additional lines, GN5 and H5D showed intermediate sensitivity. As was the case for fetal and adult liver, rapamycin potently inhibited S6 phosphorylation at 50 nM in all cell lines (Fig. 3A), placing the locus for resistance downstream from mTOR signaling.
Figure 3.

Rapamycin effect on mTOR signaling and cell cycle control in hepatic cell lines. (A) Duplicate samples from five cell lines exposed to rapamycin (50 nM for 24 h) or control vehicle (DMSO) were analyzed by immunoblotting for phosphorylated (P-S6235/236) and total ribosomal protein S6. (B) Similar samples, prepared from H4IIE cells, were analyzed for cyclin E-dependent kinase activity and composition of cyclin E-containing complexes using immunoprecipitation and immunoblotting. Similar studies carried out on four additional cell lines were analyzed for cyclin E-dependent kinase activity (C) and cyclin E-associated p27Kip1 (D). Filled bars represent control vehicle and unfilled bars rapamycin treated cells. Graphs show triplicate analyses as the mean plus 1SD. *p < 0.05 versus corresponding control (from ref. 33; Jimenez et al. PLoS ONE 4:7373, 2009).
We hypothesized that a unifying mechanism involving the modulation of cyclin-dependent kinase activity would account for the differential sensitivity to the anti-proliferative effects of rapamycin among cell lines and during liver development. Initial studies using H4IIE cells (Fig. 3B) showed a marked inhibition of cyclin E1-dependent kinase activity upon exposure to 20 nM rapamycin. This effect was independent of changes in cyclin E1 content, CDK2 content or abundance of cyclin E1/CDK2 complexes. We investigated a number of mechanisms to account for rapamycin-induced inhibition of CDK2. An examination of the cyclin E1/CDK2 complexes for p27Kip1 content showed a rapamycin-induced increase that was disproportionate to a modest rapamycin-induced increase in total cellular p27Kip1 content.
Studies on the four additional cell lines showed a relationship between cyclin E-dependent kinase activity and rapamycin effect (Fig. 3C). Again, these changes in kinase activity were independent of changes in cyclin E1 content, CDK2 content or abundance of cyclin E1/CDK2 complexes. Examination of p27Kip1 incorporation into cyclin E1-containing complexes (Fig. 3D) showed a near absence of p27Kip1 in the WB311 cells. However, even in these cells, which showed a lack of p27Kip1 in the total cellular homogenates, there was a slight inhibitory effect of rapamycin on cyclin E1-associated CDK2 activity. Perhaps most interesting was the finding that rapamycin inhibited cyclin E1-associated CDK2 activity in H5D cells without a change in cyclin E1-associated p27Kip1.
Similar analyses using homogenates prepared from regenerating adult liver and ED19 fetal liver showed that rapamycin inhibited cyclin E1-dependent kinase activity in the former but not in the latter (Fig. 4A). This effect was independent of changes in cyclin E1 content, CDK2 content, the abundance of cyclin E1:CDK2 complexes or the level of cyclin E1-associated p27Kip1 (Fig. 4B). Similar results were obtained for cyclin E2. We observed no effect of rapamycin on cyclin D-containing complexes or on p21Cip1/Waf1.
Figure 4.

Effect of rapamycin on cyclin E-dependent kinase activity and composition of cyclin E-containing complexes in fetal and adult liver. Animal studies were carried out as for Figure 1. (A) Triplicate liver samples were analyzed for cyclin E-dependent kinase activity. Filled bars represent DMSO vehicle-injected animals and unfilled bars represent rapamycin-injected animals. Graphs show triplicate analyses as the mean plus 1SD. *p < 0.05 versus corresponding control. (B) Duplicate samples were analyzed for composition of cyclin E-containing complexes.
Our results comparing rapamycin effect on G1 progression in fetal versus adult regenerating liver were unexpected given the related observations that have been generated using other systems. With regard to the biological activity of rapamycin, p27Kip1 is of particular importance. This CKI has been shown to be present at high levels in quiescent cells and to be downregulated by stimulation with mitogens.39,40 Prevention of the mitogen-stimulated downregulation of p27Kip1 by rapamycin, first described in T cells, suggested that p27Kip1 is involved in the anti-proliferative activity of the drug.41 Luo et al. established a rapamycin-resistant murine BC3H1 cell line by culturing cells in the presence of the drug. They found that these cells showed constitutively low levels of p27Kip1, even after mitogen deprivation, and that rapamycin could no longer increase p27Kip1 levels in these cells.
Since these initial findings, considerable attention has been given to the regulation of p27Kip1 levels by mTOR through translational control and modulation of protein stability.43,44 Recently, it was shown that mouse embryonic fibroblasts deficient in the transcription factor Oct1 were insensitive to mTOR inhibition by rapamycin.45 Oct1 was found to control transcription of p27Kip1 in wild-type cells downstream of the mTOR pathway such that Oct1 negative cells failed to upregulate p27Kip1 in response to rapamycin.
It has also been shown that the protein kinase SGK1 is activated by mTORC1, that SGK1 phosphorylates p27Kip1 on Thr157, and that this results in the sequestering of p27Kip1 in the cytoplasm, away from cyclin E-containing complexes. This, in turn, favors cyclin E-dependent kinase activation and S-phase progression.46 However, the relevance of this pathway to rapamycin activity is uncertain. Others have found that SGK1 may be rapamycin-insensitive and downstream from mTORC2.47
In addition to its effects on p27Kip1, rapamycin has been shown to regulate other cell cycle constituents, in particular the cyclins. Downregulation of cyclin D1,48,49 cyclin D3,49,50 cyclin E,51 and cyclin A52 has been shown in a spectrum of cell types. These effects have, for the most part, involved inhibition of the translation of these cell cycle components. However, cyclin D1 has been shown to be regulated by mTOR via effects on protein stability,48 an effect that was purported to account for the ability of rapamycin to inhibit the G1 to S transition.
mTORC1-Mediated Regulation of Gene Expression
Taking advantage of our having characterized the panel of hepatic cell lines for rapamycin sensitivity, we examined the effect of rapamycin on gene expression.53 Our initial studies focused on the WB-F344 and WB311 cell lines. One goal of these studies was to identify rapamycin-induced and rapamycin-suppressed genes that could account for the drug's anti-proliferative effects. In addition, we reasoned that the extreme resistance of the WB311 cells to the anti-proliferative effects of rapamycin would allow us to identify rapamycin-induced changes in gene expression that were independent of growth arrest.
mTORC1 has been shown to regulate gene expression by both direct binding to gene promoters and though posttranslational modification of transcription factors. mTOR activity has been shown to be required for the efficient and sustained transcription of ribosomal genes.54 Recent studies in human and murine cells have shown that mTOR is associated with the promoter regions of both RNA polymerase I and RNA polymerase III transcribed genes. mTOR binding to the promoter regions of 45s rDNA, 5s rDNA and tRNA genes was found to be regulated by nutrients and growth factors and inhibited by rapamycin.55 The mechanism by which mTOR regulates the transcription of Pol I and Pol III genes is unknown. One proposed mechanism is through the regulation of various members of the rDNA transcription machinery. A study by Hannan et al. showed that phosphorylation of the transcription factor UBF by mTOR was necessary for the sustained activation of rDNA transcription. Phosphorylation of UBF led to its interaction with the rDNA transcription factor SL-1 and the transactivation of rDNA transcription.
mTOR has also been shown to have a role in the transcriptional control of genes involved in mitochondrial oxidative function. In skeletal muscle, rapamycin treatment resulted in the downregulation of various mitochondrial transcriptional regulators, including PGC-1α.56 Genomic analysis revealed that mTOR and PGC-1α regulate mitochondrial genes through the transcription factor YY-1. Furthermore, mTOR was found to interact with PGC-1α and YY-1 at the promoters of the genes encoding cytochrome C and PGC-1α. The interaction of YY-1 with PGC-1α was disrupted by rapamycin treatment resulting in a loss of YY-1 coactivation.
Our microarray analyses were performed in the context of what we considered limited data on mTOR control of gene expression in the broader sense. We hoped to identify mechanisms by which mTORC1 controlled gene expression through the regulation of previously unidentified transcriptional regulatory domains. We also hoped to identify genes whose expression distinguished between rapamycin sensitive and resistant cells.
With regard to the latter goal, we did not identify candidate genes that could be confirmed as having a role in determining rapamycin sensitivity. However, we did identify 106 genes whose expression was regulated by rapamycin in both the WB-F344 and WB311 cell lines. The promoter regions of these genes were examined for common regulatory motifs. Unexpectedly, the only transcriptional regulatory domains that were significantly overrepresented in this population of genes were those containing E-boxes. Based on the known function of this regulatory motif, we hypothesized that c-Myc was involved in mTOR mediated gene regulation. We compared the rapamycin-regulated genes identified in hepatic cells to Myc-regulated genes that were identified in fibroblasts engineered to express an inducible form of c-myc. Results revealed an enrichment of c-Myc targets among rapamycin sensitive genes in both hepatic cell lines. However, microarray analyses on wild-type and c-myc null fibroblasts showed similar enrichment of c-Myc targets among rapamycin sensitive genes, leading to the conclusion that the regulation of gene expression by mTOR occurs independently of c-myc. The overlap in rapamycin sensitive genes and c-Myc targets likely reflects the overlap in the regulation of biological processes, such as, cellular metabolism, proliferation and growth by c-Myc and mTOR.
In an extension of the above studies, we most recently performed a microarray analysis using RNA prepared from fetal liver tissue. Fetuses were administered rapamycin or DMSO (vehicle control) in situ on ED19 (three fetuses per group). The fetuses and mother were allowed to recover for 24 h, at which time a cesarean section was performed. Rapamycin effect was confirmed by immunoblotting for phospho-S6. Based on our prior studies,25 we knew that effects on gene expression would be independent of fetal hepatocyte growth arrest.
Analysis of the microarray results (Fig. 5) showed that the triplicate control and rapamycin samples clustered separately, indicating that rapamycin did indeed have an effect on gene expression. Of the 3,400 genes whose expression was affected significantly by rapamycin (p < 0.05; Sup. Table 1), the expression of 126 identifiable genes was found to be altered at least 1.5-fold (Sup. Table and Fig. 5). Roughly equivalent numbers of genes were upregulated and downregulated in response to rapamycin (60 downregulated, 66 upregulated), a finding that recapitulated our earlier results in hepatic cell lines.33,53
Figure 5.

Effect of rapamycin on gene expression in late gestation fetal rat liver. Fetuses were administered rapamycin or DMSO vehicle in situ as described for Figure 1. Total RNA was prepared from triplicate control and experimental fetuses and analyzed by microarray (Affymetrix® Rat Gene 1.0 ST Array). To the left is shown a heat map and hierarchical clustering for all genes (red, high expression; green, low expression). From this dataset, a subset of genes was identified as showing a significant (p < 0.05) change in expression of at least 1.5-fold in response to rapamycin (red, high expression; blue, low expression). These genes were analyzed by GSEA for biological processes (top) and canonical pathways (bottom). The pie charts show the distribution of genes among categories for which the level of significance was p < 0.005 (40 genes for biological processes and 36 for canonical pathways).
In order to characterize the effects of rapamycin on gene expression in fetal liver, results were analyzed using two separate instruments, Gene Set Enrichment Analysis (GSEA),57,58 and Ingenuity Pathways Analysis (IPA; Ingenuity® Systems, www.ingenuity.com). Results using GSEA did not disclose a significant overrepresentation of any transcription factor binding domains. As we had concluded from our hepatic cell lines studies, this result was interpreted as indicating that mTORC1-mediated changes in gene expression could not be accounted for by the regulation of function of a particular individual transcription factor or set of transcription factors.
Analysis for biological processes and pathways conducted in GSEA suggested a role for mTORC1 in regulating fetal hepatic metabolic pathways (Fig. 5). These associations were not observed in five control analyses of randomly selected rat gene sets of similar size. IPA revealed a similar pattern in that the highest scoring network function was “drug metabolism, small molecule biochemistry, lipid metabolism.” The four most highly significant canonical pathways identified by IPA that were associated with rapamycin administration were metabolism of xenobiotics by cytochrome P450, fatty acid metabolism, tryptophan metabolism and propanoate metabolism.
Summary and Conclusions
There is a vast literature on the sensitivity of cell lines to the mTOR inhibitor, rapamycin. This literature has focused largely on the use of rapamycin as a cancer chemotherapeutic agent and, therefore, on the resistance of cancer cells to the anti-proliferative effect of the drug. As a result of this focus, rapamycin resistance has widely been considered pathological. Our focus on nutrient regulation led us to an alternative conclusion, that the normal cell proliferation associated with growth and tissue remodeling in the late gestation and early postnatal rat reflects the ability of many normal cells in a developing mammal to proliferate under circumstances where mTORC1 is potently inhibited.
The characteristics that correspond to the resistance of late gestation fetal hepatocytes to rapamycin's cell cycle inhibitory effect are likely to involve insensitivity to the effect of the drug on global protein synthesis, ribosome biogenesis and G1 cell cycle progression. The insensitivity of these cellular processes could be accounted for by mechanisms involved in cap-dependent translation, translation of 5′TOP mRNAs and regulation of cyclin E-dependent kinase activity. Whether or not the three are linked in any way is likely an important area for further investigation. If cells growing under normal conditions are not rapamycin sensitive, they are presumably growing in a manner that is mTORC1 independent. However, our results on liver regeneration and the liver growth associated with refeeding of the fasted rat indicate that mTORC1 is required for synchronous, growth factor-mediated growth and nutritionally regulated growth. This conclusion is consistent with the resistance of cancer cells to rapamycin and the association of the transformed phenotype with mitogen-independence and resistance to nutrient restriction.
We interpreted our studies on the anti-proliferative effects of rapamycin in liver development as indicating a key role for regulation of cyclin E-dependent kinase activity. This mode of cell cycle regulation did not appear to involve the previously described mechanisms involving changes in p27Kip1 content or cyclin E expression. In our studies on hepatic cell lines, cyclin E-containing complexes appeared to be an important locus for rapamycin resistance, one that was independent of translation control or CKI induction. We concluded that rapamycin-induced changes in the composition or post-translational modification of cyclin E and associated components could account for variations in the sensitivity of hepatic cells to rapamycin's anti-proliferative effects.
Our observations on the gene expression effects of rapamycin in the physiological system of late gestation liver development points to a potential link between the nutrient-sensing capacity of the mTORC1 complex and the regulation of cell metabolism. However, a systematic search for transcription factor binding domains that could account for this link, not only in developing liver but also in hepatic cell lines, did not suggest mechanisms involving the modulation of function of any specific factors. This suggests the importance of other mechanisms, such as those involving post-translational modification of histones, small interfering RNAs and DNA methylation.
Finally, our results have implications for ongoing attempts to identify new mTOR inhibitors, some of which have already been advanced as potential new anti-cancer agents.59 For these new therapies to fulfill their promise, we will need to better define the physiology and pathophysiology of mTOR signaling and the differential effects of mTOR inhibition on the pathway's various and diverse biological effects.
Acknowledgements
We thank the members of our laboratory who contributed to this work, including Anand Padmanabhan and Rosa Jimenez. These studies were supported by NIH Grants R01 HD24455 and R01 HD35831 (to P.A.G.), and P20 RR017695 (to J.A.S.).
Abbreviations
- mTOR
mammalian target of rapamycin
- FKBP12
FK506 binding protein 12
- mTORC1 and mTORC2
mTOR complex 1 and 2
- HCC
hepatocellular carcinoma
- S6K
ribosomal protein S6 kinase
- eIF4E
eukaryotic initiation factor 4E
- 4E-BP1
eIF4E binding protein 1
- CKI
cyclin-dependent kinase inhibitor
- ED
embryonic day
- 5′TOP
5′-terminal oligopyrimidine tract
- GSEA
gene set enrichment analysis
- IPA
ingenuity pathways analysis
Supplementary Material
References
- 1.Vezina C, Kudelski A, Sehgal SN. Rapamycin (AY-22,989), a new antifungal antibiotic. I. Taxonomy of the producing streptomycete and isolation of the active principle. J Antibiot (Tokyo) 1975;28:721–726. doi: 10.7164/antibiotics.28.721. [DOI] [PubMed] [Google Scholar]
- 2.Eng CP, Sehgal SN, Vezina C. Activity of rapamycin (AY-22,989) against transplanted tumors. J Antibiot (Tokyo) 1984;37:1231–1237. doi: 10.7164/antibiotics.37.1231. [DOI] [PubMed] [Google Scholar]
- 3.Siekierka JJ, Hung SH, Poe M, Lin CS, Sigal NH. A cytosolic binding protein for the immunosuppressant FK506 has peptidyl-prolyl isomerase activity but is distinct from cyclophilin. Nature. 1989;341:755–757. doi: 10.1038/341755a0. [DOI] [PubMed] [Google Scholar]
- 4.Heitman J, Movva NR, Hall MN. Targets for cell cycle arrest by the immunosuppressant rapamycin in yeast. Science. 1991;253:905–909. doi: 10.1126/science.1715094. [DOI] [PubMed] [Google Scholar]
- 5.Sabitini DM, Erdjument-Bromage H, Liu M, Tempst P, Snyder SH. RAFT1: A mammalian protein that binds to FKBP12 in a rapamycin-dependent fashion and is homologous to yeast TORs. Cell. 1994;78:35–43. doi: 10.1016/0092-8674(94)90570-3. [DOI] [PubMed] [Google Scholar]
- 6.Abraham RT. Identification of TOR signaling complexes: More TORC for the cell growth engine. Cell. 2002;111:9–12. doi: 10.1016/s0092-8674(02)01009-7. [DOI] [PubMed] [Google Scholar]
- 7.Guertin DA, Sabatini DM. The pharmacology of mTOR inhibition. Sci Signal. 2009;2:24. doi: 10.1126/scisignal.267pe24. [DOI] [PubMed] [Google Scholar]
- 8.Gingras AC, Raught B, Sonenberg N. Regulation of translation initiation by FRAP/mTOR. Genes Dev. 2001;15:807–826. doi: 10.1101/gad.887201. [DOI] [PubMed] [Google Scholar]
- 9.Wiederrecht GJ, Sabers CJ, Brunn GJ, Martin MM, Dumont FJ, Abraham RT. Mechanism of action of rapamycin: new insights into the regulation of G1-phase progression in eukaryotic cells. Prog Cell Cycle Res. 1995;1:53–71. doi: 10.1007/978-1-4615-1809-9_5. [DOI] [PubMed] [Google Scholar]
- 10.Jung CH, Ro SH, Cao J, Otto NM, Kim DH. mTOR regulation of autophagy. FEBS Lett. 2010;584:1287–1295. doi: 10.1016/j.febslet.2010.01.017. [DOI] [PMC free article] [PubMed] [Google Scholar]
- 11.Castedo M, Ferri KF, Kroemer G. Mammalian target of rapamycin (mTOR): pro- and anti-apoptotic. Cell Death Differ. 2002;9:99–100. doi: 10.1038/sj.cdd.4400978. [DOI] [PubMed] [Google Scholar]
- 12.Polak P, Hall MN. mTOR and the control of whole body metabolism. Curr Opin Cell Biol. 2009;21:209–218. doi: 10.1016/j.ceb.2009.01.024. [DOI] [PubMed] [Google Scholar]
- 13.Huang S, Houghton PJ. Targeting mTOR signaling for cancer therapy. Curr Opin Pharmacol. 2003;3:371–377. doi: 10.1016/s1471-4892(03)00071-7. [DOI] [PubMed] [Google Scholar]
- 14.Hidalgo M, Rowinsky EK. The rapamycin-sensitive signal transduction pathway as a target for cancer therapy. Oncogene. 2000;19:6680–6686. doi: 10.1038/sj.onc.1204091. [DOI] [PubMed] [Google Scholar]
- 15.Sabatini DM. mTOR and cancer: insights into a complex relationship. Nat Rev Cancer. 2006;6:729–734. doi: 10.1038/nrc1974. [DOI] [PubMed] [Google Scholar]
- 16.Hosoi H, Dilling MB, Liu LN, Danks JK, Shikata T, Sekulic A, et al. Studies on the mechanism of resistance to rapamycin in human cancer cells. Mol Pharmacol. 1998;54:815–824. doi: 10.1124/mol.54.5.815. [DOI] [PubMed] [Google Scholar]
- 17.Huang S, Bjornsti MA, Houghton PJ. Rapamycins: mechanism of action and cellular resistance. Cancer Biol Ther. 2003;2:222–232. doi: 10.4161/cbt.2.3.360. [DOI] [PubMed] [Google Scholar]
- 18.Choo AY, Blenis J. Not all substrates are treated equally: implications for mTOR, rapamycin-resistance and cancer therapy. Cell Cycle. 2009;8:567–572. doi: 10.4161/cc.8.4.7659. [DOI] [PubMed] [Google Scholar]
- 19.Perl AE, Kasner MT, Tsai DE, Vogl DT, Loren AW, Schuster SJ, et al. A phase I study of the mammalian target of rapamycin inhibitor sirolimus and MEC chemotherapy in relapsed and refractory acute myelogenous leukemia. Clin Cancer Res. 2009;15:6732–6739. doi: 10.1158/1078-0432.CCR-09-0842. [DOI] [PubMed] [Google Scholar]
- 20.Rini BI. New strategies in kidney cancer: therapeutic advances through understanding the molecular basis of response and resistance. Clin Cancer Res. 2010;16:1348–1354. doi: 10.1158/1078-0432.CCR-09-2273. [DOI] [PubMed] [Google Scholar]
- 21.Wolpin BM, Hezel AF, Abrams T, Blaszkowsky LS, Meyerhardt JA, Chan JA, et al. Oral mTOR inhibitor everolimus in patients with gemcitabine-refractory metastatic pancreatic cancer. J Clin Oncol. 2009;27:193–198. doi: 10.1200/JCO.2008.18.9514. [DOI] [PMC free article] [PubMed] [Google Scholar]
- 22.Subbiah V, Trent JC, Kurzrock R. Resistance to mammalian target of rapamycin inhibitor therapy in perivascular epithelioid cell tumors. J Clin Oncol. 2010;28:415. doi: 10.1200/JCO.2010.29.4678. [DOI] [PubMed] [Google Scholar]
- 23.Treiber G. mTOR inhibitors for hepatocellular cancer: a forward-moving target. Expert Rev Anticancer Ther. 2009;9:247–261. doi: 10.1586/14737140.9.2.247. [DOI] [PubMed] [Google Scholar]
- 24.Shi Y, Sharma A, Wu H, Lichtenstein A, Gera J. Cyclin D1 and c-myc internal ribosome entry site (IRES)-dependent translation is regulated by AKT activity and enhanced by rapamycin through a p38 MAPK- and Erk-dependent parthway. J Biol Chem. 2005;280:10964–10973. doi: 10.1074/jbc.M407874200. [DOI] [PubMed] [Google Scholar]
- 25.Boylan JM, Anand P, Gruppuso PA. Ribosomal protein S6 phosphorylation and function during late gestation liver development in the rat. J Biol Chem. 2001;276:44457–44463. doi: 10.1074/jbc.M103457200. [DOI] [PubMed] [Google Scholar]
- 26.Nemenoff RA, Price DJ, Mendelsohn MJ, Carter EA, Avruch J. An S6 kinase activated during liver regeneration is related to the insulin-stimulated S6 kinase in H4 hepatoma cells. J Biol Chem. 1988;263:19455–19460. [PubMed] [Google Scholar]
- 27.Francavilla A, Starzl TE, Scotti C, Carrieri G, Azzarone A, Zeng QH, et al. Inhibition of liver, kidney and intestine regeneration by rapamycin. Transplantation. 1992;53:496–498. doi: 10.1097/00007890-199202010-00045. [DOI] [PMC free article] [PubMed] [Google Scholar]
- 28.Palmes D, Zibert A, Budny T, Bahde R, Minin E, Kebschull L, et al. Impact of rapamycin on liver regeneration. Virchows Arch. 2008;452:545–557. doi: 10.1007/s00428-008-0604-y. [DOI] [PubMed] [Google Scholar]
- 29.Sanders JA, Lakhani A, Phornphutkul C, Wu KY, Gruppuso PA. The effect of rapamycin on DNA synthesis in multiple tissues from late gestation fetal and postnatal rats. Am J Physiol Cell Physiol. 2008;295:406–413. doi: 10.1152/ajpcell.00450.2007. [DOI] [PMC free article] [PubMed] [Google Scholar]
- 30.Anand P, Gruppuso PA. Rapamycin inhibits liver growth during refeeding in rats via control of ribosomal protein translation but not cap-dependent translation initiation. J Nutr. 2006;136:27–33. doi: 10.1093/jn/136.1.27. [DOI] [PMC free article] [PubMed] [Google Scholar]
- 31.Jiang YP, Ballou LM, Lin RZ. Rapamycin-insensitive regulation of 4E-BP1 in regenerating rat liver. J Biol Chem. 2001;276:10943–10951. doi: 10.1074/jbc.M007758200. [DOI] [PubMed] [Google Scholar]
- 32.Gruppuso PA, Tsai SW, Boylan JM, Sanders JA. Hepatic translation control in the late-gestation fetal rat. Am J Physiol Regul Integr Comp Physiol. 2008;295:558–567. doi: 10.1152/ajpregu.00091.2008. [DOI] [PMC free article] [PubMed] [Google Scholar]
- 33.Jimenez RH, Boylan JM, Lee JS, Francesconi M, Castellani G, Sanders JA, et al. Rapamycin response in tumorigenic and non-tumorigenic hepatic cell lines. PLoS ONE. 2009;4:7373. doi: 10.1371/journal.pone.0007373. [DOI] [PMC free article] [PubMed] [Google Scholar]
- 34.Pitot HC, Peraino C, Morse P, Jr, Potter VR. Hepatomas in tissue culture compared with adapting liver in vivo. Natl Cancer Inst Monogr. 1964;13:229–245. [PubMed] [Google Scholar]
- 35.Tsao MS, Smith JD, Nelson KG, Grisham JW. A diploid epithelial cell line from normal adult rat liver with phenotypic properties of ‘oval’ cells. Exp Cell Res. 1984;154:38–52. doi: 10.1016/0014-4827(84)90666-9. [DOI] [PubMed] [Google Scholar]
- 36.Lee LW, Tsao MS, Grisham JW, Smith GJ. Emergence of neoplastic transformants spontaneously or after exposure to N-methyl-N'-nitro-N-nitrosoguanidine in populations of rat liver epithelial cells cultured under selective and nonselective conditions. Am J Pathol. 1989;135:63–71. [PMC free article] [PubMed] [Google Scholar]
- 37.Hixson DC, McEntire KD, Obrink B. Alterations in the expression of a hepatocyte cell adhesion molecule by transplantable rat hepatocellular carcinomas. Cancer Res. 1985;45:3742–3749. [PubMed] [Google Scholar]
- 38.Hixson DC, Brown J, McBride AC, Affigne S. Differentiation status of rat ductal cells and ethionine-induced hepatic carcinomas defined with surface-reactive monoclonal antibodies. Exp Mol Pathol. 2000;68:152–169. doi: 10.1006/exmp.2000.2302. [DOI] [PubMed] [Google Scholar]
- 39.Nourse J, Firpo E, Flanagan WM, Coats S, Polyak K, Lee MH, et al. Interleukin-2-mediated elimination of the p27Kip1 cyclin-dependent kinase inhibitor prevented by rapamycin. Nature. 1994;372:570–573. doi: 10.1038/372570a0. [DOI] [PubMed] [Google Scholar]
- 40.Agrawal D, Dong F, Wang YZ, Kayda D, Pledger WJ. Regulation of cyclin E and p27kip during mitosis in BALB/c 3T3 cells. Cell Growth Differ. 1995;6:1199–1205. [PubMed] [Google Scholar]
- 41.Barata JT, Cardoso AA, Nadler LM, Boussiotis A. Interleukin-7 promotes survival and cell cycle progression of T-cell acute lymphoblastic leukemia cells by downregulating the cyclin-dependent kinase inhibitor p27(kip1) Blood. 2001;98:1524–1531. doi: 10.1182/blood.v98.5.1524. [DOI] [PubMed] [Google Scholar]
- 42.Luo Y, Marx SO, Kiyokawa H, Koff A, Massague J, Marks AR. Rapamycin resistance tied to defective regulation of p27Kip1. Mol Cell Biol. 1996;16:6744–6751. doi: 10.1128/mcb.16.12.6744. [DOI] [PMC free article] [PubMed] [Google Scholar]
- 43.Shapira M, Kakiashvili E, Rosenberg T, Hershko DD. The mTOR inhibitor rapamycin downregulates the expression of the ubiquitin ligase subunit Skp2 in breast cancer cells. Breast Cancer Res. 2006;8:46. doi: 10.1186/bcr1533. [DOI] [PMC free article] [PubMed] [Google Scholar]
- 44.Rosner M, Freilinger A, Hengstschlager M. The tuberous sclerosis genes and regulation of the cyclin-dependent kinase inhibitor p27. Mutat Res. 2006;613:10–16. doi: 10.1016/j.mrrev.2006.03.001. [DOI] [PubMed] [Google Scholar]
- 45.Dalvai M, Schubart K, Besson A, Matthias P. Oct1 is required for mTOR-induced G1 cell cycle arrest via the control of p27(Kip1) expression. Cell Cycle. 2010;9:3933–3944. doi: 10.4161/cc.9.19.13154. [DOI] [PubMed] [Google Scholar]
- 46.Hong F, Larrea MD, Doughty C, Kwiatkowski DJ, Squillace R, Slingerland JM. mTOR-raptor binds and activates SGK1 to regulate p27 phosphorylation. Mol Cell. 2008;30:701–711. doi: 10.1016/j.molcel.2008.04.027. [DOI] [PubMed] [Google Scholar]
- 47.Garcia-Martinez JM, Alessi DR. mTOR complex 2 (mTORC2) controls hydrophobic motif phosphorylation and activation of serum- and glucocorticoidinduced protein kinase 1 (SGK1) Biochem J. 2008;416:375–385. doi: 10.1042/BJ20081668. [DOI] [PubMed] [Google Scholar]
- 48.Hashemolhosseini S, Nagamine Y, Morley SJ, Desrivieres S, Mercep L, Ferrari S. Rapamycin inhibition of the G1 to S transition is mediated by effects on cyclin D1 mRNA and protein stability. J Biol Chem. 1998;273:14424–14429. doi: 10.1074/jbc.273.23.14424. [DOI] [PubMed] [Google Scholar]
- 49.Averous J, Fonseca BD, Proud CG. Regulation of cyclin D1 expression by mTORC1 signaling requires eukaryotic initiation factor 4E-binding protein 1. Oncogene. 2008;27:1106–1113. doi: 10.1038/sj.onc.1210715. [DOI] [PubMed] [Google Scholar]
- 50.Pallet N, Thervet E, Le Corre D, Knebelmann B, Nusbaum P, Tomkiewicz C, et al. Rapamycin inhibits human renal epithelial cell proliferation: effect on cyclin D3 mRNA expression and stability. Kidney Int. 2005;67:2422–2433. doi: 10.1111/j.1523-1755.2005.00350.x. [DOI] [PubMed] [Google Scholar]
- 51.Hleb M, Murphy S, Wagner EF, Hanna NN, Sharma N, Park J, et al. Evidence for cyclin D3 as a novel target of rapamycin in human T lymphocytes. J Biol Chem. 2004;279:31948–31955. doi: 10.1074/jbc.M400638200. [DOI] [PubMed] [Google Scholar]
- 52.Decker T, Hipp S, Ringshausen I, Bogner C, Oelsner M, Schneller F, et al. Rapamycin-induced G1 arrest in cycling B-CLL cells is associated with reduced expression of cyclin D3, cyclin E, cyclin A and survivin. Blood. 2003;101:278–285. doi: 10.1182/blood-2002-01-0189. [DOI] [PubMed] [Google Scholar]
- 53.Jimenez RH, Lee JS, Francesconi M, Castellani G, Neretti N, Sanders JA, et al. Regulation of gene expression in hepatic cells by the mammalian Target of Rapamycin (mTOR) PLoS ONE. 2010;5:9084. doi: 10.1371/journal.pone.0009084. [DOI] [PMC free article] [PubMed] [Google Scholar]
- 54.Hannan KM, Brandenburger Y, Jenkins A, Sharkey K, Cavanaugh A, Rothblum L, et al. mTOR-dependent regulation of ribosomal gene transcription requires S6K1 and is mediated by phosphorylation of the carboxy-terminal activation domain of the nucleolar transcription factor UBF. Mol Cell Biol. 2003;23:8862–8877. doi: 10.1128/MCB.23.23.8862-8877.2003. [DOI] [PMC free article] [PubMed] [Google Scholar]
- 55.Tsang CK, Liu H, Zheng XF. mTOR binds to the promoters of RNA polymerase I- and III-transcribed genes. Cell Cycle. 2010;9:953–957. doi: 10.4161/cc.9.5.10876. [DOI] [PMC free article] [PubMed] [Google Scholar]
- 56.Cunningham JT, Rodgers JT, Arlow DH, Vazquez F, Mootha VK, Puigserver P. mTOR controls mitochondrial oxidative function through a YY1-PGC-1alpha transcriptional complex. Nature. 2007;450:736–740. doi: 10.1038/nature06322. [DOI] [PubMed] [Google Scholar]
- 57.Mootha VK, Lindgren CM, Eriksson KF, Subramanian A, Sihag S, Lehar J, et al. PGC-1alpha-responsive genes involved in oxidative phosphorylation are coordinately downregulated in human diabetes. Nat Genet. 2003;34:267–273. doi: 10.1038/ng1180. [DOI] [PubMed] [Google Scholar]
- 58.Subramanian A, Tamayo P, Mootha VK, Mukherjee S, Ebert BL, Gillette MA, et al. Gene set enrichment analysis: a knowledge-based approach for interpreting genome-wide expression profiles. Proc Natl Acad Sci USA. 2005;102:15545–15550. doi: 10.1073/pnas.0506580102. [DOI] [PMC free article] [PubMed] [Google Scholar]
- 59.Guertin DA, Sabatini DM. Defining the role of mTOR in cancer. Cancer Cell. 2007;12:9–22. doi: 10.1016/j.ccr.2007.05.008. [DOI] [PubMed] [Google Scholar]
Associated Data
This section collects any data citations, data availability statements, or supplementary materials included in this article.