

Abstract
Rhodopsin is a canonical member of the family of G protein-coupled receptors, which transmit signals across cellular membranes and are linked to many drug interventions in humans. Here we show that solid-state 2H NMR relaxation allows investigation of light-induced changes in local ps–ns time scale motions of retinal bound to rhodopsin. Site-specific 2H labels were introduced into methyl groups of the retinal ligand that are essential to the activation process. We conducted solid-state 2H NMR relaxation (spin-lattice, T1Z, and quadrupolar-order, T1Q) experiments in the dark, Meta I, and Meta II states of the photoreceptor. Surprisingly, we find the retinylidene methyl groups exhibit site-specific differences in dynamics that change upon light excitation—even more striking, the C9-methyl group is a dynamical hotspot that corresponds to a crucial functional hotspot of rhodopsin. Following 11-cis to trans isomerization, the 2H NMR data suggest the β-ionone ring remains in its hydrophobic binding pocket in all three states of the protein. We propose a multiscale activation mechanism with a complex energy landscape, whereby the photonic energy is directed against the E2 loop by the C13-methyl group, and toward helices H3 and H5 by the C5-methyl of the β-ionone ring. Changes in retinal structure and dynamics initiate activating fluctuations of transmembrane helices H5 and H6 in the Meta I–Meta II equilibrium of rhodopsin. Our proposals challenge the Standard Model whereby a single light-activated receptor conformation yields the visual response—rather an ensemble of substates is present, due to the entropy gain produced by photolysis of the inhibitory retinal lock.
Keywords: GPCR, solid-state NMR, generalized model-free analysis
G protein-coupled receptors (GPCRs) (1–3) are the largest family of integral membrane proteins in the human genome, and they are the targets of about 30% of all human pharmaceuticals. At present the 3D structures of several GPCRs—including rhodopsin (4–8), the β1- and β2-adrenergic receptors (9, 10), and the adenosine A2A receptor (11)—have been established in various functional states (2). Yet the mechanisms of GPCR activation remain elusive, as they are membrane-embedded molecules that are often recalcitrant to crystallization, and push the size limits of solution NMR spectroscopy. Rhodopsin is the quintessential prototype for Family A GPCRs, because previous X-ray (5, 6) and electron diffraction (12) studies have yielded crystal structures of its dark state (4–6) and several photointermediates (13, 14). Notably, the retinal ligand is buried deeply within a 7-transmembrane (TM) helical bundle, where it locks the receptor in the inactive state, with negligible basal (constitutive) activity (4). Upon light absorption, rhodopsin catalyzes the rapid and highly selective 11-cis to trans isomerization of retinal (15, 16) switching it from an inverse agonist to an agonist. In the Metarhodopsin I–Metarhodopsin II equilibrium, recognition sites are exposed for a heterotrimeric G protein (transducin or Gt), initiating the amplified visual response (17, 18). However, the light-activated Meta II state is transient and crystal deformation occurs giving low-resolution data (14). Crystal structures of ligand-free opsin (19) with a bound synthetic Gt peptide (20) show an elongation of the protein (21, 22) due to helical displacements (19)—but opsin does not contain the activating all-trans-retinal ligand, and its activity does not match rhodopsin (20).
Spectroscopic approaches including spin-label EPR (23), 13C NMR (18, 24–26), and Fourier transform infrared (FTIR) (17, 27) studies are thus needed to establish the activation mechanism of the photoreceptor as it underlies the visual process. Solid-state NMR spectroscopy (28) is particularly important, as it gives knowledge of both protein structure and dynamics in a membrane lipid environment (29). We show here that 2H NMR relaxation (30, 31) delivers crucial missing information that cannot be obtained by any other method. Crystallography presents us with only a static structure of the protein, while spin-label studies of rhodopsin address conformational changes of the protein and not the cofactor. From temperature-dependent relaxation times, we extracted the amplitudes, activation energies, and preexponential factors for ligand motions through key states of the activation pathway. Combining NMR data with the crystal structure, an activation mechanism is put forth whereby retinal triggers large-scale (millisecond) helical fluctuations of the receptor in a membrane lipid bilayer.
Results
We applied solid-state 2H NMR relaxation methods (30) to study retinal bound to rhodopsin in the inactive dark state, as well as the Meta I and Meta II states over a wide temperature range (≈150 K). Rhodopsin was regenerated with 11-cis-retinal 2H-labeled at the C5-, C9-, or C13-Me groups, and recombined with phospholipids followed by membrane alignment (32). Deletion of any of the methyl substituents transforms all-trans-retinal from a full agonist to a very weak partial agonist (1, 33, 34). The X-ray structure of rhodopsin in the dark state (5) is compared in Fig. 1A to ligand-free opsin (19), showing the activating movements of TM helices H5 and H6. However, the structure of rhodopsin in the active Meta II state has never been determined. In Fig. 1B we show the chemical structure of retinal with its numbering scheme. Examples of solid-state 2H NMR spectra are depicted in Fig. 1 C–E for rhodopsin in 1-palmitoyl-2-oleoyl-sn-glycero-3-phosphocholine (POPC) recombinant membranes. Residual quadrupolar couplings (RQCs) of 〈χQ〉 = 50.7–52.0 kHz are obtained from the motion-averaged 2H NMR line shapes, and evince rapid threefold spinning of the retinylidene methyl groups, with rotational correlation times < 10-5 s down to at least -160 °C (SI Text). From the RQCs, methyl order parameters of SC3 ≈ 0.9 are calculated directly, corresponding to off-axis fluctuations of ≈15°. The dynamics include methyl libration with respect to the unsaturated polyene, as well as reorientations of the polyene chain and β-ionone ring within the binding cavity.
Fig. 1.

Site-specific 2H NMR spectroscopy illuminates retinal mobility within the binding pocket of rhodopsin. (A) Structure of dark-state rhodopsin (1U19) (5) compared to opsin (1GZM) (19) showing helical movements due to release of inhibitory cofactor. (B) Chemical structure of 11-cis-retinal ligand where correspondence to crystallographic numbering scheme is C5-Me = C18, C9-Me = C19, and C13-Me = C20. (C–E) Solid-state 2H NMR spectra for rhodopsin in dark state with 11-cis-retinal 2H-labeled at C5-, C9-, or C13-methyl (Me) groups, respectively, in POPC membranes (1∶50 molar ratio). Experimental 2H NMR line shapes for random (powder-type) membrane dispersions were fit to theoretical Pake doublet (40), where 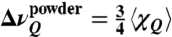 is the frequency separation between the two largest peaks. The residual quadrupolar couplings 〈χQ〉 directly yield order parameters for the rapidly spinning methyl groups (40).
Solid-State 2H NMR Spectroscopy Illuminates Retinal Mobility Within Binding Pocket of Rhodopsin.
To explore how the retinal dynamics change during visual function, we measured 2H NMR relaxation times (spin-lattice or Zeeman, T1Z, and quadrupolar-order, T1Q) (30) for rhodopsin in POPC or POPC/1,2-dioleoyl-sn-glycero-3-phosphoethanolamine (DOPE) (3∶1) membrane bilayers. Exponential relaxation was observed at all temperatures, with pronounced variations among the different methyl sites. All 2H NMR measurements were conducted below the melting temperature (TM) of the lipid bilayer, from -30 to -160 °C. Rotational diffusion and large-scale protein motions were thereby suppressed to reveal the internal (local) dynamics of the retinal cofactor. If only 2H NMR spectra were recorded (Fig. 1 C–E) we might conclude that few differences exist among the retinylidene methyl groups—yet site-specific variations in retinal mobility are clearly evident (29). Notably, the 2H NMR relaxation rates differ by up to an order of magnitude, due to the internal dynamics of the retinylidene ligand.
In Fig. 2A we summarize our experimental 2H NMR relaxation experiments for rhodopsin in the dark state. Arrhenius-type plots of both the T1Z times and T1Q times are shown vs. inverse temperature for methyl substituents of retinal crucial to its function (SI Text). Structural fluctuations of retinal in the dark state are unaffected by lipid phase transitions or freezing of water, and the relaxation data can be smoothly extrapolated to physiological temperature. For the C5-Me group, in Fig. 2A a clear minimum in T1Z is evident at -120 °C, and for T1Q at -135 °C. By contrast, the C9- and C13-Me groups have T1Z and T1Q minima at lower temperatures, outside the measured range. Note that the T1Z and T1Q minima occur at higher temperature (to the left) for slower motions, and conversely at lower temperature (to the right) for faster motions (29). At a given minimum, the effective correlation time τc is related to the Larmor (resonance) frequency ω0 by τc ≈ 1/ω0 = 2 ns. Smaller correlation times are obtained at higher temperatures (ps). The relatively short T1Z and T1Q relaxation times for the C5-Me group indicate a mainly 6-s-cis conformation of the β-ionone ring (32), rather than 6-s-trans. (For a 6-s-cis conformation the 1–7 interactions with hydrogen H8 would give slower spinning of the C5-Me vs. 1–6 interactions with hydrogen H7 for 6-s-trans; see below.) By contrast, the polyene C9- and C13-Me groups have longer T1Z times, showing greater mobility due to relatively weak noncovalent interactions within the retinal ligand, and with the surrounding amino acid residues.
Fig. 2.

Solid-state 2H NMR relaxation characterizes molecular dynamics of retinal ligand bound to rhodopsin. (A) Spin-lattice (T1Z) and quadrupolar-order (T1Q) relaxation times (filled and open symbols, respectively) are plotted against inverse temperature in dark state. Experimental data for retinal 2H-labeled at the C5-Me (filled diamond, empty diamond), C9-Me (filled circle, open circle), or C13-Me (filled square, open square) groups are indicated. The T1Z and T1Q times (solid and dashed lines, respectively) were simultaneously fit either with an axial threefold jump model (rate constant k) or rotational diffusion model (coefficients D|| and D⊥, where D⊥ = 0). (B) Theoretical analysis of rotational dynamics of retinylidene methyl groups within binding cavity of rhodopsin. Euler angles Ωij ≡ (αij,βij,γij) transform among coordinate systems {i,j} ≡ {P,I,M,D,L}. The principal axis system (PAS) of EFG tensor of 2H nucleus is denoted by P (z-axis parallel to C–2H bond); I is intermediate frame for methyl rotation (z-axis is  bond; not shown); M is methyl coordinate system (z-axis is average
  bond direction); D is membrane system (z-axis is surface normal n0), and L is the laboratory system (z-axis along external magnetic field B0) (31).
Generalized Model-Free Analysis Explains Retinal Structure and Dynamics.
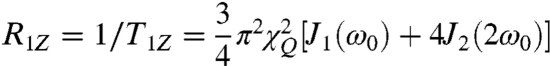
At this level our approach (30) is relatively model free, because we directly observe the RQCs and derived  order parameters, together with the corresponding R1Z relaxation rates. We next applied Redfield theory to treat the nuclear spin dynamics due to molecular motions (30). Experimental spin-lattice relaxation rates depend on thermal fluctuations of the C–2H bond orientation (electric field gradient, EFG tensor) near ω0, and are expressed by (30):
 |
[1] |
and
 |
[2] |
Here, T1Z is the relaxation time for Zeeman order and T1Q for quadrupolar order, χQ is the quadrupolar coupling constant, and ω0 is the nuclear resonance (Larmor) frequency. A simple physical picture is that matching of the power spectrum of the fluctuations to the Zeeman energy level gap drives transitions between the nuclear spin angular momentum states (30). Based on generalized model-free (GMF) analysis (30), the spectral densities Jm(ω) depend on the average methyl angle to the magnetic field, together with the mean-square amplitudes and rates of motions. The spectral densities are given by:
 |
[3] |
where ω = mω0 and m = 1, 2 (31). In the above formula D(2)(Ωij) indicates the second-rank Wigner rotation matrix, and Ωij ≡ (αij,βij,γij) are the Euler angles (30) for relative orientations of coordinate systems {i,j} ≡ {P,I,M,D,L} (see Fig. 2B). The mean-square amplitudes are the quantities in the angular brackets and indicate a time-ensemble average, while the reduced spectral densities are denoted by  , where τrq are the rotational correlation times.
Now for biomolecules such as membrane proteins (28) or lipids (31), with the GMF approach the mean-square amplitudes correspond to the segmental order parameters, and the rates to the correlation times of the motions (30). E.g., a methyl group has ΩPI = (0,70.5°,0) giving an effective coupling constant of  . The order parameter of the methyl threefold symmetry axis describes the off-axial fluctuations, as defined by
  , where βIM is the angle between the instantaneous methyl orientation and its average value (vide supra). Further theoretical analysis requires a motional model (30, 35) to interpret the fluctuations. For N-fold hops with a rate constant k about a single axis, the correlation times are (31, 35) 1/τrq → 1/τr = 4k sin2(πr/N) giving 1/τr = 3k for a methyl group. Alternatively, for continuous diffusion in a potential of mean torque (36), the rotational correlation times are:
 |
[4] |
The symbols D∥ and D⊥ indicate the axial and off-axial diffusion coefficients for methyl rotation, and the moments μqn and mean-square moduli  depend on both second- and fourth-rank order parameters (36). For a strong-collision approximation, the correlation times are just those of a rigid rotor (30): 1/τrq → 1/τr = 6D⊥ + (D∥ - D⊥)r2. Last, transition state theory tells us the correlation times are inversely related to A exp(-Ea/RT), where A is the preexponential factor (k0 or D0), and Ea is the activation energy (barrier) for methyl rotation. For a continuous rotational diffusion model D∥ = D0∥ exp(-Ea∥/RT) and D⊥ = D0⊥ exp(-Ea⊥/RT) and analogously for threefold jumps. More detailed description is given in refs. 31, 36.
Retinal Dynamics Indicate Loss of Molecular Strain upon Illumination.
Next we applied Eqs. (1–4) to numerically fit the T1Z and T1Q relaxation times for the retinylidene C5-, C9-, and C13-Me groups of rhodopsin (Fig. 2A). At temperatures well above the T1Z or T1Q minimum, the fast-motion limit applies (30). Correlation times in the range of 3–45 ps were obtained at -60 °C and 2–12 ps at 30 °C (SI Text), indicating rapidly spinning methyl groups (37). At lower temperatures, closer to the T1Z and T1Q minima, the correlation times are greater (vide supra). Light-induced changes in the T1Z relaxation times for the dark, Meta I, and Meta II states are summarized in Fig. 3 A–C. For the C5-Me group of the β-ionone ring (Fig. 3A), the T1Z minimum for the inactive dark state is at ≈-120 °C, as noted above. Upon light absorption, in the preactivated Meta I state a further T1Z minimum may be displaced to lower temperature (≈-160 °C), and in the active Meta II state a broad minimum occurs at ≈-140 °C (Fig. 3A). The short T1Z relaxation times for the C5-Me suggest the β-ionone ring maintains its predominantly twisted 6-s-cis conformation (32)—it is little affected by transitions among the dark, Meta I, and Meta II states.
Fig. 3.

Solid-state 2H NMR relaxation uncovers changes in ps–ns dynamics of retinal during light activation of rhodopsin. Relaxation times (T1Z) for (A) the C5-Me group, (B) the C9-Me group, and (C) the C13-Me group are plotted vs. inverse temperature in the dark state (——), the Meta I state (– – –), and the Meta II state (∙ ∙ ∙ ∙). Theoretical fits include both an axial threefold jump model (rate constant k) and a rotational diffusion model (axial coefficient D|| with D⊥ = 0). For the C5-Me group it is assumed D⊥ ≠ 0 in Meta I. Fitting parameters include order parameters for methyl threefold axis, activation energies, and preexponential factors (SI Text).
Perhaps most striking (Fig. 3B), for the polyene C9-Me group the T1Z times are longer, with the absence of a T1Z minimum down to at least -160 °C. In Meta I there is a clear reduction of the T1Z times at all temperatures, followed by an increase in the active Meta II state. Moreover, for the polyene C13-Me group (Fig. 3C) in the dark state the T1Z values fall between those for the C5-Me and the C9-Me groups, with a T1Z minimum below -160 °C. Despite that three methyl environments are found for the retinal ligand in the dark state, upon 11-cis to trans isomerization ≈ two methyl sites are evident. Such a loss of retinal strain is consistent with two major planes of unsaturation following light absorption (1, 34, 38–40). Application of transition state theory then allows us to connect the T1Z results with the energetic parameters for retinal bound to rhodopsin (Table 1). For all three states the Ea barrier for the C5-Me group is largest, while Ea for the C9-Me becomes greater than for the C13-Me in Meta II. It is likely that the β-ionone ring remains in its hydrophobic binding pocket up to the Meta II state.
Table 1.
Structural and dynamical parameters for methyl groups of retinal within rhodopsin binding pocket *
| Methyl group | Dark | Meta I | Meta II |
| C5-Me | |||
 † †
|
0.90 ± 0.05 | 0.90 ± 0.05 | 0.90 ± 0.05 |
| Ea/ kJ mol-1 | 11.4 ± 0.3 | 10.0 ± 0.3 ‡ 15.0 ± 0.4 ‡ | 10.3 ± 0.3 |
| k0(D0)/1011 s-1§ |  |
 ‡ ‡ ‡ ‡
|
 |
| C9-Me | |||
| SCD† | 0.90 ± 0.05 | 0.90 ± 0.05 | 0.90 ± 0.05 |
| Ea/ kJ mol-1 | 1.4 ± 0.1 | 3.7 ± 0.1 | 4.3 ± 0.1 |
| k0(D0)/1011 s-1§ |  |
 |
 |
| C13-Me | |||
| SCD† | 0.90 ± 0.5 | 0.90 ± 0.05 | 0.90 ± 0.05 |
| Ea/ kJ mol-1 | 7.3 ± 0.2 | 4.7 ± 0.2 | 2.8 ± 0.1 |
| k0(D0)/1011 s-1§ |  |
 |
 |
*Errors were calculated from curvature of χ2 hypersurface for individual fitting parameters.
†Order parameters were nearly independent of temperature from -30 to -150 °C.
‡Assumes two-conformer model (see text).
§Preexponential factors assume either a threefold hop model (k0) for methyl rotation or a rotational diffusion model (D0) (see text).
Discussion
Solid-state NMR spectroscopy (28) is a powerful adjunct to X-ray crystallography, as it gives knowledge of membrane proteins in a native-like environment where function is preserved (17, 21). In the case of rhodopsin, solid-state NMR clearly demonstrates mobility of the retinylidene ligand—despite its crucial biological role as an inverse agonist—even at cryogenic temperatures, as typically used in X-ray crystallography. Deleting any of the methyl groups transforms all-trans-retinal from a full agonist to a weak partial agonist (34, 41), due to back shifting of the metarhodopsin equilibrium (33, 34, 42). Hence, the retinylidene methyl substituents serve not only as 2H NMR probes of the ligand conformation and dynamics, but they also are directly implicated in the receptor activation mechanism (1). By combining NMR spectroscopy with X-ray studies (19, 20), one can gather a more complete picture of the GPCR dynamics than with either method alone.
Solid-State NMR Relaxation Shows Changes in Retinal Dynamics During Light Activation of Rhodopsin.
In Fig. 4 we summarize our interpretation of the experimental 2H NMR data for retinal bound to rhodopsin together with crystallographic analysis (5, 6, 12, 20). At one end of retinal (Fig. 4A) the β-ionone ring is positioned within a hydrophobic cavity, and the C5-Me is in contact with Glu122. At the opposite end, the protonated Schiff base (PSB) interacts electrostatically with its primary Glu113 counterion (43). Our analysis (Fig. 4B) considers the order parameters SC3 for the retinylidene methyl groups, plus the preexponential factors (k0 or D0) and energy barriers (Ea) for rotation (Table 1). A simple explanation of why the C9-Me barrier is smaller than occurs in typical quantum mechanical calculations is provided in Fig. 4C. Here intraretinal 1–6 interactions with hydrogen atoms H7 and H11 of the polyene chain are approximated by a threefold potential. Due to periodic eclipsing interactions, the rotational potentials are offset by ≈180° giving a shallow resultant curve. Interactions within the binding pocket are relatively weak, because the C9-Me occupies a slot between Tyr268 and Thr118. By contrast, for the C13-Me group near the PSB end of retinal (Fig. 4D) and the C5-Me of the β-ionone ring (Fig. 4E) the mobility is less due to nonbonded 1–7 interactions with hydrogens H10 and H8, respectively. The Ea barrier for the C13-Me group may reflect steric interactions with retinal hydrogen H10, and potentially Tyr268 as well. Upon light absorption, the barrier for the C9-Me group is increased about twofold; its rotational dynamics become slower (Table 1). Due to 11-cis to trans isomerization, the 1–6 interactions of the C13-Me group occur with both polyene hydrogens H11 and H15; hence the C13-Me barrier resembles the C9-Me. The most pronounced influences of light-induced isomerization entail the polyene chain of retinal rather than the β-ionone ring (Fig. 4).
Fig. 4.

Illustration of how solid-state 2H NMR relaxation probes local energy landscape of retinal bound to rhodopsin. (A) Solid-state NMR structure of retinal in dark state (32) (red) compared to NMR structure of Meta I (gray) (40) inserted into binding pocket of rhodopsin (1U19) (5). (B) Rotational dynamics of methyl groups characterize mobility of retinal within the binding cavity (see text). (C) Schematic methyl torsional potentials in dark state show low activation barrier for C9-Me due to antiphase 1–6 interactions with hydrogen atoms H7 and H11. (D, E) Potential surfaces for C13- and C5-Me groups include nonbonded 1–7 interactions with hydrogen atoms H10 and H8, respectively.
Changes in Local Retinal Structure and Dynamics Initiate Collective Fluctuations of Transmembrane Helices of Rhodopsin.
We next describe a multiscale activation mechanism for how light-induced changes in local ps–ns motions of retinal underlie TM helix fluctuations in the Meta I–Meta II equilibrium (23, 44). By trapping the conformational states and probing their local dynamics, we explore the energy landscape for the receptor activation. According to our molecular dynamics simulations (45), helices H1–H4 make up the TM core of the receptor (4, 17). The rhodopsin core is stabilized by two ionic locks involving the PSB and the E(D)RY motif with their counterions, plus three hydrogen-bonded networks and several conserved microdomains (27). Light-induced retinal isomerization destabilizes the inactive receptor conformation (17, 18). Activation entails large-scale movements of helices H5 and H6 together with H7 (19, 23), exposing transducin (Gt) recognition sites on the C2 and C3 cytoplasmic loops (22).
A current picture (17, 27, 44) is that photon absorption leads to the major reactions (17, 44): Meta I⇌Meta IIa⇌Meta IIb + H3O+⇌Meta IIbH+, where Meta IIb and Meta IIbH+ are conformational substates that activate transducin (Gt). In Fig. 5 we combine the 2H NMR relaxation data with our FTIR studies (17, 27) and other measurements (18, 19, 23, 40, 45) of μs–ms functional protein movements. In the Meta I state, the C9-Me acts as a hinge point that prevents roll of the entire ligand. The C13-Me moves into close proximity to the β4 strand of the second extracellular loop E2, as suggested by the 2H NMR structure of retinal in Meta I (40). As a result of 11-cis to trans isomerization, the steric force is transmitted via the C13-Me group to the extracellular E2 loop (Fig. 5). A key hydrogen-bonding network is disrupted about E2 connecting the extracellular ends of helices H4, H5, and H6 (26). At the opposite end of retinal, the C5-Me group of the β-ionone ring stays in close proximity to Glu122 of TM helix H3 and Trp265 of helix H6. The β-ionone ring occupies a hydrophobic pocket that encompasses Met207, Phe208, His211, and Phe212 of H5—it is another key anchor point for retinal (33). The high Ea barrier for the C5-Me in Meta I (Table 1) suggests the isomerization force (strain energy) is transmitted via the β-ionone ring towards a second hydrogen-bonding network connecting helices H5 and H3 (40). Expulsion of the β-ionone ring from its hydrophobic cavity (46) or a large movement of retinal are rendered unlikely (25). Dipolar-assisted rotational resonance 13C NMR studies (47) indicate a translation of retinal toward Met207 and Phe208 of helix H5 (18), which is in line with our proposals (40).
Fig. 5.

Changes in retinal structure and dynamics initiate fluctuations of transmembrane helices in rhodopsin activation. Extracellular (e) and cytoplasmic (c) sides of membrane are indicated. Rhodopsin in dark state (1U19) (5) is stabilized by two ionic locks (17) plus hydrogen-bonding networks about Glu122 and about the second extracellular loop E2. The C9-Me group acts as a hinge point for light-induced isomerization of retinal. The polyene chain proximal to the C11═C12 double bond including the C13-Me and C = NH+– of the PSB rotates towards E2; by contrast, the β-ionone ring with its C5-Me group remains in its hydrophobic pocket (40). Allosteric protein movements of E2 loop and helices H5 and H6 expose transducin (Gt) recognition sites involving cytoplasmic C2 and C3 loops. Release of the inhibitory retinal lock yields a volumetric expansion of the protein within the membrane bilayer.
The resulting destabilization of the retinylidene PSB yields deprotonation and breaking the ionic lock with the complex counterion (43) due to Glu113 of H3 and Glu181 of E2. In the Meta I–Meta II equilibrium, internal proton transfer occurs from the PSB to Glu113, yielding the Meta IIa substate that occurs prior to helix motion (17, 44). Straightening of the distorted chromophore gives a potential steric clash of the midportion of the polyene chain with Trp265 of H6 (40). Hence, Trp265 moves towards helix H5, accompanied by a concerted tilting of helix H6 away from the H1–H4 helical core (23) (Fig. 5). Displacement of the β-ionone ring away from Trp265 of H6 and towards Glu122 of H3 yields rearrangement of a hydrogen-bonded network about Glu122 and His211 connecting helices H3 and H5. In the Meta IIb substate, allosteric constraints on helix H5 are released, allowing it to rotate its cytoplasmic end towards helix H6. The charge adduct due to Glu134/Arg135 of the E(D)RY sequence at the cytoplasmic end of helix H3 with Glu247 of helix H6 becomes less stable than Arg135-Tyr223 and Glu247-Lys231 interactions as in opsin (19) (Fig. 5), breaking a second ionic lock. Reversible fluctuations of both helices H5 and H6 alter the cytoplasmic loops, transiently exposing a cavity for binding of transducin (20). Last, the Meta IIbH+ substate is formed by protonation of Glu134 giving a pH-dependent thermodynamic driving force for activation (17).
Collective Protein Fluctuations Within the Membrane Lipid Bilayer Underlie Activation of Rhodopsin.
To connect changes in local retinal mobility with large-scale protein fluctuations, we introduce the concept of a dynamically active receptor. Induced fit of retinal to the binding pocket enjoins a highly twisted conformation upon the ligand (32). Light-induced isomerization entails changes in ps–ns scale mobility and methyl group dynamics within the ligand-binding cavity. Such changes in local retinal dynamics (Fig. 3) underlie the influences of retinylidene methyl groups on the Meta I–Meta II equilibrium (34) within the pressure field of the lipid bilayer (22). In the currency of protein dynamics, large-scale functional motions involve displacements of many atoms within the protein. Significant amounts of strain energy—what we call frustration (21)—are captured in the dark state, and then dissipated in the structural relaxation. We have proposed that rhodopsin is elongated (21, 48) and partially unfolded in the Meta II state (21, 49), so an ensemble of conformers is expected. Reversible TM helical fluctuations of H5 and H6 together with H7 increase the configurational degrees of freedom inherent to the GPCR dynamics. Large-scale protein fluctuations entail a gain in partial molar volume (50) together with an increase in entropy (21, 49), thus providing exposure of recognition sites for transducin (Gt) (19).
Our interpretation differs from the Standard Model, whereby a single light-activated receptor (R*) conformation yields the visual response. As an alternative, we suggest an ensemble of substates occurs due to the entropy gain produced by release of the inhibitory retinal lock. An ensemble activation model is put forth, whereby a manifold of conformational substates leads to rhodopsin activation on a high-dimensional energy landscape. For GPCRs like rhodopsin, their specificity of function masks a subtle balance between stability (enthalpy) and flexibility (conformational entropy) (2, 45, 49). Photon absorption overcomes the barriers between the major conformational states, allowing access to different tiers of the energy landscape. Release of the inhibitory constraints biases the ensemble in favor of substates that expose recognition elements for transducin (Gt). Variables that reduce the entropy gain—for example, rhodopsin mutants, retinal analogues (1, 34, 42), or membrane lipids (21, 22, 49)—yield loss of function through back shifting the Meta I–Meta II equilibrium. Solid-state NMR plays an important role because it is exquisitely sensitive to local order and dynamics. Changes in retinal structure and dynamics thus initiate a transmembrane expansion of rhodopsin, with an increase in entropy that opens the doors of visual perception.
Methods
Bovine rhodopsin was regenerated with retinal 2H-labeled at the C5-, C9-, or C13-Me groups (32) and was recombined with phospholipids by detergent dialysis (22). Membranes were aligned on planar glass substrates (40) or were investigated as randomly oriented suspensions. For the dark and Meta I states, rhodopsin was recombined with POPC (1∶50 molar ratio). Quantitative trapping of the Meta II state utilized a DOPE/POPC (1∶3) mixture (protein/lipid molar ratio of 1∶75). All 2H NMR spectra were acquired with a quadrupolar-echo pulse sequence (40). Relaxation of Zeeman order  was measured by an inversion-recovery pulse sequence, and 2H longitudinal quadrupolar-order (31)
  was measured with a broadband Jeener-Broekaert pulse sequence (SI Text). Molecular graphics were created with PyMOL visualization software [http://www.pymol.org/]. SI Text accompanies this paper.
Supplementary Material
Acknowledgments.
We thank T.A. Cross, H. Frauenfelder, K.P. Hofmann, M. Hong, W.L. Hubbell, L.E. Kay, J.W. Lewis, H. Oschkinat, S.O. Smith, R.W. Pastor, and R. Vogel for discussions. Retinal was generously provided by R. Crouch, S. Krane, K. Tanaka, and K. Nakanishi. Financial support of this research by the US National Institutes of Health (NIH) is gratefully acknowledged.
Footnotes
The authors declare no conflict of interest.
This article is a PNAS Direct Submission.
This article contains supporting information online at www.pnas.org/lookup/suppl/doi:10.1073/pnas.1014692108/-/DCSupplemental.
References
- 1.Nakanishi K. Recent bioorganic studies on rhodopsin and visual transduction. Chem Pharm Bull. 2000;48:1399–1409. doi: 10.1248/cpb.48.1399. [DOI] [PubMed] [Google Scholar]
- 2.Rosenbaum DM, Rasmussen SGF, Kobilka BK. The structure and function of G-protein-coupled receptors. Nature. 2009;459:356–363. doi: 10.1038/nature08144. [DOI] [PMC free article] [PubMed] [Google Scholar]
- 3.Nygaard R, Frimurer TM, Holst B, Rosenkilde MM, Schwartz TW. Ligand binding and micro-switches in 7TM receptor structures. Trends Pharmacol Sci. 2009;30:249–259. doi: 10.1016/j.tips.2009.02.006. [DOI] [PubMed] [Google Scholar]
- 4.Palczewski K, et al. Crystal structure of rhodopsin: a G protein-coupled receptor. Science. 2000;289:739–745. doi: 10.1126/science.289.5480.739. [DOI] [PubMed] [Google Scholar]
- 5.Okada T, et al. The retinal conformation and its environment in rhodopsin in light of a new 2.2 Å crystal structure. J Mol Biol. 2004;342:571–583. doi: 10.1016/j.jmb.2004.07.044. [DOI] [PubMed] [Google Scholar]
- 6.Li J, Edwards PC, Burghammer M, Villa C, Schertler GFX. Structure of bovine rhodopsin in a trigonal crystal form. J Mol Biol. 2004;343:1409–1438. doi: 10.1016/j.jmb.2004.08.090. [DOI] [PubMed] [Google Scholar]
- 7.Standfuss J, et al. Crystal structure of a thermally stable rhodopsin mutant. J Mol Biol. 2007;372:1179–1188. doi: 10.1016/j.jmb.2007.03.007. [DOI] [PMC free article] [PubMed] [Google Scholar]
- 8.Murakami M, Kouyama T. Crystal structure of squid rhodopsin. Nature. 2008;453:363–367. doi: 10.1038/nature06925. [DOI] [PubMed] [Google Scholar]
- 9.Rasmussen SGF, et al. Structure of a nanobody-stabilized active state of the β2 adrenoceptor. Nature. 2011;469:175–189. doi: 10.1038/nature09648. [DOI] [PMC free article] [PubMed] [Google Scholar]
- 10.Warne T, et al. The structural basis for agonist and partial agonist action on a β1-adrenergic receptor. Nature. 2011;469:241–244. doi: 10.1038/nature09746. [DOI] [PMC free article] [PubMed] [Google Scholar]
- 11.Jaakola V-P, et al. The 2.6 Angstrom crystal structure of a human A2A adenosine receptor bound to an antagonist. Science. 2008;322:1211–1217. doi: 10.1126/science.1164772. [DOI] [PMC free article] [PubMed] [Google Scholar]
- 12.Ruprecht JJ, Mielke T, Vogel R, Villa C, Schertler GFX. Electron crystallography reveals the structure of metarhodopsin I. EMBO J. 2004;23:3609–3620. doi: 10.1038/sj.emboj.7600374. [DOI] [PMC free article] [PubMed] [Google Scholar]
- 13.Nakamichi H, Okada T. Local peptide movement in the photoreaction intermediate of rhodopsin. Proc Natl Acad Sci USA. 2006;103:12729–12734. doi: 10.1073/pnas.0601765103. [DOI] [PMC free article] [PubMed] [Google Scholar]
- 14.Salom D, et al. Crystal structure of a photoactivated deprotonated intermediate of rhodopsin. Proc Natl Acad Sci USA. 2006;103:16123–16128. doi: 10.1073/pnas.0608022103. [DOI] [PMC free article] [PubMed] [Google Scholar]
- 15.Lewis JW, Kliger DS. Absorption spectroscopy in studies of visual pigments: spectral and kinetic characterization of intermediates. Method Enzymol. 2000;315:164–178. doi: 10.1016/s0076-6879(00)15842-2. [DOI] [PubMed] [Google Scholar]
- 16.Kukura P, McCamant DW, Yoon S, Wandschneider DB, Mathies RA. Structural observation of the primary isomerization in vision with femtosecond-stimulated Raman. Science. 2005;310:1006–1009. doi: 10.1126/science.1118379. [DOI] [PubMed] [Google Scholar]
- 17.Mahalingam M, Martínez-Mayorga K, Brown MF, Vogel R. Two protonation switches control rhodopsin activation in membranes. Proc Natl Acad Sci USA. 2008;105:17795–17800. doi: 10.1073/pnas.0804541105. [DOI] [PMC free article] [PubMed] [Google Scholar]
- 18.Ahuja S, et al. Location of the retinal chromophore in the activated state of rhodopsin. J Biol Chem. 2009;284:10190–10201. doi: 10.1074/jbc.M805725200. [DOI] [PMC free article] [PubMed] [Google Scholar]
- 19.Park JH, Scheerer P, Hofmann KP, Choe H-W, Ernst OP. Crystal structure of the ligand-free G-protein-coupled receptor opsin. Nature. 2008;454:183–188. doi: 10.1038/nature07063. [DOI] [PubMed] [Google Scholar]
- 20.Scheerer P, et al. Crystal structure of opsin in its G-protein-interacting conformation. Nature. 2008;455:497–502. doi: 10.1038/nature07330. [DOI] [PubMed] [Google Scholar]
- 21.Brown MF. Modulation of rhodopsin function by properties of the membrane bilayer. Chem Phys Lipids. 1994;73:159–180. doi: 10.1016/0009-3084(94)90180-5. [DOI] [PubMed] [Google Scholar]
- 22.Botelho AV, Huber T, Sakmar TP, Brown MF. Curvature and hydrophobic forces drive oligomerization and modulate activity of rhodopsin in membranes. Biophys J. 2006;91:4464–4477. doi: 10.1529/biophysj.106.082776. [DOI] [PMC free article] [PubMed] [Google Scholar]
- 23.Altenbach C, Kusnetzow AK, Ernst OP, Hofmann KP, Hubbell WL. High-resolution distance mapping in rhodopsin reveals the pattern of helix movement due to activation. Proc Natl Acad Sci USA. 2008;105:7439–7444. doi: 10.1073/pnas.0802515105. [DOI] [PMC free article] [PubMed] [Google Scholar]
- 24.Creemers AFL, et al. 1H and 13C MAS NMR evidence for pronounced ligand-protein interactions involving the ionone ring of the retinylidene chromophore in rhodopsin. Proc Natl Acad Sci USA. 2002;99:9101–9106. doi: 10.1073/pnas.112677599. [DOI] [PMC free article] [PubMed] [Google Scholar]
- 25.Spooner PJR, et al. The ring of the rhodopsin chromophore in a hydrophobic activation switch within the binding pocket. J Mol Biol. 2004;343:719–730. doi: 10.1016/j.jmb.2004.08.049. [DOI] [PubMed] [Google Scholar]
- 26.Ahuja S, et al. Helix movement is coupled to displacement of the second extracellular loop in rhodopsin activation. Nat Struct Mol Biol. 2009;16:168–175. doi: 10.1038/nsmb.1549. [DOI] [PMC free article] [PubMed] [Google Scholar]
- 27.Zaitseva E, Brown MF, Vogel R. Sequential rearrangement of interhelical networks upon rhodopsin activation in membranes: the Meta IIa conformational substate. J Am Chem Soc. 2010;132:4815–4821. doi: 10.1021/ja910317a. [DOI] [PMC free article] [PubMed] [Google Scholar]
- 28.McDermott A. Structure and dynamics of membrane proteins by magic angle spinning solid-state NMR. Ann Rev Biophys. 2009;38:385–403. doi: 10.1146/annurev.biophys.050708.133719. [DOI] [PubMed] [Google Scholar]
- 29.Struts AV, Salgado GFJ, Martínez-Mayorga K, Brown MF. Retinal dynamics underlie its switch from inverse agonist to agonist during rhodopsin activation. Nat Struct Mol Biol. 2011;18:392–394. doi: 10.1038/nsmb.1982. [DOI] [PMC free article] [PubMed] [Google Scholar]
- 30.Brown MF. Theory of spin-lattice relaxation in lipid bilayers and biological membranes. 2H and 14N quadrupolar relaxation. J Chem Phys. 1982;77:1576–1599. [Google Scholar]
- 31.Nevzorov AA, Trouard TP, Brown MF. Lipid bilayer dynamics from simultaneous analysis of orientation and frequency dependence of deuterium spin-lattice and quadrupolar order relaxation. Phys Rev E. 1998;58:2259–2281. [Google Scholar]
- 32.Salgado GFJ, et al. Deuterium NMR structure of retinal in the ground state of rhodopsin. Biochemistry. 2004;43:12819–12828. doi: 10.1021/bi0491191. [DOI] [PubMed] [Google Scholar]
- 33.Vogel R, Siebert F, Lüdeke S, Hirshfeld A, Sheves M. Agonists and partial agonists of rhodopsin: retinals with ring modifications. Biochemistry. 2005;44:11684–11699. doi: 10.1021/bi0508587. [DOI] [PubMed] [Google Scholar]
- 34.Vogel R, et al. Agonists and partial agonists of rhodopsin: retinal polyene methylation affects receptor activation. Biochemistry. 2006;45:1640–1652. doi: 10.1021/bi052196r. [DOI] [PubMed] [Google Scholar]
- 35.Torchia DA, Szabo A. Spin-lattice relaxation in solids. J Magn Reson. 1982;49:107–121. [Google Scholar]
- 36.Trouard TP, Alam TM, Brown MF. Angular dependence of deuterium spin-lattice relaxation rates of macroscopically oriented dilaurylphosphatidylcholine in the liquid-crystalline state. J Chem Phys. 1994;101:5229–5261. [Google Scholar]
- 37.Copié V, et al. Deuterium solid-state NMR studies of methyl group dynamics in bacteriorhodopsin and retinal model compounds: evidence for a 6-s-trans chromophore in the protein. Biochemistry. 1994;33:3280–3286. doi: 10.1021/bi00177a019. [DOI] [PubMed] [Google Scholar]
- 38.Kochendoerfer GG, Verdegem PJE, van der Hoef I, Lugtenburg J, Mathies RA. Retinal analog study of the role of steric interactions in the excited state isomerization dynamics of rhodopsin. Biochemistry. 1996;35:16230–16240. doi: 10.1021/bi961951l. [DOI] [PubMed] [Google Scholar]
- 39.Salgado GFJ, et al. Solid-state 2H NMR structure of retinal in metarhodopsin I. J Am Chem Soc. 2006;128:11067–11071. doi: 10.1021/ja058738+. [DOI] [PubMed] [Google Scholar]
- 40.Struts AV, et al. Structural analysis and dynamics of retinal chromophore in dark and meta I states of rhodopsin from 2H NMR of aligned membranes. J Mol Biol. 2007;372:50–66. doi: 10.1016/j.jmb.2007.03.046. [DOI] [PMC free article] [PubMed] [Google Scholar]
- 41.Bartl FJ, et al. Partial agonism in a G protein-coupled receptor. Role of the retinal ring structure in rhodopsin activation. J Biol Chem. 2005;280:34259–34267. doi: 10.1074/jbc.M505260200. [DOI] [PubMed] [Google Scholar]
- 42.Knierim B, Hofmann KP, Gärtner W, Hubbell WL, Ernst OP. Rhodopsin and 9-demethyl-retinal analog: effect of a partial agonist on displacement of transmembrane helix 6 in class A G protein-coupled receptors. J Biol Chem. 2008;283:4967–4974. doi: 10.1074/jbc.M703059200. [DOI] [PubMed] [Google Scholar]
- 43.Martínez-Mayorga K, Pitman MC, Grossfield A, Feller SE, Brown MF. Retinal counterion switch mechanism in vision evaluated by molecular simulations. J Am Chem Soc. 2006;128:16502–16503. doi: 10.1021/ja0671971. [DOI] [PubMed] [Google Scholar]
- 44.Knierim B, Hofmann KP, Ernst OP, Hubbell WL. Sequence of late molecular events in the activation of rhodopsin. Proc Natl Acad Sci USA. 2007;104:20290–20295. doi: 10.1073/pnas.0710393104. [DOI] [PMC free article] [PubMed] [Google Scholar]
- 45.Huber T, Botelho AV, Beyer K, Brown MF. Membrane model for the GPCR prototype rhodopsin: hydrophobic interface and dynamical structure. Biophys J. 2004;86:2078–2100. doi: 10.1016/S0006-3495(04)74268-X. [DOI] [PMC free article] [PubMed] [Google Scholar]
- 46.Borhan B, Souto ML, Imai H, Shichida Y, Nakanishi K. Movement of retinal along the visual transduction path. Science. 2000;288:2209–2212. doi: 10.1126/science.288.5474.2209. [DOI] [PubMed] [Google Scholar]
- 47.Patel AB, et al. Coupling of retinal isomerization to the activation of rhodopsin. Proc Natl Acad Sci USA. 2004;101:10048–10053. doi: 10.1073/pnas.0402848101. [DOI] [PMC free article] [PubMed] [Google Scholar]
- 48.Salamon Z, Brown MF, Tollin G. Plasmon resonance spectroscopy: probing molecular interactions within membranes. Trends Biochem Sci. 1999;24:213–219. doi: 10.1016/s0968-0004(99)01394-8. [DOI] [PubMed] [Google Scholar]
- 49.Brown MF. Influence of non-lamellar forming lipids on rhodopsin. Curr Top Membr. 1997;44:285–356. [Google Scholar]
- 50.Attwood PV, Gutfreund H. The application of pressure relaxation to the study of the equilibrium between metarhodopsin I and II from bovine retinas. FEBS Lett. 1980;119:323–326. doi: 10.1016/0014-5793(80)80281-x. [DOI] [PubMed] [Google Scholar]
Associated Data
This section collects any data citations, data availability statements, or supplementary materials included in this article.