Abstract
Klotho is a multifunctional protein involved in numerous biological functions, ranging from mineral ion metabolism to signaling activities. Recent studies have identified klotho as a target gene for peroxisome proliferator-activated receptor-γ (PPAR-γ), a master regulator of adipocyte differentiation, and an adipogenesis-promoting factor. In a similar line of observation, eliminating klotho function from mice resulted in the generation of lean mice with almost no detectable fat tissue. In contrast to the klotho-knockout mice (11.7±0.3 g at 9 wk), leptin-deficient (ob/ob) mice are severely obese (49.3±0.6 g at 9 wk), due to excessive fat accumulation. To study the in vivo role of klotho in obesity, we have generated and characterized ob/ob mice lacking klotho activity [ob/ob-klotho double-knockout (DKO) mice]. The ob/ob mice started to get bigger from 3 wk onward and gained almost 2 times more weight than their wild-type (WT) counterparts (WT vs. ob/ob: 34.8±1.3 vs. 65.5±1.2 g at 21 wk). The generated ob/ob-klotho DKO mice were not only viable throughout their adulthood but also showed markedly reduced fat tissue accumulation compared to their ob/ob littermates. The ob/ob-klotho DKO mice had significantly (P<0.01) less retroperitoneal, mesenteric, and epididymal fat accumulation, compared to their ob/ob counterparts. Similarly, the fatty liver that was consistently observed in the ob/ob mice was eliminated in the ob/ob-klotho DKO mice. Such structural improvement in the liver was also evident from markedly reduced fasting blood glucose levels in ob/ob-klotho DKO mice, compared to their ob/ob counterparts (ob/ob vs. ob/ob-klotho DKO: 266 ± 36 vs. 65±2 mg/dl). Finally, to study whether the absence of klotho can induce resistance to high-fat-diet-induced obesity, we provided a high-fat (60%) diet to klotho-knockout mice and compared them with normal-fat (20%) diet-fed klotho-knockout mice. No significant difference in body weight was detected in klotho-knockout mice fed either the normal-fat diet or high-fat diet, while WT mice fed the high-fat diet gradually gained body weight, compared to the normal-fat-diet-fed counterparts. The results of our dietary and genetic manipulation studies provide in vivo evidence for a role of klotho in obesity and offer a novel target to manipulate obesity and associated complications.—Ohnishi, M., Kato, S., Akiyoshi, J., Atfi, A., Razzaque, M. S. Dietary and genetic evidence for enhancing glucose metabolism and reducing obesity by inhibiting klotho functions.
Keywords: insulin, liver, vitamin D
Klotho is a multifunctional protein that is expressed in the distal convoluted tubules of the kidney, the parathyroid gland, and the epithelium of the choroid plexus in the brain (1). Expression of klotho has also been detected in adipogenic cells (2). In vitro studies have shown that klotho is an adipogenesis-promoting factor and that overexpression of klotho in the preadipocyte 3T3-L1 cell line can induce expression of several adipogenic markers, including PPARγ, αP2, C/EBPα, and C/EBPδ, to facilitate the differentiation of preadipocytes into mature adipocytes (2). More important, reducing klotho activity genetically can dramatically suppress fat tissue accumulation in mutant mice that lack a subcutaneous fat layer (3–6). These observations of klotho-knockout mice (5–7), together with the in vitro documentation that klotho can promote adipogenesis (2), led us to contemplate the in vivo role for klotho in obesity.
Mice deficient for leptin (generally referred to as ob/ob) develop hyperglycemia and obesity (8). The main function of leptin is to regulate appetite by communicating with the brain, a process interrupted in ob/ob mice, leading to uncontrolled food intake (9). The obesity observed in ob/ob mice is associated with an increase in both the number and size of adipocytes (10). Mutant ob/ob mice gain weight rapidly throughout their lives, reaching a weight of almost 3 times that of wild-type (WT) mice due to excessive body fat accumulation (10). Furthermore, ob/ob mice develop hyperglycemia, despite enlarged pancreatic islets and increased levels of insulin. In this study, we propose to use klotho-knockout mice as a model system to study the in vivo effects of klotho on glucose homeostasis and obesity, by generating ob/ob mice deficient in klotho activity [ob/ob-klotho double-knockout (DKO) mice]. Furthermore, we studied whether lack of klotho can influence high-fat-diet-induced obesity, by providing klotho-knockout mice with a high-fat diet (11, 12) and comparing the phenotype with normal-fat-diet-fed counterparts.
MATERIALS AND METHODS
Generation of double-mutant mice
We crossbred heterozygous klotho mutants (Lexicon Genetics; Mutant Mouse Regional Resource Centers, University of California at Davis, Davis, CA, USA) with heterozygous obese [C57BL/6J lepob (+/−) mutants; Jackson Laboratory, Bar Harbor, ME, USA] to obtain ob/ob-klotho DKO mice in a C57BL6 background. Routine PCR using genomic DNA extracted from tail clips was performed for genotyping the various groups of mice (4, 6, 13). Mice were maintained in accordance with the U.S. National Institutes of Health Guide for the Care and Use of Laboratory Animals and were employed using protocols approved by the Harvard School of Dental Medicine's subcommittee on animal care.
Gross phenotype and body weight
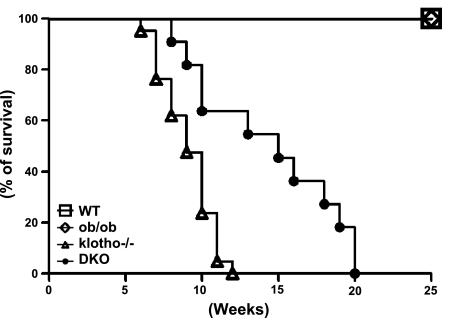
The total body weight of WT, klotho−/−, ob/ob, and ob/ob-klotho DKO mice was recorded weekly starting at 3 wk of age until 30 wk. The survival of 4 groups of animals was recorded until 25 wk. All the klotho−/− mice and ob/ob-klotho DKO mice died by 20 wk of age, whereas none of the WT or ob/ob mice died by the end of the 25 wk of observation. At least 3 mice from each genotype were sacrificed at 9 wk, and retroperitoneal, mesenteric, and epididymal fat tissue weights were recorded. In addition, liver weights of the WT, klotho−/−, ob/ob, and ob/ob-klotho DKO mice were recorded before fixing part of the liver for histological analysis.
Blood measurements
Fasting blood glucose levels were determined in all 4 genotypes. In addition, serum from blood, obtained by cheek-pouch bleeding of WT, klotho−/−, ob/ob, and ob/ob-klotho DKO mice, was isolated and stored at −80°C. Serum cholesterol and triglyceride levels were measured using a commercially available kit (Wako Chemicals, Osaka, Japan). Serum phosphorus levels were determined using colorimetric measurement with the Stanbio Phosphorus Liqui-UV Test (Stanbio Laboratory, Boerne, TX, USA), and calcium levels were obtained using the Calcium (Arsenazo) LiquiColor Test (Stanbio). The level of 1,25(OH)2D3 was measured in serum obtained from different genotypes using a kit purchased from Immunodiagnostic Systems Ltd. (Fountain Hills, AZ, USA).
Glucose and insulin tolerance test
A glucose tolerance test was performed on WT, klotho−/−, ob/ob, and ob/ob-klotho DKO mice. At least 3 mice from each group were used. Briefly, after overnight food deprivation (klotho−/− and ob/ob-klotho DKO mice were denied access to food for 4 h), blood was collected by cheek-pouch bleeding to determine fasting glucose levels; animals were then injected with glucose (2 g/kg) into the intraperitoneal cavity, and blood was collected (by tail bleeding) postinjection at 15, 30, 60, and 120 min and used for glucose measurements. As for the insulin tolerance test, mice were denied food for 4 h and then bled from the cheek pouch to obtain preinjection glucose levels, as determined immediately using the Bayer's Contour Blood Glucose measuring strips (Bayer Diabetes Care, Tarrytown, NY, USA). After determining preinjection glucose levels, insulin (0.5 U/kg body weight) was injected intraperitoneally, and subsequent blood samples were collected at 15, 30, and 60 min postinjection form the tail vein to measure blood glucose levels.
High-fat diet
The WT and klotho-knockout mice were fed either a normal-fat (20%) diet or a high-fat (60%) diet, starting at 3 wk and continuing for ≥9 wk. At least 5 mice were in each experimental group. The effects of the different fat content of the diets on weight gain were recorded each week. The WT and klotho knockouts fed normal and high-fat diets were sacrificed at 12 wk to determine retroperitoneal, mesenteric, and epididymal fat weights in various groups. Similarly, liver weights were recorded before further processing for histological analysis.
Histological analyses
Histological sections were prepared from the liver, after routinely fixing the tissues in either 10% buffered formalin or Carnoy's solution, and were subsequently embedded in paraffin. Paraffin sections (4–6 μm)were mounted on SuperFrost Plus slides. The sections were stained with hematoxylin-and-eosin (14, 15). Histological changes in various groups were documented by light microscopy.
Statistics
Statistically significant differences between groups were evaluated by either Student's t test or Mann-Whitney U test for a comparison between two groups. All values are expressed as means ± se. A value of P < 0.05 was considered to be statistically significant. All analyses were performed using Microsoft Excel (Microsoft, Redmond, WA, USA). The Kaplan-Meier survival curve was generated using Prism (GraphPad Software Inc., San Diego, CA, USA).
RESULTS
Generation of ob/ob-klotho double-mutant mice
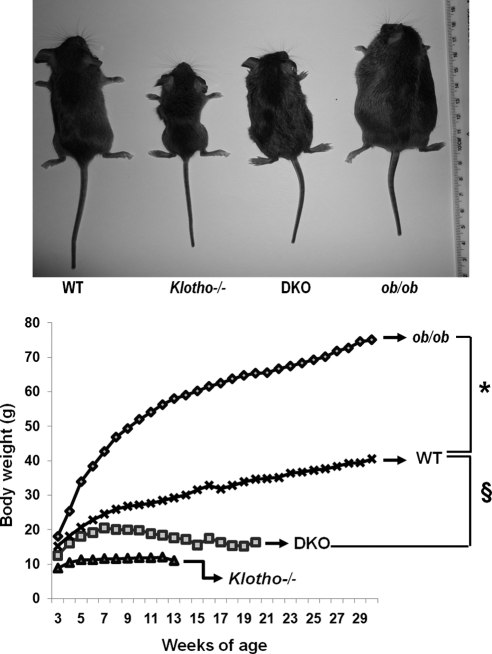
To elucidate the consequences of reducing klotho activity from ob/ob mice on a long-term basis in vivo, we generated a new ob/ob mouse model deficient in klotho function (ob/ob-klotho DKO mice; Fig. 1, top panel). The generated DKO mice were viable throughout their adulthood and were significantly smaller than ob/ob mice (Fig. 1, top panel). At birth, DKO mice were indistinguishable from littermates of other genotypes. At 6 wk of age, DKO mice (19.2±1.06 g) were larger than klotho−/− mice (11.2±0.28 g) but were significantly smaller than ob/ob mice (38.4±0.59 g; Fig. 1, bottom panel). At 6 wk, the average body weight of WT mice was 22.8 ± 0.86 g (Fig. 1, bottom panel).
Figure 1.
Gross phenotype of ob/ob-klotho double mutants. Top panel: gross appearance (littermates) of WT, klotho−/−, ob/ob, and ob/ob-klotho DKO mice at 9 wk of age. Note that compared to the ob/ob mouse, the ob/ob-klotho DKO mice mouse is significantly smaller in size. Bottom panel: body weight chart of WT (n=24), klotho−/− (n=34), ob/ob (n=33), and ob/ob-klotho DKO (n=25) mice, showing that ob/ob-klotho DKO mice are significantly smaller than ob/ob mice. These observations suggest that inactivation of klotho function in ob/ob mice can reduce obesity in DKO mice. Statistical analysis of each time point is provided in Supplemental Fig. S1A. *P < 0.0001 vs. ob/ob mice; §P < 0.0001 vs. DKO mice from 11 wk onward.
At 12 wk of age, ob/ob-klotho DKO mice were still smaller than their ob/ob littermates (ob/ob vs. DKO: 56.2±0.80 vs. 18.3±1.55 g) and were larger than klotho−/− mice (12.0±0.44 g). At 12 wk, the average body weight of WT mice was 28.5 ± 1.03 g (Fig. 1). The statistical analysis for body weight of each time points is provided in Supplemental Fig. S1. Of relevance, the 24-h food intake of ob/ob-klotho DKO mice was significantly higher than that of klotho−/− mice and was rather similar to that of ob/ob mice (Supplemental Fig. S2).
Estimation of fat tissue accumulation in ob/ob-klotho mutant mice
The most profound effect of the inactivation of klotho on ob/ob mice was observed on fat tissue accumulation (Fig. 2). Compared to the WT mice, klotho−/− mice barely showed any abdominal fat tissue by 9 wk of age; in contrast, markedly increased abdominal fat accumulation was detected in ob/ob mice of similar age (Fig. 2). The ob/ob-klotho DKO mice, however, showed an intermediate phenotype of abdominal fat accumulation, that is, more than klotho−/− mice but significantly less than ob/ob mice. The increased body weight of ob/ob mice (Fig. 1) is partly due to the excessive accumulation of retroperitoneal, mesenteric, and epididymal fat tissues (Fig. 2). Notably, deleting klotho function from ob/ob mice significantly reduced fat tissue accumulation in all three measured compartments of DKO mice (Fig. 2). The ob/ob-klotho DKO mice survived a little longer than klotho−/− mice; whether the modest weight gain of ob/ob-klotho DKO mice, as compared to the extremely lean klotho−/− mice, may provide a survival benefit will need additional study (Fig. 3). The moderate body weight gain of ob/ob-klotho DKO mice could be related to increased consumption of food (due to leptin deficiency) as compared to klotho−/− mice. Of relevance, recent human studies have shown that the presence of a moderate amount of fat tissue may contribute to better survival (16).
Figure 2.
Fat distribution of ob/ob-klotho double mutants. Fat weight chart of WT, klotho−/−, ob/ob, and ob/ob-klotho DKO mice. Only male mice were used to calculate fat weight. Analyses of retroperitoneal, mesenteric, and epididymal fat tissue weight suggest that ob/ob mice have significantly increased accumulation of fat tissue, compared to their WT counterparts. Inactivating klotho function from ob/ob mice markedly reduced fat accumulation in ob/ob-klotho DKO mice. *P < 0.001 vs. WT; #P < 0.001 vs. WT; ¶P < 0.01 vs. ob/ob.
Figure 3.
Survival curve. Survival analysis of WT control (n=17), ob/ob (n=25), ob/ob-klotho−/− (n=11), and klotho−/− (n=21) mice. Note that the survival of hyperphosphatemic klotho−/− mice is much lower than for WT or ob/ob mice. All of the klotho−/− mice died by 13 wk of age, but none of the WT or ob/ob mice died within the 25 wk of the observation period. Notably, compared to klotho−/− mice, ob/ob-klotho−/− mice had slightly better survival and lived up to 20 wk of age.
Analysis of liver of ob/ob-klotho mutant mice
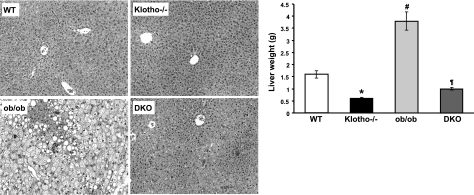
The leptin-deficient ob/ob mice showed steatosis in all zones of the hepatic lobule (Fig. 4, left panel). In contrast, there were no fatty changes in the liver of the ob/ob-klotho DKO mice; in fact, the liver structure was similar to that of klotho−/− mice (Fig. 4, left panel). At 9 wk of age, the average liver weight of ob/ob-klotho DKO mice was 0.99 ± 0.05 g, which was significantly lower (P<0.01) than that of their ob/ob littermates (3.77±0.38 g). At 9 wk, the average liver weight of WT mice was 1.59 ± 0.15 g, whereas the liver weight of age-matched klotho−/− mice was 0.57 ± 0.04 g (Fig. 4, right panel).
Figure 4.
Analysis of liver of ob/ob-klotho double mutants. Left panels: microscopic features of liver sections prepared from WT, klotho−/−, ob/ob, and ob/ob-klotho DKO mice at 9 wk of age, showing abnormal fat accumulation in the liver of ob/ob mice. No such features of steatosis are seen in the liver sections prepared from ob/ob-klotho DKO mice. In addition to the massive fatty changes of the liver, focal inflammatory infiltrates are also noted in the liver sections prepared from ob/ob mice (H&E staining, ×40). Right panel: liver weight chart for WT, klotho−/−, ob/ob, and ob/ob-klotho DKO mice at 9 wk of age. Note that compared to the increased liver weight in ob/ob mice, the ob/ob-klotho DKO mice have significantly lower liver weight and are similar to klotho−/− mice. *P < 0.01 vs. WT; #P < 0.01 vs. WT; ¶P < 0.01 vs. ob/ob.
Serum cholesterol and triglyceride levels of ob/ob-klotho mutant mice
We measured serum cholesterol and triglyceride levels in the various genotypes. Compared to WT mice (158.2±9 mg/dl), ob/ob mice showed elevated serum cholesterol levels (217.9±7 mg/dl) at around 9 to 11 wk of age. In contrast to the serum cholesterol of klotho−/− mice (169.4±5 mg/dl), the serum cholesterol level of DKO mice was higher (205±15 mg/dl; Fig. 5, left panel). As for triglyceride levels, compared to WT mice (105.6±5 mg/dl), both ob/ob (207.5±11 mg/dl) and ob/ob-klotho DKO mice (151.5±9 mg/dl) had significantly higher serum levels (Fig. 5, right panel). The serum triglyceride level of klotho−/− mice was 109.5 ± 6 mg/dl (Fig. 5, right panel).
Figure 5.
Measurements of serum cholesterol and triglyceride levels. Left panel: compared to WT mice (n=8; 158.2±9 mg/dl), serum cholesterol levels are markedly increased in ob/ob mice (n=10; 217.9±7 mg/dl). In ob/ob-klotho DKO mice (n=12; 205±15 mg/dl), serum cholesterol levels are comparable to those of ob/ob mice. Serum cholesterol levels in klotho−/− mice (n=12) are 169.4 ± 5 mg/dl. #P < 0.001 vs. WT; ¶P<0.05 vs. WT. Right panel: compared to WT mice (n=15; 105.6±5 mg/dl), serum triglyceride levels are are significantly increased in ob/ob mice (n=5; 207.5±11 mg/dl). Similar to the ob/ob mice, serum triglyceride levels are also high in ob/ob-klotho DKO mice (n=15; 151.5±9 mg/dl). Serum triglyceride levels in klotho−/− mice (n=11; 109.5±6 mg/dl) are similar to their WT counterparts. #P < 0.001 vs. WT; ¶P < 0.01 vs. WT.
We also measured serum phosphate and calcium levels in 6-wk-old WT, klotho−/−, ob/ob, and ob/ob-klotho DKO mice. Compared to WT mice (6.7±0.1 mg/dl), the ob/ob-klotho DKO mice were hyperphosphatemic. The high serum phosphate levels in ob/ob-klotho DKO mice (12.6±0.3 mg/dl) were similar to those seen in age-matched klotho−/− mice (11.5±0.3 mg/dl). Slightly higher serum phosphate levels were also detected in ob/ob mice (9.1±0.2 mg/dl; Supplemental Fig. S3). As for serum calcium levels, compared to the WT mice (7.4±0.09 mg/dl), the klotho−/− mice (10.2±0.1 mg/dl) showed elevated serum calcium levels at 6 wk of age, similar to the levels observed in ob/ob-klotho DKO mice (9.4±0.1 mg/dl). Slightly higher serum calcium levels were also noted in ob/ob mice (9±0.2 mg/dl; Supplemental Fig. S3).
Glucose and insulin tolerance test of ob/ob-klotho mutant mice
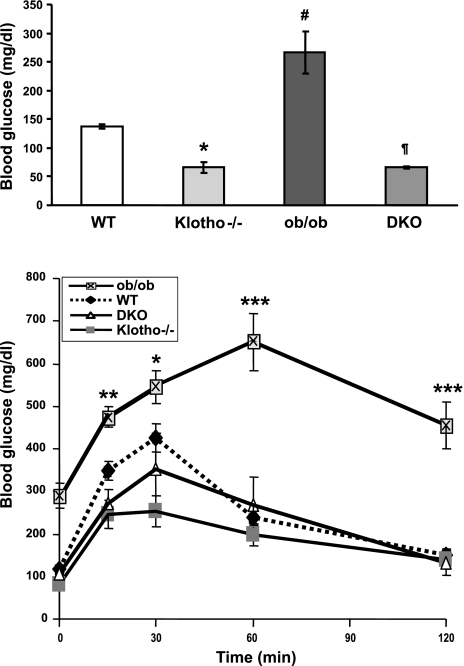
The fasting blood glucose level in ob/ob mice (266.0± 36.29 mg/dl) was significantly higher than in WT mice (136.8±3.47 mg/dl). However, in contrast to the ob/ob mice, the fasting blood glucose level was significantly reduced in ob/ob-klotho DKO mice (65.8±2.32 mg/dl) and was similar to klotho−/− mice of identical age (66.6±10.05 mg/dl; Fig. 6, top panel). It is well documented that the hyperglycemia of ob/ob mice is due to insulin resistance. To determine whether eliminating klotho function from ob/ob mice can alter such resistance, we have performed both glucose tolerance (Fig. 6, bottom panel) and insulin tolerance tests (Supplemental Fig. S4) on 9–11 wk-old WT, klotho−/−, ob/ob, and ob/ob-klotho DKO mice. Compared to the WT mice, blood glucose concentrations were significantly higher in ob/ob mice following glucose challenge; such elevated glucose levels were detected by 15 min postinjection, and remained higher at all measured time points until 120 min postinjection, indicating a lack of blood glucose clearance in ob/ob mice (Fig. 6, bottom panel). In contrast to the ob/ob mice, blood glucose levels were significantly lower in both klotho−/− and ob/ob-klotho DKO mice following intraperitoneal glucose challenge, suggesting accelerated blood glucose clearance in mice without klotho activities.
Figure 6.
Measurements of blood glucose and glucose tolerance test. Top panel: compared to WT mice (n=4; 136.8±3.47 mg/dl), fasting blood glucose levels are significantly increased in ob/ob mice (n=6; 266±36.29 mg/dl). In contrast to ob/ob mice, fasting blood glucose levels are dramatically reduced in ob/ob-klotho DKO mice (n=4; 65.8±2.32 mg/dl). Note that fasting blood glucose levels in klotho−/− mice (n=7; 66.0±10.05 mg/dl) are similar to those in DKO mice. *P < 0.01 vs. WT; #P < 0.001 vs. WT; ¶P < 0.001 vs. ob/ob. Bottom panel: blood glucose concentrations were measured at various time points before and after intraperitoneal administration of glucose. Compared to WT mice, blood glucose concentrations are significantly higher in ob/ob mice at 15 min following glucose challenge and remain higher throughout the following time points until 120 min, indicating a lack of blood glucose clearance in ob/ob mice. In contrast to ob/ob mice, blood glucose levels are significantly lower in both klotho−/− and ob/ob-klotho DKO mice after intraperitoneal glucose challenge, suggesting accelerated blood glucose clearance in mice without klotho activities. *P < 0.05, **P < 0.01, ***P<0.001 vs. WT.
As for the insulin tolerance test, the blood glucose levels in ob/ob mice did not show major changes in response to insulin injection, whereas the WT mice showed gradual, yet significant, reduction of blood glucose levels following insulin treatment. The reduction of blood glucose levels following insulin treatment was most marked in klotho−/− and ob/ob-klotho DKO mice (Supplemental Fig. S4). These results suggest that insulin-resistant ob/ob mice become insulin sensitive when klotho activity is eliminated from these mice. Further study will be needed to determine the mechanisms of such striking changes in glucose metabolism. Of relevance, both ob/ob and ob/ob-klotho DKO mice had significantly higher serum levels of insulin.
Effects of a high-fat diet on klotho mutant mice
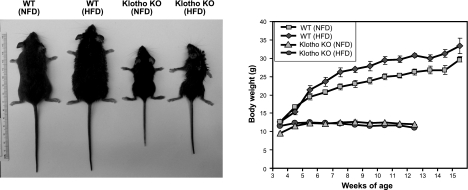
Because a high-fat diet can increase accumulation of white adipose tissue, and thereby promote obesity (12, 17), we studied whether the absence of klotho can influence diet-induced obesity. The WT mice fed a high-fat (60%) diet started to gain additional body weight from 3 wk onward (Fig. 7, left panel). The average food intake for the normal and high-fat diets was similar for WT mice (Supplemental Fig. S5). The average body weight of WT mice receiving the high-fat diet for 9 wk was 30.8 ± 0.4 g, which was higher than that of the WT mice who received the normal-fat diet (26.2±0.8 g) for a similar duration (Fig. 7, right panel). However, such high-fat-diet-induced weight gain was not observed in mice lacking klotho function. The body weight for klotho−/− mice fed a normal-fat diet was similar to that of klotho−/− mice fed a high-fat diet (Fig. 7, right panel). After 9 wk of the high-fat diet, the average body weight of klotho−/− mice was 11.6 ± 0.28 g, and the average body weight of klotho−/− mice fed a normal-fat diet for a similar period was 12.3 ± 0.3 g (Fig. 7, right panel). Notably, the average food intake for normal and high-fat diets was similar for klotho−/− mice (Supplemental Fig. S6).
Figure 7.
Gross phenotype of klotho mutants fed the high-fat diet. Left panel: gross appearance of WT and klotho−/− mice fed the normal-fat diet (NFD) and high-fat diet (HFD) for ∼9 wk. Note that the WT mouse fed HFD gained body weight, whereas the klotho−/− mouse fed HFD does not show any such weight gain. Right panel: body weight chart for NFD- and HFD-fed mice shows that HFD-fed WT mice gradually gained additional weight, compared to the NFD-fed WT mice. However, such HFD-induced weight gain was not observed in klotho−/− mice. Body weight for klotho−/− mice fed HFD is similar to that of klotho−/− mice fed NFD, suggesting that klotho−/− mice are resistant to diet-induced obesity. Statistical analysis of each time point is provided in Supplemental Fig. S1B.
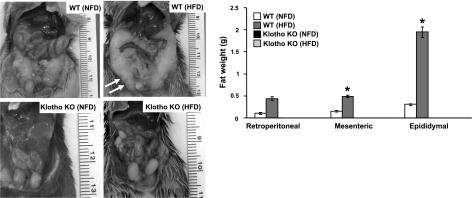
Consistent with the observed weight gain, WT mice who received the high-fat diet showed increased abdominal fat accumulation, as compared to their normal-fat-diet-fed counterparts (Fig. 8, left panel). No such abdominal fat accumulation was noted in klotho−/− mice fed the high-fat diet (Fig. 8, left panel). Compared with the normal-fat-diet-fed WT mice, WT mice fed the high-fat diet had markedly increased accumulation of retroperitoneal, mesenteric, and epididymal fat tissues, as shown through quantitative analysis (Fig. 8, right panel). However, providing the high-fat diet to the klotho−/− mice did not increase retroperitoneal, mesenteric, and epididymal fat tissue accumulation (Fig. 8, right panel), suggesting that klotho−/− mice remain resistant to diet-induced obesity. Of relevance, the 24-h food intake of klotho−/− mice fed either the normal-fat diet or the high-fat diet was similar in both the groups (Supplemental Fig S6).
Figure 8.
Analysis of fat distribution in high-fat-diet-fed male mice. Left panel: gross phenotype of WT and klotho−/− mice fed the normal-fat diet (NFD) and high-fat diet (HFD) for ∼9 wk, showing abdominal fat accumulation (arrows) in WT mice fed HFD. Right panel: fat weight chart for WT and klotho−/− mice fed NFD and HFD. Analysis of retroperitoneal, mesenteric, and epididymal fat tissues suggest that WT mice fed HFD have increased accumulation of fat tissues, compared to their WT counterparts fed NFD. Note that no such fat accumulation is noted in HFD-fed klotho−/− mice. *P < 0.01 vs. WT (NFD).
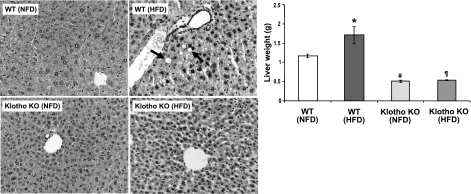
We examined the effects of a high-fat diet on the liver. Compared with the control mice fed the normal-fat diet, the WT mice fed the high-fat diet showed increased fat cell accumulation in the liver (Fig. 9, left panel). No such hepatic fat accumulation was noted in the klotho−/− mice fed either the normal- or high-fat diet (Fig. 9, left panel). After 9 wk of the high-fat diet, the average liver weight of WT mice was 1.70 ± 0.22 g, which was significantly (P<0.05) higher than their normal-fat-diet-fed counterparts (1.12±0.05 g). After 9 wk of the high-fat diet, the average liver weight of klotho−/− mice was 0.54 ± 0.01 g, and the liver weight of klotho−/− mice fed the normal-fat diet for a similar period was 0.51 ± 0.03 g (Fig. 9, right panel).
Figure 9.
Analysis of liver in high-fat-fed mice. Left panels: microscopic features of liver sections prepared from WT and klotho−/− mice fed normal-fat diet (NFD) and high-fat diet (HFD) for ∼9 wk, showing abnormal fat accumulation (arrows) in liver of HFD-fed WT mice. No such features of hepatic fat accumulation are seen in liver sections prepared from klotho−/− mice fed HFD (H&E staining, ×40). Right panel: liver weight chart for NFD- and HFD-fed WT and klotho−/− mice, showing increased liver weight in WT mice fed HFD but not in klotho−/− mice fed HFD. *P < 0.05 vs. WT (NFD); #P<0.001 vs. WT (NFD); ¶P<0.01 vs. WT (HFD).
DISCUSSION
Earlier in vitro studies have shown adipogenesis-promoting effects of klotho (2) and that ablating klotho function from mice resulted in the generation of a lean mouse with barely detectable fat tissues (5, 7). Whether klotho can influence the genesis of obesity is not yet clear. We have utilized two complementary approaches to determine the in vivo effects of klotho in obesity. The first is the genetic approach of generating ob/ob-klotho DKO mice by ablating klotho function from leptin-deficient (ob/ob) obese mice. The second is the dietary approach of providing a high-fat diet to klotho-knockout mice. Compared to the ob/ob mice, eliminating klotho function from ob/ob mice resulted in a significant reduction of fat accumulation in the DKO mice. Ablating klotho function from ob/ob mice not only reduced body weight because of less abdominal fat accumulation but also suppressed fatty changes of the liver. This decreased body weight, and the improvement in liver structures also affected glucose metabolism.
Hepatic glucose synthesis is an important contributor to systemic glucose metabolism. Our ob/ob-klotho DKO mice showed a significant improvement in liver structures compared to the ob/ob mice, with the effect of reduced blood glucose levels. Of relevance, the klotho-knockout mice are slightly hypoglycemic because of increased insulin sensitivity (18), whereas ob/ob mice are hyperglycemic because of insulin resistance (19). The klotho mutant mice showed reduced blood glucose levels compared to WT mice. Notably, the insulin content of the pancreas of klotho mutant mice was also significantly less than that of WT mice (18). Studies have found that the trend of lower blood glucose levels despite decreased insulin production in the klotho mutant mice was associated with increased insulin sensitivity; insulin tolerance tests showed that glucose levels following insulin injection were reduced more markedly in klotho mutants than in WT mice (18). It appears obvious from our genetic studies that the ob/ob-klotho DKO phenotype is similar to the klotho-knockout phenotype, both in terms of glucose and lipid homeostasis. Such a markedly improved phenotype of DKO mice is likely to be mediated by increased insulin sensitivity and reduced adipogenesis. Of particular importance, ob/ob-klotho DKO mice achieved reduced obesity and improved glucose metabolism in comparison to the ob/ob mice, despite the fact that both groups consumed almost comparable amounts of food.
We then tested the effects of feeding a high-fat diet to klotho-knockout mice and have determined specific changes in body weight and fat accumulation, along with morphological changes of the liver (12, 20, 21). Remarkably, there was no body weight gain during high-fat-diet feeding compared with normal-fat-diet-fed klotho-knockout mice; that is, klotho-knockout mice did not present with dietary fat-induced obesity. In contrast, WT mice fed the high-fat diet gained body weight compared to the WT mice fed the normal-fat diet. It appears likely that klotho-knockout mice are resistant to high-fat-diet-induced obesity.
While we observed a clear increase in hepatic fat cell accumulation in the high-fat-diet-fed WT mice, we did not find such fatty changes in the liver of klotho-knockout mice fed with high-fat diet for a similar period. Consistent with the histological observations, the liver weight of high-fat-diet-fed klotho-knockout mice was similar to the liver weight of normal-fat-diet-fed klotho-knockout mice, whereas the liver weight of WT mice increased following high-fat diet consumption, compared to WT mice fed the normal-fat diet. This observation is consistent with our genetic studies that showed reduced liver weight in ob/ob-klotho DKO mice, compared to the livers of ob/ob mice of a similar age.
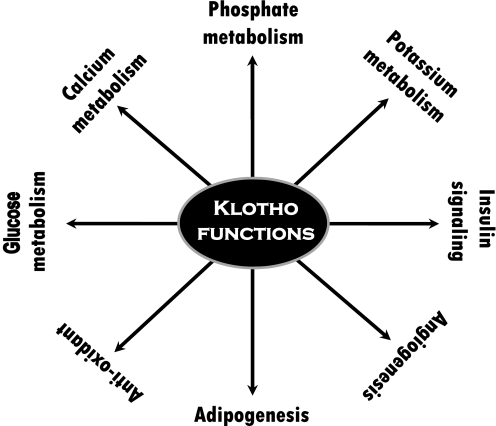
The in vivo mechanism by which klotho can influence obesity requires further investigation. Recent studies have found that PPAR-γ, a master transcription factor in adipocyte differentiation, can induce the expression of klotho (22); PPAR-γ agonists (thiazolidinediones) or adenovirus-mediated overexpression of PPAR-γ have been shown to increase klotho expression in mouse kidneys, whereas PPAR-γ antagonists can reduce such expression in mice (22). In fact, a noncanonical PPAR-responsive element is detected within the 5′-flanking region of the human klotho gene, and promoter–reporter assays showed it to be functionally active, suggesting that klotho is a target gene of PPAR-γ (22). Furthermore, studies have also shown that klotho has the ability to promote adipocyte differentiation by activating C/EPBα, a transcription factor that governs many aspects of adipocyte differentiation (2). Although these findings suggest that klotho may ensure effective execution of the adipocyte transcription program (2, 22), they do raise fundamental questions about its in vivo implication in obesity. The relatively lean phenotype of our generated ob/ob mice without klotho activity, as compared to the obese phenotype of ob/ob mice, clearly suggest that reducing klotho activity may delay adipogenesis and diminish fat accumulation in DKO mice. Of particular importance, despite restricted and sparse expression of klotho, both human and experimental studies have shown that klotho can exert numerous important functions, ranging from ion metabolism to signaling mediators and organogenesis (Fig. 10; refs. 2, 23–29).
Figure 10.
Partial list of the functions of klotho, as documented in various human and/or experimental studies (2, 18, 24, 27–29, 33–39).
One other issue that will require further study is determining the effects of vitamin D in altered adipogenesis and glucose metabolism in ob/ob-klotho DKO mice, as both ob/ob and klotho single-knockout mice have increased renal expression of 1-α-hydroxylase [1α(OH)ase] with a concomitant increase in serum levels of 1,25-hydroxyvitamin-D (Supplemental Fig. S7; refs. 30–32). Of relevance, our preliminary studies suggest that genetically eliminating vitamin D activities from ob/ob mice did not influence obesity in ob/ob-1α(OH)ase DKO mice (Supplemental Fig. 8), suggesting that vitamin D might not be a major determinant of obesity in ob/ob mice.
In summary, our dietary and genetic manipulation studies demonstrate that klotho is an important mediator of glucose metabolism, obesity, and hepatic steatosis, particularly in mice lacking leptin activities. Additional studies are needed to determine the intrinsic and extrinsic effects of klotho in adipogenesis and whether membranous and/or circulating form of klotho can directly influence fat cell turnover. Detailed studies to determine the molecular interactions between klotho and adipogenic factors could provide important insights into the pathobiology of obesity and associated complications, including metabolic syndrome.
Supplementary Material
Acknowledgments
Part of the research is supported by grant R01-DK077276 to M.S.R. from the U.S. National Institutes of Health (National Institute of Diabetes and Digestive and Kidney Diseases).
Footnotes
This article includes supplemental data. Please visit http://www.fasebj.org to obtain this information.
REFERENCES
- 1. Li S. A., Watanabe M., Yamada H., Nagai A., Kinuta M., Takei K. (2004) Immunohistochemical localization of klotho protein in brain, kidney, and reproductive organs of mice. Cell Struct. Funct. 29, 91–99 [DOI] [PubMed] [Google Scholar]
- 2. Chihara Y., Rakugi H., Ishikawa K., Ikushima M., Maekawa Y., Ohta J., Kida I., Ogihara T. (2006) Klotho protein promotes adipocyte differentiation. Endocrinology 147, 3835–3842 [DOI] [PubMed] [Google Scholar]
- 3. Nabeshima Y. (2002) Klotho: a fundamental regulator of aging. Ageing Res. Rev. 1, 627–638 [DOI] [PubMed] [Google Scholar]
- 4. Nakatani T., Ohnishi M., Razzaque M. S. (2009) Inactivation of klotho function induces hyperphosphatemia even in presence of high serum fibroblast growth factor 23 levels in a genetically engineered hypophosphatemic (Hyp) mouse model. FASEB J. 23, 3702–3711 [DOI] [PMC free article] [PubMed] [Google Scholar]
- 5. Kuro-o M., Matsumura Y., Aizawa H., Kawaguchi H., Suga T., Utsugi T., Ohyama Y., Kurabayashi M., Kaname T., Kume E., Iwasaki H., Iida A., Shiraki-Iida T., Nishikawa S., Nagai R., Nabeshima Y. I. (1997) Mutation of the mouse klotho gene leads to a syndrome resembling ageing. Nature 390, 45–51 [DOI] [PubMed] [Google Scholar]
- 6. Nakatani T., Bara S., Ohnishi M., Densmore M. J., Taguchi T., Goetz R., Mohammadi M., Lanske B., Razzaque M. S. (2009) In vivo genetic evidence of klotho-dependent functions of FGF23 in regulation of systemic phosphate homeostasis. FASEB J. 23, 433–441 [DOI] [PMC free article] [PubMed] [Google Scholar]
- 7. Ohnishi M., Nakatani T., Lanske B., Razzaque M. S. (2009) Reversal of mineral ion homeostasis and soft-tissue calcification of klotho knockout mice by deletion of vitamin D 1alpha-hydroxylase. Kidney Int. 75, 1166–1172 [DOI] [PMC free article] [PubMed] [Google Scholar]
- 8. Moon B. C., Friedman J. M. (1997) The molecular basis of the obese mutation in ob2J mice. Genomics 42, 152–156 [DOI] [PubMed] [Google Scholar]
- 9. Friedman J. M., Halaas J. L. (1998) Leptin and the regulation of body weight in mammals. Nature 395, 763–770 [DOI] [PubMed] [Google Scholar]
- 10. Kamohara S., Burcelin R., Halaas J. L., Friedman J. M., Charron M. J. (1997) Acute stimulation of glucose metabolism in mice by leptin treatment. Nature 389, 374–377 [DOI] [PubMed] [Google Scholar]
- 11. Sato M., Kawakami T., Kondoh M., Takiguchi M., Kadota Y., Himeno S., Suzuki S. (2010) Development of high-fat-diet-induced obesity in female metallothionein-null mice. FASEB J. 24, 2375–2384 [DOI] [PubMed] [Google Scholar]
- 12. Tozuka Y., Wada E., Wada K. (2009) Diet-induced obesity in female mice leads to peroxidized lipid accumulations and impairment of hippocampal neurogenesis during the early life of their offspring. FASEB J. 23, 1920–1934 [DOI] [PubMed] [Google Scholar]
- 13. Ohnishi M., Razzaque M. S. (2010) Dietary and genetic evidence for phosphate toxicity accelerating mammalian aging. FASEB J. 24, 3562–3571 [DOI] [PMC free article] [PubMed] [Google Scholar]
- 14. Zha Y., Le V. T., Higami Y., Shimokawa I., Taguchi T., Razzaque M. S. (2006) Life-long suppression of growth hormone-insulin-like growth factor I activity in genetically altered rats could prevent age-related renal damage. Endocrinology 147, 5690–5698 [DOI] [PubMed] [Google Scholar]
- 15. Razzaque M. S., Sitara D., Taguchi T., St-Arnaud R., Lanske B. (2006) Premature ageing-like phenotype in fibroblast growth factor 23 null mice is a vitamin-D mediated process. FASEB J. 20, 720–722 [DOI] [PMC free article] [PubMed] [Google Scholar]
- 16. Flicker L., McCaul K. A., Hankey G. J., Jamrozik K., Brown W. J., Byles J. E., Almeida O. P. (2010) Body mass index and survival in men and women aged 70 to 75. J. Am. Geriatr. Soc. 58, 234–241 [DOI] [PubMed] [Google Scholar]
- 17. Zadravec D., Brolinson A., Fisher R. M., Carneheim C., Csikasz R. I., Bertrand-Michel J., Borén J., Guillou H., Rudling M., Jacobsson A. (2010) Ablation of the very-long-chain fatty acid elongase ELOVL3 in mice leads to constrained lipid storage and resistance to diet-induced obesity. FASEB J. 24, 4366–4377 [DOI] [PubMed] [Google Scholar]
- 18. Utsugi T., Ohno T., Ohyama Y., Uchiyama T., Saito Y., Matsumura Y., Aizawa H., Itoh H., Kurabayashi M., Kawazu S., Tomono S., Oka Y., Suga T., Kuro-o M., Nabeshima Y., Nagai R. (2000) Decreased insulin production and increased insulin sensitivity in the klotho mutant mouse, a novel animal model for human aging. Metabolism 49, 1118–1123 [DOI] [PubMed] [Google Scholar]
- 19. Haluzik M., Colombo C., Gavrilova O., Chua S., Wolf N., Chen M., Stannard B., Dietz K. R., Le Roith D., Reitman M. L. (2004) Genetic background (C57BL/6J versus FVB/N) strongly influences the severity of diabetes and insulin resistance in ob/ob mice. Endocrinology 145, 3258–3264 [DOI] [PubMed] [Google Scholar]
- 20. Cioffi F., Zambad S. P., Chhipa L., Senese R., Busiello R. A., Tuli D., Munshi S., Moreno M., Lombardi A., Gupta R. C., Chauthaiwale V., Dutt C., de Lange P., Silvestri E., Lanni A., Goglia F. (2010) TRC150094, a novel functional analog of iodothyronines, reduces adiposity by increasing energy expenditure and fatty acid oxidation in rats receiving a high-fat diet. FASEB J. 24, 3451–3461 [DOI] [PubMed] [Google Scholar]
- 21. Rabot S., Membrez M., Bruneau A., Gérard P., Harach T., Moser M., Raymond F., Mansourian R., Chou C. J. (2010) Germ-free C57BL/6J mice are resistant to high-fat-diet-induced insulin resistance and have altered cholesterol metabolism. FASEB J. 24, 4948–4959 [DOI] [PubMed] [Google Scholar]
- 22. Zhang H., Li Y., Fan Y., Wu J., Zhao B., Guan Y., Chien S., Wang N. (2008) Klotho is a target gene of PPAR-gamma. Kidney Int. 74, 732–739 [DOI] [PubMed] [Google Scholar]
- 23. Razzaque M. S. (2009) The FGF23-Klotho axis: endocrine regulation of phosphate homeostasis. Nat. Rev. Endocrinol. 5, 611–619 [DOI] [PMC free article] [PubMed] [Google Scholar]
- 24. Saito Y., Yamagishi T., Nakamura T., Ohyama Y., Aizawa H., Suga T., Matsumura Y., Masuda H., Kurabayashi M., Kuro-o M., Nabeshima Y., Nagai R. (1998) Klotho protein protects against endothelial dysfunction. Biochem. Biophys. Res. Commun. 248, 324–329 [DOI] [PubMed] [Google Scholar]
- 25. Kawaguchi H., Manabe N., Miyaura C., Chikuda H., Nakamura K., Kuro-o M. (1999) Independent impairment of osteoblast and osteoclast differentiation in klotho mouse exhibiting low-turnover osteopenia. J. Clin. Invest. 104, 229–237 [DOI] [PMC free article] [PubMed] [Google Scholar]
- 26. Razzaque M. S. (2011) Phosphate toxicity: new insights into an old problem. Clin. Sci. (Lond.) 120, 91–97 [DOI] [PMC free article] [PubMed] [Google Scholar]
- 27. Yamagishi T., Saito Y., Nakamura T., Takeda S., Kanai H., Sumino H., Kuro-o M., Nabeshima Y., Kurabayashi M., Nagai R. (2001) Troglitazone improves endothelial function and augments renal klotho mRNA expression in Otsuka Long-Evans Tokushima fatty (OLETF) rats with multiple atherogenic risk factors. Hypertens. Res. 24, 705–709 [DOI] [PubMed] [Google Scholar]
- 28. Yamamoto M., Clark J. D., Pastor J. V., Gurnani P., Nandi A., Kurosu H., Miyoshi M., Ogawa Y., Castrillon D. H., Rosenblatt K. P., Kuro-o M. (2005) Regulation of oxidative stress by the anti-aging hormone klotho. J. Biol. Chem. 280, 38029–38034 [DOI] [PMC free article] [PubMed] [Google Scholar]
- 29. Saito Y., Nakamura T., Ohyama Y., Suzuki T., Iida A., Shiraki-Iida T., Kuro-o M., Nabeshima Y., Kurabayashi M., Nagai R. (2000) In vivo klotho gene delivery protects against endothelial dysfunction in multiple risk factor syndrome. Biochem. Biophys. Res. Commun. 276, 767–772 [DOI] [PubMed] [Google Scholar]
- 30. Ohnishi M., Nakatani T., Lanske B., Razzaque M. S. (2009) In vivo genetic evidence for suppressing vascular and soft-tissue calcification through the reduction of serum phosphate levels, even in the presence of high serum calcium and 1,25-dihydroxyvitamin d levels. Circ. Cardiovasc. Genet. 2, 583–590 [DOI] [PMC free article] [PubMed] [Google Scholar]
- 31. Razzaque M. S. (2011) The dualistic role of vitamin D in vascular calcifications. [E-pub ahead of print] Kidney Int. doi: 10.1038/ki.2010.432 [DOI] [PMC free article] [PubMed] [Google Scholar]
- 32. Matsunuma A., Kawane T., Maeda T., Hamada S., Horiuchi N. (2004) Leptin corrects increased gene expression of renal 25-hydroxyvitamin D3–1 alpha-hydroxylase and -24-hydroxylase in leptin-deficient, ob/ob mice. Endocrinology 145, 1367–1375 [DOI] [PubMed] [Google Scholar]
- 33. Mori K., Yahata K., Mukoyama M., Suganami T., Makino H., Nagae T., Masuzaki H., Ogawa Y., Sugawara A., Nabeshima Y., Nakao K. (2000) Disruption of klotho gene causes an abnormal energy homeostasis in mice. Biochem. Biophys. Res. Commun. 278, 665–670 [DOI] [PubMed] [Google Scholar]
- 34. Nagai R., Saito Y., Ohyama Y., Aizawa H., Suga T., Nakamura T., Kurabayashi M., Kuroo M. (2000) Endothelial dysfunction in the klotho mouse and downregulation of klotho gene expression in various animal models of vascular and metabolic diseases. Cell. Mol. Life Sci. 57, 738–746 [DOI] [PMC free article] [PubMed] [Google Scholar]
- 35. Mizuno I., Takahashi Y., Okimura Y., Kaji H., Chihara K. (2001) Upregulation of the klotho gene expression by thyroid hormone and during adipose differentiation in 3T3–L1 adipocytes. Life Sci. 68, 2917–2923 [DOI] [PubMed] [Google Scholar]
- 36. Razzaque M. S. (2011) Osteo-renal regulation of systemic phosphate metabolism. [E-pub ahead of print] IUBMB Life doi: 10.1002/iub.437 [DOI] [PMC free article] [PubMed] [Google Scholar]
- 37. Chang Q., Hoefs S., van der Kemp A. W., Topala C. N., Bindels R. J., Hoenderop J. G. (2005) The beta-glucuronidase klotho hydrolyzes and activates the TRPV5 channel. Science 310, 490–493 [DOI] [PubMed] [Google Scholar]
- 38. Razzaque M. S. (2009) FGF23-mediated regulation of systemic phosphate homeostasis: is klotho an essential player? Am. J. Physiol. Renal Physiol. 296, F470–F476 [DOI] [PMC free article] [PubMed] [Google Scholar]
- 39. Cha S. K., Hu M. C., Kurosu H., Kuro-o M., Moe O., Huang C. L. (2009) Regulation of renal outer medullary potassium channel and renal K+ excretion by klotho. Mol. Pharmacol. 76, 38–46 [DOI] [PMC free article] [PubMed] [Google Scholar]
Associated Data
This section collects any data citations, data availability statements, or supplementary materials included in this article.


