Abstract
Using a classical simulation protocol for nonlinear optical signals, we predict the two-dimensional (2D) spectra of water near a monolayer of [1,2-dimytristoyl-sn-glycero-3-phosphatidylcholine] (DMPC) generated by three infrared and one visible probe pulses. Sum frequency generation 1D spectra show two peaks of the OH stretch representing two environments of near-bulk water non-adjacent to DMPC and top-layer water adjacent to DMPC. These peaks create a 2D pattern in the fourth-order signal. The asymmetric cross-peak pattern with respect to the diagonal line suggests coherence transfer from the higher to the lower frequency modes. The nodal lines in the imaginary part of the 2D spectrum show that the near-bulk water has fast spectral diffusion, resembling bulk water despite the orientation by the strong electrostatic field of DMPC. The top-layer water has slower spectral diffusion.
Interfacial water plays an essential role in the stabilization and functionality of membranes and of proteins attached to membranes. Since the cell membrane of living organisms consists primarily of phospholipid bilayers, the water/phospholipid monolayer interface is a good model system for studying the water-membrane interactions. A ~10Å layer of water is oriented by the strong electrostatic interactions with the lipid.1 Vibrational spectra of interfacial water are distinct from bulk water. A single ~3400cm−1 OH stretch in the infrared (IR) spectra of bulk water is split into two peaks at 3100-3300cm−1 (L, lower) and 3300-3500cm−1 (H, higher) in the second-order sum-frequency generation (SFG) spectra.2 Time-resolved SFG experiments revealed that the dynamics was different as well; the H-peak exhibited longer relaxation time (~600fs) than bulk (~200fs).3 Our recent molecular dynamics (MD) simulation of the SFG spectra at the water/[1,2-dimytristoyl-sn-glycero-3-phosphatidylcholine] (DMPC) interface has shown that the L- and H-peaks originate from the OH stretches of near-bulk water non-adjacent to DMPC and the top-layer water adjacent to DMPC, respectively.4 An important open issue is how fast do the configurations of the interfacial water vary. A good experimentally accessible indicator for ultrafast configuration change is provided by the fluctuations of frequencies (spectral diffusion). Spectral diffusion probes the surrounding molecular structures and local dynamics of water at lipid and biological interfaces. Even though both the top-layer and the near-bulk water are oriented to the DMPC layer by the strong electrostatic interactions with the hydrophilic part of DMPC, it is not clear whether their dynamics is heterogeneous.
Water heterogeneity near DMPC has been examined by two-color pump-probe IR and two-dimensional (2D) IR experiments in low-hydrated DMPC5 and DNA;6 water attached to DMPC was found to be more heterogeneous than bulk. Since low-hydrated DMPC does not have bulk water, the top-layer water adjacent to DMPC is dominant and the near-bulk water connecting the top-layer water with bulk is not oberseved.5 At higher levels of hydration, the interfacial contribution is masked by the bulk contribution in odd-order optical signals. Thus, probing spectral diffusion of interfacial water requires even-order interface-specific 2D techniques. Second-order 2D IR-IR surface-specific spectroscopy which had two time delays analogous to 2D Raman spectroscopy7 has been proposed.8,9 An alternative 2D surface-specific spectroscopy uses the fourth-order IR-IR-IR-visible (IIIV)10 pulse configuration shown schematically in Figure 1. This technique has three time delays, as in 2D IR spectroscopy.11 Since the IIIV signal is in the visible region, its detection is easier than the second-order IR-IR signal.
Figure 1.
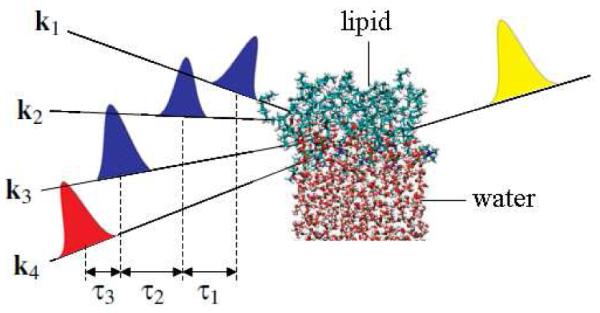
The fourth-order IR-IR-IR-visible experiment. The blue, red, and yellow pulses represent the IR, visible, and detection pulses. k1, k2, k3, and k4 are their wavevectors, and τ1, τ2, and τ3 represent the delays between pulses.
Here we examine the spectral diffusion of interfacial water near DMPC by a simulation study of the IIIV signal. This is the first reported simulation of the fourth-order IIIV signal. The marriage of homodyne-detected fourth-order spectroscopy technique10 with heterodyne-detected SFG12 should make the proposed heterodyne-detected fourth-order spectroscopy possible in the near future. MD trajectories are used to compute the classical optical response. Our main findings are an asymmetric cross peak pattern in the 2D spectra representing coherence transfer, a steep nodal slope for the H-mode indicating slow spectral diffusion of top-layer water, and a shallow nodal slope for the L-mode indicating fast spectral diffusion of near-bulk water. The gradient of the nodal slope of the L-mode indicates that the spectral diffusion of near-bulk water is as fast as bulk water, even though the near-bulk water is oriented to DMPC unlike bulk water.
A system consists of 8 DMPC and 462 water molecules. Details of the MD simulation protocols are given in the supporting information. The classical approximation holds when the vibrational frequency is low compared to kT or for weakly anharmonic vibrations at any temperature, where T is the system temperature. The OH stretch is weakly anharmonic, which makes the classical protocol adequate for the present application. The merits of this approach are given in the supporting information. The fourth-order IIIV response function was calculated classically using the stability matrix formalism13,14
| (1) |
where β=1/kT, T=300K, t3=τ3+τ2/2, t2=τ2/2, t1=−τ2/2, t0=−τ1–τ2/2, and a, b, c, d, e represent the pulse polarization directions. τ1, τ2, and τ3 are the delays between pulses (Figure 1). M(t) and A(t) are the total dipole moment and the total polarizability of the entire system at time t, and {…} is the Poisson bracket. Calculation details for M(t) and A(t) are given in the supporting information.
In all simulations, we have set the waiting time (τ2) to zero. Variation of the signal with τ2 should reveal directly vibrational relaxation. This goes beyond the present study. The time-domain fourth-order response function, , is displayed in Figure 2(a). The signal decays in ~80fs along the τ3 axis. To suppress the small fluctuations at long τ3 and τ1, we employed the window function9,14
| (2) |
where , tc1=112.5fs, and tc2=150fs. The smoothed response function is compared with the bare response function in Figure 2(b).
Figure 2.
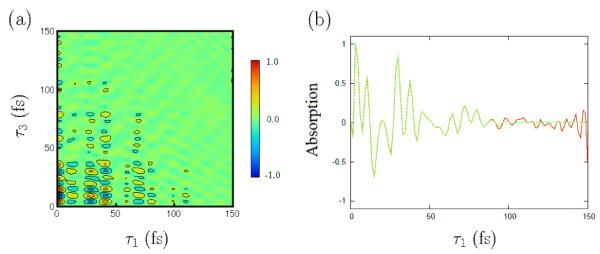
(a) Time-domain 2D response function . (b) Diagonal elements of time-domain 2D response function. Red and green lines represent bare and smoothed , respectively.
The frequency-domain 2D spectra were obtained by the double Fourier transform of the time-domain response function
| (3) |
includes all possible Liouville space pathways that contribute to different signals. Denoting the wavevectors of the IR pulses by k1, k2, and k3 and that of the visible pulse by k4, we have the rephasing signal at kI=−k1+k2+k3+k4, the non-rephasing signal at kII=k1−k2+k3+k4, and the double quantum coherence signal at kIII=k1+k2−k3+k4. In this study, we focus on the kI signal, which appears in the region of ω1<0 and ω3>0. The kII and kIII signals are easily separated since they appear in the region of ω1>0 and ω3>0.
The vibrational energy level diagram for the water OH stretch at the DMPC interface is presented in Figure 3. ∣g> is the ground state and the singly excited L- and H-states are denoted as ∣e1> and ∣e2>, while the doubly excited states of the L- and H-modes and the combination state are denoted as ∣f1>, ∣f2>, and ∣f3>. The three Liouvilles space pathways contributing to the kI signal are shown in Figure 4. Peaks corresponding to diagrams A and B have opposite signs compared to diagram C in . When the frequency shifts of doubly excited states or combination state are zero, these opposite sign contributions exactly cancel as in 2D IR spectra. The information on the molecular orientation contained in shows up also in : Peaks corresponding to diagram A and B in have opposite signs than in .
Figure 3.
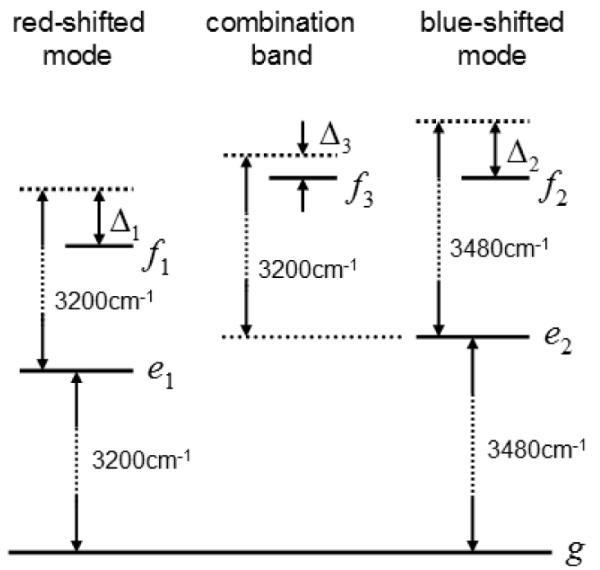
Energy level scheme for water OH stretch at the DMPC interface. State g, e, and f represent the ground, one-exciton, and two-exciton states. Δ1, Δ2, and Δ3 denote the frequency shifts of the two exciton states.
Figure 4.
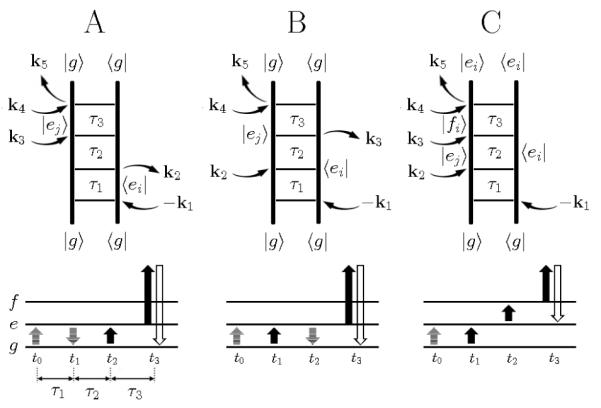
Top panels; Feynman diagrams for the fourth-order IIIV signal at kI=−k1+k2+k3+k4. Bottom panels; energy level scheme. The transition of the bra and ket are drawn in solid and shadowed arrows. The detection pulse is denoted by the open arrows.
The frequency-domain 2D spectra, and , are displayed in Figure 5(a) and (b), respectrively. In Figure 5(a), the H-peak is on the diagonal line −ω1=ω3, whereas the L-peak appears in the −ω1>ω3 region. In addition, both signals show weak cross peaks in the −ω1>ω3 region (marked by asterisks), but no cross peak in the −ω1<ω3 region.
Figure 5.
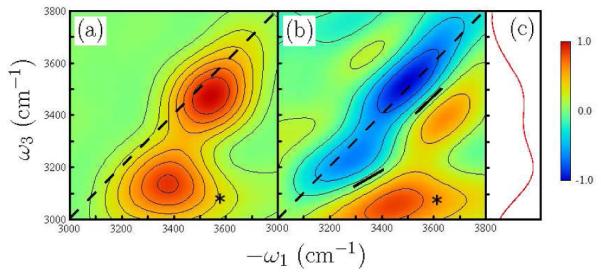
(a) Simulated fourth-order spectra in the direction kI=−k1+k2+k3+k4, and (b) . The cross peaks are marked by asterisks (*). The black solid lines represent the nodal lines between negative and positive peaks. The angles between the nodal lines and the ω1 axis are 29° for the L-mode and 44° for the H-mode. The frequencies of the L- and H-mode are 3480cm−1 and 3200cm−1 (c) SFG spectrum .
The diagonal peaks in Figure 5(b) show that the frequency shifts were Δ1=180cm−1 for the L-mode and Δ2=150cm−1 for the H-mode. These are close to the frequency shift of 153cm−1 due to the intramolecular anharmonicity of water OH stretch.15 The peaks overlap, since Δ1 and Δ2 are comparable with frequency splitting of the L- and H-peaks of Δω=280cm−1. In particular, the positive peak of the H-mode and the negative peak of the L-mode cancel out, because the latter peak is elongated along the ω1 axis as schematically illustrated in Figure 6. This cancellation weakens the negative peak of the L-mode and shifts the peak in to the −ω1>ω3 region.
Figure 6.
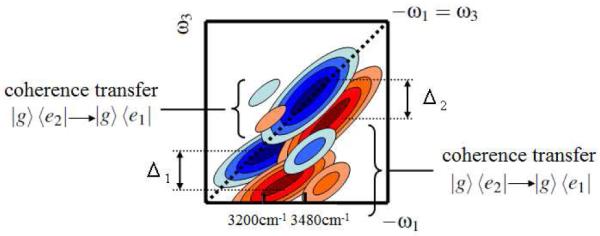
Schematic 2D spectrum for which helps the peak assignment. Coherence transfer from ∣g><e2∣ to ∣g><e1∣ is responsible for the triangular cross peak in the −ω1>ω3 region, while coherence transfer from ∣g><e1∣ to ∣g><e2∣ causes cross peak in the −ω1<ω3 region.
We next turn to the cross peaks. There are two possible origins for the cross peaks. One is the frequency shift for the combination band of the L- and H-modes. If the L- and H-modes are coupled and this shifts the combination mode to the lower frequency by Δ3, the cross peaks appear in both the −ω1>ω3 and −ω1<ω3 regions with the same intensities. The absence of a cross peak in the −ω1<ω3 region means that the direct intermode coupling is weak compared with the intramolecular anharmonicity and Δ3<<Δ1≈Δ2. Cross peaks can also originate from coherence transfer from ∣g><e2∣ to ∣g><e1∣ and from ∣g><e1∣ to ∣g><e2∣ during τ1 and τ3. The Δω=280cm−1 energy splitting of the L- and H-modes indicates that the transition from ∣g><e2∣ to ∣g><e1∣ is exp(ℏΔω/ kT) ≈ 3.8 times faster than the transition from ∣g><e1∣ to ∣g><e2∣. Coherence transfer from ∣g><e2∣ to ∣g><e1∣ creates the cross peak in the −ω1>ω3 region, while the cross peak in the −ω1<ω3 region arises from the transition from ∣g><e1∣ to ∣g><e2∣. Thus, both and show a cross peak in the −ω1>ω3 region, while the cross peak in the −ω1<ω3 region is weak and is not clearly observed, as illustrated in Figure 6.
Spectral diffusion of water at the DMPC interface can be inferred from the angle between the nodal lines and the ω1 axis in Figure 5(b); the nodal line parallel to the diagonal indicates slow spectral diffusion compared with the decay time of the signal of ~80fs, while the nodal line parallel to the ω1 axis indicates fast spectral diffusion.16 In Figure 5, the angles are 29° for the L-mode and 44° for the H-mode. Since the H-mode was assigned to the top-layer OH stretch adjacent to DMPC,4 we conclude that this OH stretch has slow spectral diffusion due to the strong electrostatic interactions between water and the hydrophilic part of DMPC. The heterogeneous nature of water at DMPC with low hydration was also reported by Volkov et al..5 Figure 5(b) also shows that the L-mode has a shallow nodal slope compared with the H-mode, indicating that the near-bulk OH stretch non-adjacent to DMPC has faster spectral diffusion than the OH stretch adjacent to DMPC. The angle of 29° in is compatible with 30°±5° in 2D IR spectrum of bulk water.17 This means that the interfacial water corresponding to the L-mode changes the frequency of its OH stretch rapidly due to the ultrafast conformational change at the similar speed as bulk water. The near-bulk water non-adjacent to DMPC is oriented to DMPC unlike bulk water. Nevertheless the water dynamics is similar in both cases.
In conclusion, we have reported the first simulation study of the 2D fourth-order IIIV rephrasing kI=k1–k2+k3+k4 signal at the water/DMPC interface. Both simulated signals, and , show a cross peak in the −ω1>ω3 region and no cross peak in the −ω1<ω3 region, indicating coherence transfer from the H- to L-modes. shows that the L-mode has a shallower nodal slope than the H-mode and the gradient of the nodal line for the L-mode is similar to that of the bulk water in 2D IR spectra. These indicate that the H- and L-modes have fast and slow spectral diffusion, respectively. By using the peak assignments of the H- and L-modes in our previous work,4 we can conclude that the near-bulk water non-adjacent to DMPC has faster spectral diffusion than the top-layer water adjacent to DMPC and its spectral diffusion timescale is similar to bulk water.
Supplementary Material
ACKNOWLEDGMENT
This work was supported by the National Institute of Health (Grant No. GM-59230) and the National Science Foundation (Grant No. CHE-0745892).
Footnotes
SUPPORTING INFORMATION AVAILABLE: The derivation of the classical response function for the fourth-order signal, the protocols for the MD simulation and the calculation of the optical response, and the simulated SFG spectra are included in the supporting information. This material is available free of charge via the internet at http://pubs.acs.org.
REFERENCES
- (1).Egberts E, Marrink SJ, Berendsen HJC. Eur. Biophys. J. 1994;22:423–436. doi: 10.1007/BF00180163. [DOI] [PubMed] [Google Scholar]
- (2) (a).Mondal JA, Nihonyanagi S, Yamaguchi S, Tahara T. J. Am. Chem. Soc. 2010;132:10656. doi: 10.1021/ja104327t. [DOI] [PubMed] [Google Scholar]; (b) Chen XK, Hua W, Huang ZS, Allen HC. J. Am. Chem. Soc. 2010;132:11336–11342. doi: 10.1021/ja1048237. [DOI] [PubMed] [Google Scholar]
- (3) (a).Ghosh A, Smits M, Bredenbeck J, Bonn M. J. Am. Chem. Soc. 2007;129:9608. doi: 10.1021/ja073130h. [DOI] [PubMed] [Google Scholar]; (b) Ghosh A, Smits M, Sovago M, Bredenbeck J, Bonn M. Chem. Phys. Lett. 2008;350:23–30. [Google Scholar]
- (4).Nagata Y, Mukamel S. J. Am. Chem. Soc. 2010;132:6434–6442. doi: 10.1021/ja100508n. [DOI] [PMC free article] [PubMed] [Google Scholar]
- (5) (a).Volkov VV, Palmer DJ, Righini R. J. Phys. Chem. B. 2007;111:1377–1382. doi: 10.1021/jp065886t. [DOI] [PubMed] [Google Scholar]; (b) Volkov VV, Palmer DJ, Righini R. Phys. Rev. Lett. 2007;99:078302. doi: 10.1103/PhysRevLett.99.078302. [DOI] [PubMed] [Google Scholar]; (c) Volkov VV, Kataoka Y, Righini R. J. Phys. Chem. B. 2009;113:4119–4124. doi: 10.1021/jp806650c. [DOI] [PubMed] [Google Scholar]
- (6).Szyc L, Yang M, Nibbering ETJ, Elsaesser T. Angew. Chem. In. Ed. 2010;49:3598–3610. doi: 10.1002/anie.200905693. [DOI] [PubMed] [Google Scholar]
- (7).Tanimura Y, Mukamel S. J. Chem. Phys. 1993;99:9496–9511. [Google Scholar]
- (8).Cho M. J. Chem. Phys. 2000;112:9978–9985. [Google Scholar]
- (9).Nagata Y, Tanimura Y, Mukamel S. J. Chem. Phys. 2007;126:204703. doi: 10.1063/1.2727445. [DOI] [PubMed] [Google Scholar]
- (10) (a).Bredenbeck J, Ghosh A, Smits M, Bonn M. J. Am. Chem. Soc. 2008;130:2152. doi: 10.1021/ja710099c. [DOI] [PubMed] [Google Scholar]; (b) Bredenbeck J, Ghosh A, Nienhuys HK, Bonn M. Acc. Chem. Res. 2010;42:1332–1342. doi: 10.1021/ar900016c. [DOI] [PubMed] [Google Scholar]
- (11).Mukamel S, Abramavicious D. Chem. Rev. 2004;104:2073–2098. doi: 10.1021/cr020681b. [DOI] [PubMed] [Google Scholar]
- (12) (a).Stiopkin IV, Jayathilake HD, Bordenyuk AN, Benderskii AV. J. Am. Chem. Soc. 2008;130:2271–2275. doi: 10.1021/ja076708w. [DOI] [PubMed] [Google Scholar]; (b) Nihonyanagi S, Yamaguchi S, Tahara T. J. Chem. Phys. 2009;130:204704. doi: 10.1063/1.3135147. [DOI] [PubMed] [Google Scholar]
- (13) (a).Mukamel S, Khidekel V, Chernyak V. Phys. Rev. E. 1996;53:R1–R4. doi: 10.1103/physreve.53.r1. [DOI] [PubMed] [Google Scholar]; (b) Saito S, Ohmine I. J. Chem. Phys. 1998;108:240–251. [Google Scholar]
- (14).Jeon J, Cho M. New J. Phys. 2010;12:065001. [Google Scholar]
- (15).Hayashi T, Jansen T. l. C., Zhuang W, Mukamel S. J. Phys. Chem. A. 2005;109:64–82. doi: 10.1021/jp046685x. [DOI] [PubMed] [Google Scholar]
- (16).Roberts ST, Ramasesha K, Tokmakoff A. Acc. Chem. Res. 2009;42:1239–1249. doi: 10.1021/ar900088g. [DOI] [PubMed] [Google Scholar]
- (17) (a).Asbury JB, Steinel T, Stromberg C, Corcelli SA, Lawrence CP, Skinner JL, Fayer MD. J. Phys. Chem. A. 2004;108:1107–1119. doi: 10.1063/1.1803532. [DOI] [PMC free article] [PubMed] [Google Scholar]; (b) Eaves JD, Loparo JJ, Fecko CJ, Roberts ST, Tokmakoff A, Geissler PL. Proc. Natl. Acad. Sci. 2005;102:13019–13022. doi: 10.1073/pnas.0505125102. [DOI] [PMC free article] [PubMed] [Google Scholar]; (c) Jansen T. l. C., Auer BM, Yang M, Skinner JL. J. Chem. Phys. 2010;132:224503. doi: 10.1063/1.3454733. [DOI] [PubMed] [Google Scholar]
Associated Data
This section collects any data citations, data availability statements, or supplementary materials included in this article.


