

Abstract
Background
Recognition of the risks associated with alcohol intoxication and driver distraction has led to a wealth of simulated driving research aimed at studying the adverse effects of each of these factors. Research on driving has moved beyond the individual, separate examination of these factors to the examination of potential interactions between alcohol intoxication and driver distraction. In many driving situations, distractions are commonplace and might have little or no disruptive influence on primary driving functions. Yet, such distractions might become disruptive to a driver who is intoxicated.
Methods
The present study examined the interactive impairing effects of alcohol intoxication and driver distraction on simulated driving performance in 40 young adult drivers using a divided attention task as a distracter activity. The interactive influence of alcohol and distraction was tested by having drivers perform the driving task under four different conditions: 0.65 g/kg alcohol; 0.65 g/kg alcohol + divided attention; placebo; and placebo + divided attention.
Results
As hypothesized, divided attention had no impairing effect on driving performance in sober drivers. However, under alcohol, divided attention exacerbated the impairing effects of alcohol on driving precision.
Conclusions
Alcohol and distraction continue to be appropriate targets for research into ways to reduce the rates of driving-related fatalities and injuries. Greater consideration of how alcohol and distraction interact to impair aspects of driving performance can further efforts to create prevention and intervention measures to protect drivers, particularly young adults.
Keywords: Alcohol, Distraction, Divided Attention, Driving
1. Introduction
Research examining how alcohol impairs driving performance is an important step in the process of preventing future crashes. In the United States, an average of one alcohol-related fatality occurs every 30 minutes (NHTSA, 2002). Automobile crash reports have shown that up to 40% of fatal crashes in the United States involve alcohol (Evans, 2004). As blood alcohol levels increase, the likelihood of a fatal traffic crash also increases (Zador et al., 2000). Younger drivers constitute a higher percentage of alcohol-related crashes than any other age group. Drivers under 20 years of age have a 5-fold increase in average risk of alcohol-related crash when compared with drivers over age 30 (Keall et al., 2004). Understandably, considerable research interest has been devoted to identifying possible factors that could account for this over-representation and much of this research effort has hinged on the assumption that younger drivers are typically at a greater risk because they are less experienced in terms of their driving ability and in terms of their exposure to alcohol (Harrison and Fillmore, 2005a).
The ever-increasing demands on drivers’ attention have also become a focus in driving research. Drivers are often required to divide their attention between tasks associated with driving, such as maintaining lane position and speed, and other tasks, such as engaging with passengers and adjusting dashboard instruments. Of particular concern is the growing number of “technology-based” distractions in the automobile (e.g., cell phone, GPS, and entertainment systems) that compete for driver attention. Such distractions have become one of the main factors leading to traffic crashes (Dingus et al., 2006; Klauer et al., 2006; Lam, 2002).
Recognition of the risks associated with alcohol intoxication and driver distraction has led to a wealth of simulated driving research aimed at studying the adverse effects of each of these factors. Moreover, in recent years driving researchers have moved beyond the individual, separate examinations of these factors to the examination of potential interactions between alcohol intoxication and driver distraction. The examination of such interactions is the purpose of the present study.
Much of the current interest in studying the combined influence of alcohol intoxication and driver distraction is fueled by the ecological relevance of examining the two factors jointly. Alcohol intoxication and driver distraction, separately, are well known factors in car crashes, but also likely co-occur frequently (Brewer and Sandow, 1980). There is also empirical justification for examining the joint effects of alcohol intoxication and distraction on driver performance. Laboratory research has shown that alcohol-induced impairment of simple laboratory tasks can be intensified when the subjects are distracted by a secondary task. Indeed, decades of laboratory studies have shown that among the most sensitive measures of alcohol-induced impairment are tasks that involve divided attention (Fillmore, 2007; Holloway, 1995; Moskowitz and Robinson, 1988).These tasks assess the ability to attend to multiple stimuli, some that are relevant to task goals and some that are irrelevant. Performance in divided attention situations is considered highly vulnerable to the disruptive influence of alcohol and reviews of alcohol studies report some of the lowest threshold blood alcohol concentrations (BACs) for statistical evidence of impairment. For example, Moskowitz and Robinson (1988) found that over half of the studies they reviewed reported impairment on divided attention tasks at BACs below 50 mg/100 ml, with some studies finding impairment as low as 20 mg/100 ml.
Theories to account for this vulnerability center on the assumption that alcohol might reduce the capacity to process information (Fillmore, 2003; Steele and Josephs, 1990). In general, these theories assert that information processing is constrained much like a “bottleneck” in which only one process can be completed at any one time (Pashler, 1994). With respect to alcohol, the theory suggests that alcohol reduces the capacity to process information so that information beyond the capacity limit cannot be processed effectively, leading to slowed or inaccurate responses (Fillmore and Van Selst, 2002). Divided attention tasks are especially vulnerable in this regard because their increased task demands already limit available capacity, making it more likely that task demands will exceed capacity when further constrained by alcohol, and also because the ability to switch attention on divided attention tasks is impaired by alcohol (Holloway, 1995; Moskowitz and Fiorentino, 2000).
With respect to driving performance, some researchers have recently examined the joint influence of alcohol and divided attention in simulated driving scenarios and have shown that the impairing effects of alcohol can be intensified when the driver is required to divide attention among distractor tasks while driving (Rakauskas et al., 2008; Verster et al., 2009). In these studies, the divided attention tasks required volunteers to manipulate vehicular controls in response to visual instructions within the vehicle, to participate in a verbal cognitive test battery (Rakauskas et al. 2008) or to press buttons in response to changes in peripheral visual stimuli (Verster et al., 2009). In these studies it was shown that alcohol and distraction each individually impaired driving performance and that such impairment was increased substantially when alcohol and divided attention were combined.
To date, evidence that divided attention exacerbates the impairing effects of alcohol has been based on highly distracting divided attention tasks that have direct impairing effects on driving performance, even in sober drivers. In line with dual process models of cognition (Shiffrin and Dumais, 1981; Shiffrin and Schneider, 1977), driving researchers have long recognized that aspects of driving can be classified on the basis of reflecting either automatic or controlled modes of cognitive processing (Michon, 1985; Salvucci, 2006). Behaviors governed by automatic processes tend to be well learned actions that require little conscious effort and can be conducted in parallel with other activities. By contrast, controlled actions are effortful, demand greater cognitive resources, and are often disrupted by a secondary activity (Shiffrin and Dumais, 1981). In the context of driving, the ability to maintain lane position by executing minor steering adjustments is often considered to reflect automatic processes, whereas overtaking other vehicles is considered to entail controlled, conscious action on the part of the driver (Michon, 1985).
Such a distinction between automatic and controlled aspects of driving is important when considering the potential disruptive influence of a distraction. In many driving situations, distractions are commonplace and have little or no disruptive influence on the driving performance of sober drivers because they do not disrupt the lower-level, automatic processes. Some aspects of driving routinely require both controlled and automatic aspects of driving. Such situations include attending to changes in traffic conditions while maintaining a steady lane position, adjusting vehicular dials while slowing in response to traffic signals, and being observant of pedestrians who might enter the road while maintaining a safe following distance behind other cars. Sober drivers typically do not exhibit any degradation of impairment on automatic aspects of driving when such distractions are included. Yet, these distractions might become disruptive to a driver who is intoxicated. With reduced information processing capacity from alcohol intoxication (Fillmore, 2003; Steele and Josephs, 1990), it is possible that even automatic aspects of driving could be impaired by distraction. Therefore, it is important to determine if such distractions that alone, are benign, could nonetheless function to exacerbate the behavioral impairment in an intoxicated driver.
The purpose of the present investigation was to examine the interactive impairing effects of alcohol intoxication and driver distraction on simulated driving performance in young adult men and women, using a divided attention task as a distracter activity that does not degrade the driving performance of sober drivers. The interactive influence of alcohol and distraction was tested by having drivers perform the driving task under four different conditions: alcohol; alcohol + divided attention; placebo, and placebo + divided attention. In this study the hypothesis was tested that the disruptive effects of divided attention would be only observed in intoxicated drivers and not in sober drivers. The study used a driving simulation that measured critical aspects of driving precision (e.g., swerving) and indicators of reckless driving behaviors, such as failures to stop at red lights. Speeding was examined as a possible mechanism for the interactive impairment of alcohol and distraction. Past work suggests that the disinhibiting effects of alcohol could exacerbate impairment because drivers are less likely to attempt to compensate for their impairment (Fillmore et al., 2008). One manner in which drivers could compensate for distraction is by reducing their speed, and some research shows that under alcohol, drivers fail to slow down during distracting events (Allen et al., 2009). Therefore, the present study employed a driving scenario that encouraged speeding to determine the extent to which intoxicated drivers might speed despite the presence of distracters. To encourage speeding all drivers were provided monetary reinforcement for their rapid completion of the simulated driving test.
2. Methods
2.1 Participants
Forty (20 women and 20 men) volunteers between the ages of 21 and 35 years (mean age = 24.0 years, SD = 3.8) participated in this study. Volunteers completed questionnaires that provided demographic information, drinking habits, and physical and mental health status. Individuals with a self-reported psychiatric disorder, substance abuse disorder, head trauma, or other CNS injury were excluded from the study. Volunteers with a score of 5 or higher on the Short-Michigan Alcoholism Screening Test (S-MAST) (Selzer et al., 1975) were excluded from the study. The racial makeup of the sample was Caucasian (n=32), African-American (n=5), Asian (n=1), and Other (n=2).
Recent use of amphetamine, barbiturates, benzodiazepines, cocaine, opiates, and tetrahydrocannabinol was assessed by means of urine analysis. Any volunteer who tested positive for the presence of any of these drugs was excluded from participation. No female volunteers who were pregnant or breast-feeding participated in the research, as determined by self-report and urine human chorionic gonadotrophin levels. All participants held a valid driver’s license. All volunteers had been licensed to drive for at least three years, had never had their license revoked, and drove at least twice a week. Participants were recruited via notices posted on community bulletin boards and by classified newspaper advertisements. All volunteers provided informed consent prior to participating. The University of Kentucky Medical Institutional Review Board approved the study, and volunteers received $40 for their participation.
2.2 Apparatus and Materials
2.2.1 Simulated driving task
A computerized driving simulation task was used to measure driving performance (STISIM Drive, Systems Technology Inc., Hawthorne, CA). In a small test room, participants sat in front of the 48 cm [19 inch] computer display that presented the driving simulation. The simulation placed the driver within the cab of the vehicle and provided a view of the roadway and dashboard instruments. Drivers controlled the vehicle by moving a steering wheel and manipulating the accelerator and brake pedals. The drive test was a daylight driving scenario that required participants to drive 9.5 kilometers [5.9 miles] on a busy street in a metropolitan setting. All participants were instructed to “please obey all traffic laws”. Participants drove through twenty intersections equipped with traffic lights. At five of the intersections, the traffic light was red and required the driver to stop until the light turned green. At all other intersections, the light was either green or turned yellow as the vehicle approached and thus did not require the driver to stop. Drivers in the present study were obeying traffic laws if they proceeded through yellow traffic light intersections. No penalties for speeding or running red lights were enforced. Order of the traffic lights was random. Other vehicles were presented on the roadway at random intervals but required no passing or braking on the part of the driver. Crashes, either into another vehicle or off the road, resulted in the presentation and sound of a shattered windshield. The program then reset the driver in the center of their lane at the point of the crash. The drive test required between 5 and 10 minutes to complete, depending on the speed of the driver.
2.2.2 Divided Attention
Volunteers in the divided attention conditions were required to perform a secondary task while driving. Drivers performed a two-choice reaction-time task that was embedded in the drive scenario. Trials consisted of the presentation of an arrow in the upper right or upper left corner of the driver’s window screen. Arrows were presented for 5 seconds. Volunteers were instructed to respond to an arrow by pressing a button on the corresponding side (right or left) of the dashboard. Reaction time and accuracy were recorded. The number of trials was dependent on the speed at which drivers’ completed the scenario and all drivers were presented with at least 31 trials. The task was chosen because it poses minimal demands on the driver and resembles the types of simple visual distractions and accompanying response requirements that are commonplace in driving.
2.2.3 Personal drinking habits questionnaire (Vogel-Sprott, 1992)
This questionnaire yielded three measures of a participant’s current, typical drinking habits: frequency (the number of drinking occasions per week); dose (milliliters of absolute alcohol per kilogram of body weight typically consumed during a single drinking occasion); and duration (time span in hours of a typical drinking occasion).
2.2.4 Self-evaluation of driving impairment
Using a 100 mm visual-analogue scale that ranged from 0 "not at all" to 100 "very much", drivers rated their perceived level of impaired driving. This scale has been used in other alcohol studies of driving (e.g., Harrison and Fillmore, 2005a; Harrison et al., 2007).
2.2.5 Blood alcohol concentrations (BACs)
BACs were determined from breath samples measured by an Intoxilyzer, Model 400 (CMI Inc., Owensboro, KY).
2.3 Procedure
Individuals responded to the advertisements by calling the laboratory to participate in a telephone intake-screening interview conducted by a research assistant. Volunteers were told that the purpose of the experiment was to study the effects of alcohol on driving performance. All sessions were conducted in the Human Behavioral Pharmacology Laboratory of the Department of Psychology and testing began between 10 a.m. and 6 p.m. Prior to the test session, volunteers were required to fast for 4 hours and to abstain from alcohol for 24 hours. At the beginning of each session, body weight was measured, a zero BAC was verified by the Intoxilyzer, and urine samples were tested to verify that participants were negative for recent drug use or pregnancy.
2.3.1 Intake and Familiarization Session
The purpose of the intake session was to familiarize participants with the lab procedures and to obtain information on general demographic information, health status and drug use. Informed consent was given for participation in the research. Participants also performed practice tests to familiarize them with the driving simulator.
2.3.2 Test Session
Volunteers were randomly assigned to one of four groups (n=10): 1) alcohol; 2) alcohol + divided attention; 3) placebo; or 4) placebo + divided attention. Drivers in the divided attention groups were required to perform the secondary task during their baseline and post-beverage drives (alcohol + divided attention; placebo + divided attention). The remaining two groups (alcohol, placebo) drove with no secondary task.
At the beginning of the test session, all drivers completed the simulated driving test. This test served as the sober, baseline measurement of their driving behavior. After this drive, they received either an active dose of alcohol or a placebo. The active dose consisted of 0.65 g/kg absolute alcohol administered as one part alcohol and three parts vehicle. Carbonated lemon-lime flavored soda was used as the vehicle. Beverages were administered in two glasses. The dose was consumed within 8 min. This dose was selected because it produces an average peak BAC of 80 mg/100 ml, approximately 60 min after drinking, and prior research has shown that the dose reliably impairs performance on the driving simulator (e.g., Harrison and Fillmore, 2005a). The placebo consisted of a volume of carbonated lemon-lime flavored soda that matched the total volume of the 0.65 g/kg alcohol drink. A small amount (5 ml) of alcohol was floated on the surface of the beverage. It was served in two glasses that had been sprayed with an alcohol mist that resembled condensation and provided a strong alcoholic scent as the beverages were consumed. The timing of placebo beverage consumption was identical to the active dose.
The post-beverage drive test began at 50 minutes post-drinking to coincide with the ascending period of the blood alcohol curve in the active dose conditions. BACs were measured at 50 and 60 minutes post beverage administration. Participants in the placebo conditions also provided breath samples at those times ostensibly to measure their BAC.
To encourage speeding during the post-beverage drive all drivers were provided monetary reinforcement for quickly completing the drive. Just prior to the drive, the experimenter explained that participants could earn money by completing the trip in the shortest time. Drivers were shown a chart that presented the pay-offs for completing the trip in various time intervals from shortest to longest: $5 for under 5 minutes, $4 for 5–6 minutes, $3 for 6–7 minutes, $2 for 7–8 minutes, $1 for 9–10 minutes, and 50 cents for over 10 minutes. The information about the response requirement for the monetary rewards was provided to participants immediately prior to performing the drive test and participants were informed of the money they earned immediately upon completing the drive test. Receiving the maximum bonus would require failures to stop at all traffic signals.
Immediately after the post-beverage drive, drivers provided self-evaluations of their driving impairment. After the test session concluded the participants relaxed in a waiting room within the laboratory. Participants received a meal and remained at leisure to read magazines or watch television until their BAC fell below 20 mg/100 ml. Transportation home was provided as needed. Upon completing the session, participants were paid and debriefed.
2.4 Criterion Measures
Several measures of driving performance were obtained. The measures were chosen on the basis of their established sensitivity to the disruptive effects of alcohol and speeding as demonstrated in previous research (Harrison and Fillmore, 2005; Harrison et al., 2007; Fillmore et al., 2008).
2.4.1 Driving Precision
Driving precision was measured by the standard deviation of the lateral position. This measure is an indicator of the degree of adjustment that a driver implements to maintain a desired position within the lane. The driver’s lane was 3.7 m [12 ft] wide and the within-lane position of the vehicle was sampled each 0.3 m [foot] of the drive test to yield an average lane position for a drive. Standard Deviation of the Lateral Position (SDLP) was the standard deviation of the driver’s average within-lane position. SDLP is a primary indicator of driving impairment. Greater SDLP indicates poorer vehicle control and the measure has been shown to be a sensitive indicator of alcohol intoxication (Harrison and Fillmore, 2005a; Rakauskas et al.,2008; Shinar et al., 2005).
2.4.2 Driving Speed
The simulator recorded the driver’s average overall speed (kph) during each drive test. This measure was a manipulation check for the monetary reinforcement offered for rapid completion of the post-treatment test and also served to assess whether drivers would reduce their speed to adjust for distraction from the divided attention task.
2.4.3 Reckless driving
Reckless driving was measured as failures to stop at red traffic signals. The simulator recorded when a driver failed to stop at a red traffic signal and the total number of these stopping failures was recorded for each drive test.
2.4.4 Secondary Task Performance
Reaction time and accuracy of drivers’ responses to the arrows were recorded in the two divided attention groups.
2.5 Data Analyses
The effects of alcohol and divided attention on driving precision (standard deviation of the lateral position), speed, and reckless driving (failures to stop at red traffic signals) were analyzed individually by 2 time (baseline vs. post-beverage) X 2 dose (alcohol vs. placebo) X 2 divided attention (divided attention vs. no divided attention) repeated measures analyses of variance (ANOVAs). Planned comparison hypothesis tests were conducted using the mean square error terms of the overall ANOVAs. Self-evaluations of driving impairment were analyzed by a 2 dose (alcohol vs. placebo) X 2 divided attention condition (divided attention vs. no divided attention) between-subjects ANOVA.
3. Results
3.1 Drinking Habits
The sample reported an average drinking frequency of 1.88 times per week (SD = 1.29), and consumed an average typical dose of 0.99 ml/kg (SD = 0.43). Each drinking occasion lasted an average of 3.26 hours (SD = 1.46). One-way ANOVAs of the groups obtained no significant group differences for any measure of drinking habits (ps > .09).
3.2 Blood Alcohol Concentrations
There was no detectable BAC in the placebo conditions. BACs in the alcohol conditions were analyzed by a 2 (divided attention vs. no divided attention) X 2 (time) between-subjects ANOVA. The analysis revealed a significant main effect of time owing to the rise in BAC from 50 to 60 minutes post-drinking, F(1, 19) = 20.3, p < .01. No main effect or interaction involving divided attention was obtained, ps < .65. Thus BAC did not differ between the divided attention and no divided attention conditions. In the no-divided attention condition the mean BACs at 50 and 60 minutes were 0.081% (SD = 0.010%) and 0.09% (SD = 0.010%), respectively. In the divided attention condition the mean BACs for the same time intervals were 0.082% (SD = 0.014%), and 0.090% (SD = 0.015%), respectively.
3.3 Analyses of Driving Performance
Baseline performance on each driving measure was analyzed with 2 (dose) × 2 (divided attention) ANOVAs. No significant group effects were observed (ps > .13). The divided attention required by the secondary task did not impair driving performance prior to alcohol administration. Table 1 presents baseline and post-beverage scores by group for each driving measure.
Table 1.
Baseline and post-beverage mean (SD) scores of simulated driving performance by group (n=10)
| Baseline | Post-Beverage | |
|---|---|---|
| SDLP* (cm) | ||
| Placebo | 26.52 (4.27) | 29.26 (6.71) |
| Placebo + DA* | 25.60 (6.40) | 26.52 (6.71) |
| Alcohol | 27.74 (6.10) | 34.44 (6.10) |
| Alcohol + DA | 29.87 (6.71) | 40.23 (9.14) |
| Stopping Failures | ||
| Placebo | 0.70 (0.82) | 1.60 (1.90) |
| Placebo + DA | 1.00 (1.41) | 1.10 (1.66) |
| Alcohol | 0.70 (1.06) | 2.40 (1.65) |
| Alcohol + DA | 1.60 (1.51) | 2.60 (0.84) |
| Drive Speed (kph) | ||
| Placebo | 63.99 (18.41) | 92.10 (22.55) |
| Placebo + DA | 62.76 (15.55) | 78.84 (24.59) |
| Alcohol | 66.63 (9.98) | 95.33 (20.26) |
| Alcohol + DA | 67.91 (6.90) | 94.24 (14.23) |
SDLP = Standard Deviation of Lane Position, DA = Divided Attention
3.3.2 Driving Precision
A 2 (time) × 2 (dose) × 2 (divided attention) ANOVA of SDLP scores obtained a significant three-way interaction, F(1, 36) = 4.78, p = .04. Figure 1 (left) illustrates the SDLP scores at baseline and following placebo under conditions of divided attention and no divided attention. The figure shows little change in SDLP from baseline to placebo regardless of whether or not drivers were required to divide their attention. These observations were confirmed by a 2 (time) × 2 (divided attention) reduced-model ANOVA of SDLP scores that obtained no significant main effects or interaction between time and divided attention for the placebo groups (ps > .05). Thus under placebo there was no effect of divided attention on driving precision.
Figure 1.
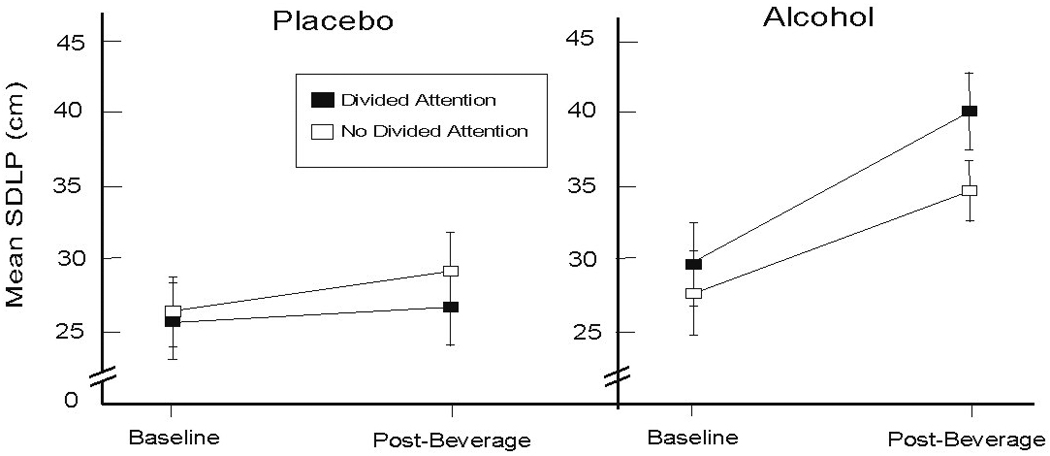
Mean standard deviation of lane position (SDLP) at baseline and post-beverage test in groups driving under conditions of divided attention and no divided attention. Left panel shows groups who received placebo prior to the post-beverage test. Right panel shows groups who received 0.65 g/kg alcohol prior to the post-beverage test. Error bars represent standard error of the mean.
Figure 1 (right) shows the SDLP scores at baseline and following alcohol under conditions of divided attention and no divided attention. The figure shows alcohol impaired driving precision regardless of whether or not drivers were required to divide their attention. Planned comparison t tests revealed significant increases in SDLP from baseline to post-beverage in both conditions, (ps< .05). The figure also shows that impairment was greatest for drivers under the divided attention condition, as shown by a greater increase in their SDLP scores. The observation was supported by a planned comparison t test that revealed significantly greater SDLP at post-beverage for those under divided attention versus no divided attention (t(18 = 1.81, p = .04). Thus divided attention increased the degree of impaired driving precision observed under alcohol.
3.3.3 Driving Speed
A 2 (time) X 2 (dose) X 2 (divided attention) ANOVA of speed obtained a significant main effect of time, F(1,36) = 108.42, p < .01. As expected, Table 1 shows that drivers’ speed increased from baseline to post-beverage. No other main effects or interactions were observed (ps > .14). However, planned comparison tests confirmed the a priori hypothesis that sober drivers would slow their driving in response to distraction, while intoxicated drivers would not. Planned comparison t tests confirmed that under placebo, drivers drove more slowly when required to divide their attention versus when they were not required to divide attention (t(18) = 1.82, p = .04). By contrast, under alcohol, drivers displayed no significant slowing of their speed in response to divided attention (t(18) = 1.10, p = .36).
3.3.4 Reckless Driving
A 2 (time) × 2 (dose) × 2 (divided attention) ANOVA of stopping failures revealed a significant main effect of time, F(1, 36) = 11.01, p < .01. Stopping failures increased from baseline to post-beverage (see Table 1). No interactions or other main effects were obtained. The general increase in stopping failures was likely the result of increased speed during the post-beverage test. Indeed, based on entire sample, the number of stopping failures committed by drivers during post-beverage was positively correlated with their speed, r = 0.83, p < .01.
3.3.5 Vehicular Crashes
These events are infrequent in this type of drive scenario and were extremely rare in the present study. Three crashes were recorded. For most sessions, there were no off-road or other vehicle impacts recorded for any driver, thus precluding any statistical analyses.
3.3.6 Divided Attention Task
The mean number of trials completed in the baseline and post-beverage tests were 49.5 (SD = 1.4) and 48.7 (SD = 4.2), respectively. No effect of dose was observed on reaction time or accuracy measures (ps > .34). The mean (SD) reaction times during the baseline and post-beverage drives were 1.11 (0.20) and 1.08 (0.25) seconds, respectively. Accuracy rates were high, with 96.7 % (SD = 0.1) and 97.6 % (0.1) accuracy during the baseline and post-beverage drives.
3.4 Self-evaluation of driving impairment
A 2 (dose) × 2 (divided attention) ANOVA of drivers’ self-evaluations of their driving impairment obtained a significant main effect of dose, F(1, 36) = 42.85, p < .01. No main effect of divided attention or interaction was obtained (ps > 0.18). The mean ratings of driving impairment for the placebo and alcohol conditions were 23.75 (SD = 14.70) and 57.75 (SD = 18.49), respectively, indicating that those who consumed alcohol rated their driving performance as more impaired.
4. Discussion
The modern driver is faced with a growing number of technological distractions that often require attention to be diverted from driving. At the same time, alcohol consumption is also known to disrupt driving performance. In the present study, the possible interactive relationship between a moderate dose of alcohol and a divided attention task on simulated driving performance was examined. The hypothesis was tested that the combination of alcohol and divided attention would interact to impair driving precision and increase reckless driving. For driving precision, the hypothesis was supported by the results. Alcohol and divided attention interacted to impair driving precision. Drivers who consumed alcohol and performed the divided attention task while driving exhibited the greatest increase in standard deviation of lane position, a measure of swerving.
The findings are consistent with those of prior studies in which the joint influence of alcohol and distraction on simulated driving scenarios was also demonstrated. In these studies, distraction was created using divided attention tasks that independently impaired driving performance (Rakauskas, et al., 2008; Verster et al., 2009). In the present study, the divided attention task was selected specifically to not impair the drivers’ sober performance of lower-level, automatic driving aspects (Michon, 1985). That an interaction of alcohol and divided attention was observed under these conditions provides further evidence that alcohol can reduce the capacity to process information associated with simple automatic behaviors (Fillmore, 2003; Steele and Josephs, 1990), particularly information that would be easily processed when sober.
In the present study, the hypothesis was tested that the interaction between alcohol and divided attention on driving performance could be attributed in part to the degree to which drivers adjusted their performance for the distraction caused by the divided attention task. In past research, it has been suggested that drunk drivers are less likely to compensate for distractions by reducing their driving speed (Allen et al., 2009) in an effort to reduce risk (Taylor, 1964). Reductions in speed provide drivers with additional time to respond to changes in their environment and to maintain greater vehicular control. The hypothesis was supported. In the study, speeding was encouraged. All drivers were provided monetary reinforcement on the post-beverage drive to increase their speed. In the placebo conditions, speeding was reduced divided attention was required. By contrast, under alcohol drivers did not temper their speed regardless of whether or not they were required to divide their attention. Therefore, one possible mechanism underlying the interaction between alcohol and distraction on driving precision could be that drivers in the alcohol + divided attention condition failed to compensate for their increased impairment by reducing their speed. The result was greater swerving (less driving precision) in the alcohol + divided attention group, which could translate to a greater vulnerability to alcohol-related crashes and other negative consequences in real world driving.
In the present study it was also examined whether reckless driving behavior would increase following alcohol, particularly when alcohol was combined with distraction. Reckless driving was measured by failures to stop at red lights in the simulated driving scenario. No significant dose or divided attention effects were observed with this measure. All drivers increased their failures to stop in the post-beverage drive. Increased failures to stop were positively correlated with increased speed, indicating that the monetary reinforcement for speeding in the post-beverage drive encouraged reckless driving and thus likely precluded the observation of significant alcohol and/or divided attention main effects or interactions.
Drivers in the present study self-evaluated their impairment levels following the post-beverage drive. Drivers appraised their driving performance as more impaired following alcohol versus placebo but there was no difference in their performance appraisal in the divided attention versus no divided attention conditions. Thus, it appeared that drivers were adept at detecting alcohol-related impairment, but not in detecting their impairment resulting from the combination of alcohol and distraction. These observations are supported by past research indicating that difficulties in assessing one’s impairment are exacerbated when potential sources of impairment are combined (Harrison and Fillmore, 2005b). The ability to accurately assess how one’s performance is being affected by multiple factors could be a focus of future driver education efforts. As technological advances introduce additional distractions into the vehicle, it will be important for drivers to learn how these multiple factors affect their driving. Educational measures regarding the dangers of driving while distracted remain a priority. The present study used a distraction task that did not impair sober drivers, highlighting the importance of informing drivers of the dangers of combining seemingly benign technological distractions with alcohol consumption.
The present study focused on how alcohol and distraction could disrupt primarily automatic aspects of driving behavior, such as lane keeping (SDLP) (Michon, 1985; Salvucci, 2006). How alcohol and distraction might jointly disrupt more controlled, effortful actions, such as overtaking and lane changing, could be examined in future research. For controlled actions, the combination of alcohol and distraction could produce considerable impairment, given prior observations that controlled processes are more sensitive to alcohol-induced impairment (Holloway, 1995). Another direction for future research would be to examine whether the relationship between alcohol and distraction holds with lower doses of alcohol. Lower doses of alcohol have been proven to result in impaired performance with divided attention tasks (Moskowitz and Robinson, 1988; Holloway, 1995). Moreover, alcohol-related crashes involving young adults often occur below the 80 mg/100 ml limit (Phebo and Dellinger, 1998; SAMHSA, 1999), suggesting that other factors, such as distraction, are involved. In addition to alcohol, the use of other drugs, prescription or illicit, has become a danger on the roads (SAMHSA, 2005). The combination of other drugs, such as central nervous system depressants, and distraction would be another venue of future research. Lastly, in order to measure driving performance at peak BAC, a relatively short driving test was used in the present study. Future research using longer driving tests might observe a greater magnitude of impairment.
In conclusion, the present findings add to a growing body of research indicating that multiple factors can impair driving performance in young adults. The results highlight the importance of understanding potential interactions between distraction and the effects of alcohol and possibly other drugs. In the present study it was demonstrated that the combination of alcohol and distraction interacted to decrease driving precision, and that drivers failed to reduce their speed to compensate for the additional impairment. Given these results, alcohol and distraction continue to be appropriate targets for research into ways to reduce the rates of driving-related fatalities and injuries. Greater consideration of how alcohol and distraction interact to impair aspects of driving performance can further efforts to create prevention and intervention measures to protect drivers, particularly young adults.
Footnotes
Publisher's Disclaimer: This is a PDF file of an unedited manuscript that has been accepted for publication. As a service to our customers we are providing this early version of the manuscript. The manuscript will undergo copyediting, typesetting, and review of the resulting proof before it is published in its final citable form. Please note that during the production process errors may be discovered which could affect the content, and all legal disclaimers that apply to the journal pertain.
References
- Allen AJ, Meda SA, Skudlarski P, Calhoun VD, Astur R, Ruopp KC, Pearlson GD. Effects of alcohol on performance on a distraction task during simulated driving. Alcohol Clin. Exp. Res. 2009;33:617–625. doi: 10.1111/j.1530-0277.2008.00876.x. [DOI] [PMC free article] [PubMed] [Google Scholar]
- Brewer N, Sandow B. Alcohol effects on driver performance under conditions of divided attention. Ergon. 1980;23:185–190. doi: 10.1080/00140138008924733. [DOI] [PubMed] [Google Scholar]
- Evans L. Traffic Safety. Blookfield Hills, MI: Science Serving Society; 2004. [Google Scholar]
- Dingus TA, Klauer SG, Neale VL. The 100-car naturalistic driving study, phase ii – results of the 100-car field experiment. Washington, DC: NHTSA; Technical report no. DOT HS810 593. 2006
- Fillmore MT. Drug abuse as a problem of impaired control; current approaches and findings. Behav. Cogn. Neurosci. Rev. 2003;2:179–197. doi: 10.1177/1534582303257007. [DOI] [PubMed] [Google Scholar]
- Fillmore MT. Acute alcohol-induced impairment of cognitive functions: past and present findings. Int. J. Disabil. Hum. Dev. 2007;6:115–125. [Google Scholar]
- Fillmore MT, Blackburn JS, Harrison ELR. Acute disinhibiting effects of alcohol as a factor in risky driving behavior. Drug Alcohol Depend. 2008;95:97–106. doi: 10.1016/j.drugalcdep.2007.12.018. [DOI] [PMC free article] [PubMed] [Google Scholar]
- Fillmore MT, Roach EL, Rice JT. Does caffeine counteract alcohol-induced impairment? The ironic effects of expectancy. J. Stud. Alcohol. 2002;63:745–754. doi: 10.15288/jsa.2002.63.745. [DOI] [PubMed] [Google Scholar]
- Fillmore MT, Van Selst M. Constraints on information processing under alcohol in the context of response execution and response suppression. Exp. Clin. Psychopharmacol. 2002;10:417–424. doi: 10.1037//1064-1297.10.4.417. [DOI] [PubMed] [Google Scholar]
- Harrison ELR, Fillmore MT. Are bad drivers more impaired by alcohol? Sober driving predicts impairment from alcohol in a simulated driving task. Accid. Anal. Prev. 2005a;37:882–889. doi: 10.1016/j.aap.2005.04.005. [DOI] [PubMed] [Google Scholar]
- Harrison ELR, Fillmore MT. Social drinkers underestimate the additive impairing effects of alcohol and visual degradation on behavioral functioning. Psychopharmacol. 2005b;177:459–464. doi: 10.1007/s00213-004-1964-x. [DOI] [PubMed] [Google Scholar]
- Harrison ELR, Marczinski CA, Fillmore MT. Driver training conditions affect sensitivity to the impairing effects of alcohol on a simulated driving test. Exp. Clin. Psychopharmacol. 2007;15:588–598. doi: 10.1037/1064-1297.15.6.588. [DOI] [PubMed] [Google Scholar]
- Holloway F. Low-dose alcohol effects on human behavior and performance. Alcohol Drugs Driving. 1995;11:39–56. [Google Scholar]
- Keall MD, Frith WJ, Patterson TL. The influence of alcohol, age, and number of passengers on the night-time risk of driver fatal injury in New Zealand. Accid. Anal. Prev. 2004;36:49–62. doi: 10.1016/s0001-4575(02)00114-8. [DOI] [PubMed] [Google Scholar]
- Klauer SG, Dingus TA, Neale VL, Sudweeks JD, Ramsey DJ. The impact of driver inattention on near-crash/crash risk: an analysis using the 100-car naturalistic driving study data. Washington, DC: NHTSA; Technical report no. DOT HS 810594. 2006
- Lam LT. Distractions and the risk of car crash injury: the effect of drivers’ age. J. Safety Res. 2002;33:411–419. doi: 10.1016/s0022-4375(02)00034-8. [DOI] [PubMed] [Google Scholar]
- Michon JA. A Critical View of Driver Behavior Models: What Do We Know, What Should We Do? In: Evans L, Schwing RC, editors. Human Behavior and Traffic Safety. New York: Plenum Press; 1985. pp. 485–520. [Google Scholar]
- Moskowitz H, Fiorentino D. A review of the literature on the effects of low doses of alcohol on driving-related skills. Washington, DC: US Dept Transportation; Technical report no. DOT HS 809 028. 2000
- Moskowitz H, Robinson C. Driving-related skills in impairment at low blood alcohol levels. Alcohol Drugs Traffic Saf. 1988;T86:79–86. [Google Scholar]
- National Highway Traffic Safety Administration (NHTSA) Washington, DC: U.S. Department of Transportation, National Highway Traffic Safety Administration; Traffic Safety Facts 2002: Alcohol. 2002 DOT HS 809 606.
- Pashler H. Dual-task interference in simple tasks: data and theory. Psychologol. Bull. 1994;116:220–244. doi: 10.1037/0033-2909.116.2.220. [DOI] [PubMed] [Google Scholar]
- Phebo L, Dellinger AM. Young driver involvement in fatal motor vehicle crashes and trends in risk behaviors, United States, 1988–95. Inj. Prev. 1998;4:284–287. doi: 10.1136/ip.4.4.284. [DOI] [PMC free article] [PubMed] [Google Scholar]
- Rakauskas ME, Ward NJ, Boer ER, Bernat EM, Cadwallader M, Patrick CJ. Combined effects of alcohol and distraction on driving performance. Accid. Anal. Prev. 2008;40:1742–1749. doi: 10.1016/j.aap.2008.06.009. [DOI] [PubMed] [Google Scholar]
- Salvucci DD. Modeling driver behavior in a cognitive architecture. Hum. Factors. 2006;48:362–380. doi: 10.1518/001872006777724417. [DOI] [PubMed] [Google Scholar]
- Shiffrin RW, Dumais ST. The Development of Automatism. In: Anderson JR, editor. Cognitive Skills and their Acquisition. Hillsdale, NJ: Lawrence Erlbaum Associates; 1981. pp. 111–140. [Google Scholar]
- Shiffrin RM, Schneider W. Controlled and automatic human information processing: II. Perceptual learning, automatic attending, and a general theory. Psychol. Rev. 1977;84:127–190. [Google Scholar]
- Shinar D, Tractinsky N, Compton R. Effects of practice, age, and task demands. Accid. Anal Prev. 2005;37:315–326. doi: 10.1016/j.aap.2004.09.007. [DOI] [PubMed] [Google Scholar]
- Substance Abuse and Mental Health Services Administration (SAMHSA) Impaired driving among youth: trends and tools for prevention. Rockville, MD: Department of Health and Human Services; Technical report no. SMA 99 3364. 1999
- Substance Abuse and Mental Health Services Administration (SAMHSA) Rockville, MD: Department of Health and Human Services; The NSDUH Report: Driving Under the Influence among Adult Drivers. 2005
- Selzer ML, Vinokur A, Van Rooijen L. A self-administered Short Michigan Alcoholism Screening Test (SMAST) J. Stud. Alcohol. 1975;36:117–126. doi: 10.15288/jsa.1975.36.117. [DOI] [PubMed] [Google Scholar]
- Steele CM, Josephs RA. Alcohol myopia: its prized and dangerous effects. Am. Psychol. 1990;45:921–933. doi: 10.1037//0003-066x.45.8.921. [DOI] [PubMed] [Google Scholar]
- Taylor DH. Drivers’ galvanic skin response and the risk of accident. Ergon. 1964;7:439–451. [Google Scholar]
- Verster JC, Wester AE, Goorden M, van Wieringen J, Olivier B, Volkerts ER. Novice drivers’ performance after different alcohol dosages and placebo in the divided-attention steering stimulator (DASS) Psychopharmacol. 2009;204:127–133. doi: 10.1007/s00213-008-1443-x. [DOI] [PubMed] [Google Scholar]
- Vogel-Sprott M. Alcohol Tolerance and Social Drinking: Learning the Consequences. New York: Guilford Press; 1992. [Google Scholar]
- Zador PL, Krawchuk SA, Voas RB. Alcohol related relative risk of driver fatalities and driving involvement in fatal crashes in relation to driver age and gender: an update using the 1996 data. J. Stud. Alcohol. 2000;61:387–395. doi: 10.15288/jsa.2000.61.387. [DOI] [PubMed] [Google Scholar]