Abstract
Recent advances in technology provide support for multi-site, web-based data entry systems and the storage of data in a centralized location, resulting in immediate access to data for investigators, reduced participant burden and human entry error, and improved integrity of clinical trial data. The purpose of this paper is to describe the development of a comprehensive, web-based data management system for a multi-site randomized behavioral intervention trial. Strategies used to create this study-specific data management system included interdisciplinary collaboration, design mapping, feasibility assessments, and input from an advisory board of former patients with characteristics similar to the targeted population. The resulting data management system and development strategies provide a template for other behavioral intervention studies.
Keywords: data management, electronic data capture, graphical user interface
INTRODUCTION
Data management is integral to every clinical trial. For many years, computer technologies including the Internet and the World Wide Web have been used to support the management of data in clinical trials.1, 2 Advances in data collection software, wireless connectivity, and encrypted data transfer allow for multi-site, web-based data entry systems and the storage of data in a centralized location. These structures permit researchers immediate access to data, reduce participant burden and human entry error, and maintain the integrity of clinical trial data. 1, 2
Several studies have demonstrated the value of systems designed for computer or web-based data entry by study participants. Kennedy and colleagues developed an Interactive Data Collection (IDC) tool for measuring risk-taking behaviors in 8- and 9-year-old Anglo and Latino children.3 The system created an interactive environment that appealed to children’s playfulness and imagination, providing visual and audio feedback that encouraged them to remain focused on the task. They found that children preferred the IDC over the paper-and-pencil collection method. Two additional studies directly compared paper-based versus web-based data collection and management. In both studies, investigators found that the web-based system reduced the amount of time needed to code and enter the data, reduced the number of entry errors, and decreased total costs.4, 5
Despite the advances in technology and the increased prevalence of web-based applications, remarkable effort is required to overcome investigators’ reluctance to use and implement such data management systems for healthcare research.1, 2 Some common barriers to implementation of electronic data management systems include: 1) timing of implementation – systems that are created and implemented mid-trial are not as successful as those that are created prior to study implementation; 2) limited user input – without adequate input from the actual users technology-oriented developers cannot design functional, efficient, user-friendly systems; 3) limited or inefficient communication with users – internet-based systems can help users and developers communicate quickly and efficiently to trouble-shoot problems, especially during the initial start-up phase; 4) graphical user interface - systems that are visually unappealing or not intuitive can lead to fatigue, frustration, and rejection of the system.1
Consultation with potential users, including study participants, is important during the design and development phase of the data management system.1 Our study team used several strategies to address common barriers to development and implementation of electronic data management systems. Specific strategies included interdisciplinary collaboration, design mapping, feasibility assessments, and participant input regarding graphical user interface.
The purpose of this paper is to describe procedures and strategies used to develop a comprehensive, web-based data entry, management, and reporting system for a multi-site behavioral intervention trial. The clinical trial for which the system was developed involved data collection at 8 hospitals over 9 discrete time intervals (i.e., 3 major data collections; 6 brief pre-/post-session evaluations). The resulting data management system and development strategies provide a template for other behavioral intervention studies.
DEVELOPMENT PROCEDURES AND STRATEGIES
Study Background
The web-based data management system was designed for a National Institute of Nursing Research and National Cancer Institute funded cooperative group study (Children’s Oncology Group ANUR0631). The multi-site study compares the efficacy of a therapeutic music video (TMV) intervention to a low-dose control group audio books condition for adolescents and young adults (AYA) undergoing stem cell transplant for cancer. Study hypotheses are that the TMV group will have less symptom distress and defensive coping, as well as greater family adaptability/cohesion/communication, positive coping, hope, spiritual perspective, resilience (confidence, self-transcendence, self-esteem), and quality of life compared with the low-dose control group. The 6-session TMV intervention consists of the AYA selecting a song, writing and recording lyrics, and putting pictures with the music to produce and “premiere” a music DVD. Primary outcomes are measured at baseline (pre-transplant), post-intervention (about 2 weeks post-transplant), and 100 days post-transplant. In addition, brief symptom measures of anxiety, mood, fatigue, and pain are obtained prior to and immediately following three of the six intervention sessions. These data, in addition to quality assurance monitoring data, are captured in real time from the 8 participating hospitals using the customized web-based data management system described below.
Data Management System Overview
The data management system for this trial houses all data elements, provides a customized and secure data entry system that supports multiple user roles, facilitates extensive quality assurance mechanisms, schedules and tracks all study activities, reports real-time performance, provides electronic randomization and notification, generates dynamic summary reports and supplies a portal for AYA’s to complete self-report measures while in the hospital. The system assists users during all data collection steps. For example, to register a study participant, the system first guides the user through completion of the Eligibility Criteria, then the Consent Form and finally, if they meet all requirements, the participant can be registered and, after baseline data collection, automatically randomized.
System Development
The required technical support for any behavioral clinical intervention trial is complex. Developing a data management system to support this particular trial demanded a collaborative effort from an interdisciplinary team of researchers and clinicians that included, data managers, biostatisticians, nurses, music therapists, clinical research associates, project managers, and physicians, as well as from members of an advisory board of teens with cancer. Frequent communication and weekly work sessions allowed for extensive design mapping and feasibility assessments.
Data Collection Forms
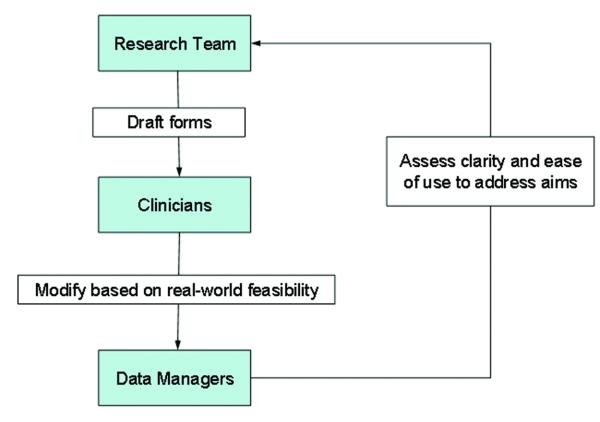
The first objective was to design data collection forms. This iterative process required input from all members of the research team (see Figure 1). The process began with the research team providing data managers with paper-based copies of the established measures as well as drafts of other data collection forms. Data managers then reviewed the specific measures to ensure all items were included, reviewed the other forms to make certain that all items were clear and precise, and reviewed the complete package to confirm that all data necessary to address study aims were included. During this process, the team also identified web-based design features that could be used to improve data collection including the selection of radio buttons or drop down menus, use of skip patterns (i.e., “if you answered yes to item 1 you can skip items 2 – 5”), and visual and audio alerts to inform participants that an item was not completed. With each new draft, the researchers, clinicians and data collectors were asked to use the forms to assess feasibility, clarity and usability.
Figure 1.
Process of Designing Data Collection Forms
User Interface
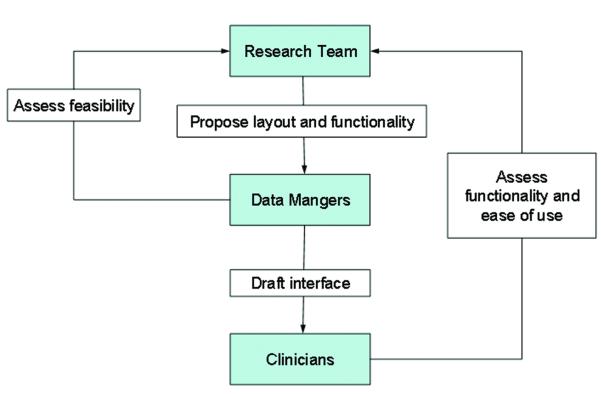
The second objective was to develop the user interface. User interface refers to the graphical, textual and auditory information the program presents to the user and user-required actions to enter information into the data management system. Figure 2 depicts the iterative process that was used to create an intuitive system that would accommodate a wide range of study-specific tasks (i.e., recruitment, enrollment, randomization, evaluation measures, quality assurance monitoring) and users (i.e., study participants, evaluators, data managers, statisticians, project managers, and investigators).
Figure 2.
Process of Developing the User Interface
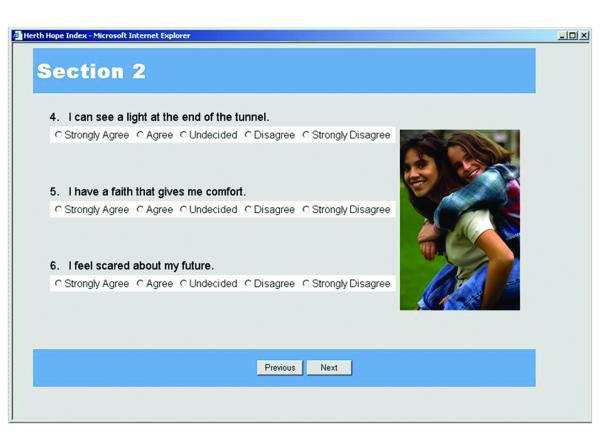
The process began by proposing a layout for each area of the data collection, for example participant questionnaire screens (see Figure 3). During this process, the research team added visual graphics, arranged text, and selected auditory alerts to indicate the completion of measurement sections, missed items, and scheduled breaks. Audio alerts are an important design feature because they allow evaluators to unobtrusively monitor study participant progress during the evaluation sessions.
Figure 3.
Participant Questionnaire
Once drafts for content and design were created, the research team met with data managers, programmers, clinicians, and AYA with cancer to assess functionality and ease of use. Suggested modifications were discussed weighing the benefits and costs of implementation. It is important to note that changes to one area or feature of the system would often necessitate changes to other areas. This cycle was repeated until targeted users agreed that the system was functional and user-friendly. The process of soliciting actual user-input during the development stage resulted in a user-friendly system that could address the unique needs of varied professionals working on the study.
Database Services and Security
The Division of Biostatistics provided the computer support and systems to house this data management system. A dedicated machine running Windows 2003 Server operating system offered extranet web hosting with redundancy and fault tolerance. Study data was stored on a separate database server running Microsoft SQL Server 2000 where server-side scripting concealed the data storage location. All machines had a disaster recovery plan that included nightly backups with copies stored off site. A multi-layered security schema was employed to ensure the confidentiality of study participants and their data. Operating systems and applications were promptly updated when patches become available. Port blocking and Internet Protocol filters limited network access and 128-bit SSL encryption ensured the privacy of data exchanged between the web server and its clients. Study data continue to be securely archived and will be stored indefinitely.
System Design Challenges
Specific challenges encountered and addressed while designing the data management system for this trial included: 1) access and security for multiple users, 2) multi-site communication, and 3) user burden.
Access and Security for Multiple Users
One of the most difficult obstacles was designing a system to accommodate all users from around the country with varying degrees of computer knowledge and diverse requirements for system access. Each user was assigned a specific role that carried differing levels of permissions and access to the data management system (Table 1). For example, the project manager who was responsible for reporting adverse events (AEs) and the screening, consenting, and scheduling of participants would have full (read, write, and modify) access to the Enrollment, AE, and Scheduling modules but only read access to the other modules. There are eight different types of users and some study personnel require multiple roles because they have multiple study responsibilities. Each user was given a unique User ID and password for accessing the data management system. Users external to the core site at Indiana University required additional security measures which were not easily programmable in the web application development tool, ASP that was initially selected. Midway through the development process, programmers were compelled to switch to ASP.NET 2.0, which provided more security features such as encryption functions for password creation and distribution, as well as procedures to prevent impersonation that are not readily available in ASP.
Table 1.
System Access
| User | Data Management System Module | ||||||
|---|---|---|---|---|---|---|---|
| Participant Questionnai res |
Enrollment | Intervention field notes & self QA |
Intervention Monitor QA |
Evaluation field notes & self QA |
Evaluation Monitor QA |
AE & Scheduling |
|
| Core Team | Read | Read | Read | Read | Read | Read | Full* |
|
Project
Manager |
Read | Full | Read | Read | Read | Read | Full* |
| Interventionist | None | None | Full | Read | None | None | Full* |
| Site PI | Read | Read | Read | Read | Read | Read | Full* |
| Evaluator | Full | Full | None | None | Full | Read | Full* |
|
Intervention
Monitor |
None | None | Read | Full | None | None | Full* |
|
Evaluation
Monitor |
None | None | None | None | Read | Full | Read |
| AYA | Full | None | None | None | None | None | None |
Modifiable by creator only
Multi-site Communication
Multiple data collection centers presented several problems, one of which had to do with the automatic e-mail notification of a participant’s group randomization. When the study registration process is complete, the system automatically randomizes participants to either the music video or the audio books group. This randomization needed to be done in real time, with immediate notification to the correct study personnel. The team decided that e-mail would be the fastest and most secure method but sending e-mails to off-campus users proved to be difficult. Indiana University Information Technology Services provided an override to the university’s default security policies and expanded permissions in order to automate external e-mailing.
User Burden
In order to gain successful buy-in from study participants, the graphical user interface needed to be appealing to them. Participants in the study were undergoing stem cell transplantation and as such were often experiencing high symptom distress related to their treatment. In addition, the self-administered instruments used to capture the primary outcomes are quite lengthy and some AYA can take over an hour to complete each wave. Every effort had to be made to reduce fatigue and keep AYAs interested. Therefore, culturally diverse photographs, animated graphics, and sound bites were added for visual stimulation and to offer congratulations and encouragement to complete the data collection process.
As a further test of the appeal and ease of use of the system, members of a Teen Advisory Board, made up of adolescent and young adult cancer survivors from one of the member institutions, were asked to review the online data collection tool. The advisory board members expressed positive feedback for the tool but encouraged the use of all bright colors in the background and pictures on each page. These teens, having experienced hospitalizations for cancer treatment, felt that pictures on each page promoted a “non-test” feel that would be especially important for the AYA. They also felt that bright colors were more appropriate for the AYA and promoted positive feelings.
System Features
With input from the entire research team the data management staff was able to create a customized comprehensive data management system for this complex behavioral clinical trial. During the 10-month process of designing, developing, and testing, the team met weekly to review progress, assess feasibility among the multiple disciplines, and discuss problems. We describe three system features: 1) participant questionnaires, 2) user-specific menus, and 3) dynamic reports. See Figures 3 through 5 for corresponding examples of web-pages.
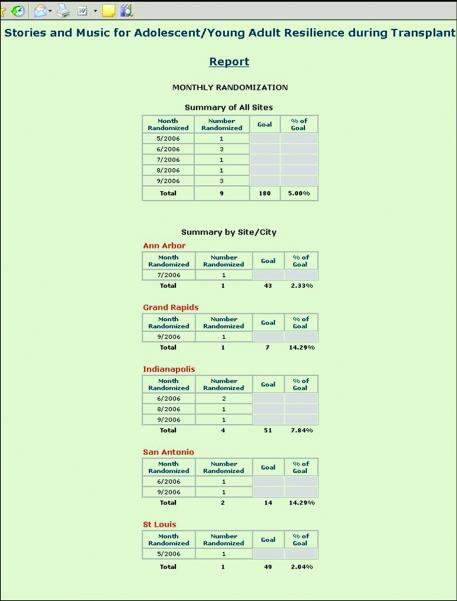
Figure 5.
Sample of Real-Time Report: Recruitment Report
Participant Questionnaires
Figure 3 depicts a screenshot of the AYA participant questionnaire. Each different measure is numbered as a section, and is denoted by a separate color in order to avert boredom. The AYA has the ability to review previous items for the current session only and cannot view data from any previous data collection sessions. The system automatically saves data and incorporates a time-out security measure in case the computer is left idle for too long. In order to have as complete data as possible, at the end of each section, the system alerts the user (and the evaluator, by sound) if any items have been skipped and encourages the user to return to those items to complete them.
User-Specific Menus
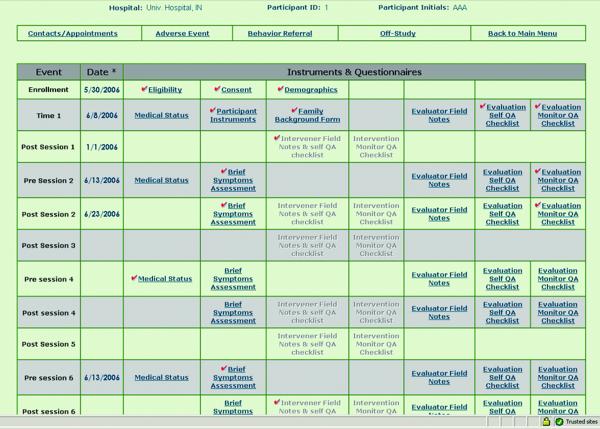
Figure 4 shows a portion of the participant menu as it would be seen by an evaluator. Form links are provided only to users who are authorized to access them; the rest are grayed-out. Since evaluators are blinded to the randomization status of the participant, this example shows no access to the intervention modules. The user-specific menus also include links to self-assessment and quality assurance monitor assessment forms for all scheduled evaluation contacts.
Figure 4.
Face Page for Entry to Study Activities by Participant. User’s Role Determines Access
Dynamic Reports
Figure 5 shows the Monthly Randomization Report as one example of the dynamic reports that can be generated by authorized users from the web application at any time. This gives researchers immediate access to the most up-to-date recruitment and goal achievement data. Other reports display retention rates, frequency of discontinuation reasons, timelines of all scheduled evaluation and intervention activities, and current schedule of events for each hospital site individually and collectively for the study as a whole.
PROCESS AND OUTCOME EVALUATION
Even after study enrollment began, the need for system maintenance continued due to revision of data collection forms, general system enhancements, and additional reporting and scheduling needs. Because the live data management system could not be interrupted for testing and training of new staff, a second system was established to replicate the live data management system and allow for further development and testing. Study personnel and participants have responded positively to this web-based data management system. Researchers find that the system is easier and much faster for participants to use than a previously used paper-based system, suggesting that it also reduces participants’ burden and fatigue. Because the instruments are self-administered and self-entered, the participants are afforded more privacy than with the traditional paper-based questionnaire method. The reliability and completeness of data are increased because erroneous data entry is significantly reduced by eliminating the traditional practice of transferring data from paper measures to an electronic database. Additionally, builtin quality control methods restrict field ranges and values which further prevent entry of erroneous data.
Computerized data collection provides the researchers with maximum control over and protection of their data. Data integrity, defined as the completeness and accuracy of data, and compliance with the Health Insurance Portability and Accountability Act (HIPAA) are ensured via the computerized data management system. Incomplete or inconsistent data is flagged at the point of entry and missing data reports are generated to improve quality. Access to electronic protected health information is restricted to authorized personnel via authentication. Real-time entry, dynamic reporting, and automated e-mail messages enhance the oversight and advance the progression of the entire study. In addition, the core administrative team has a means of efficiently tracking and communicating across all sites as well as immediate access to intervention delivery and evaluation processes for quality assurance.
It is possible to overcome researchers’ reluctance to move from paper-based data collection systems to implementation of a powerful, comprehensive web-based data management system that meets the needs of the research team, study participants, data managers, and developers alike. This data management system and the process of development provide a template for future studies.
Acknowledgements
The project described was supported by National Institutes of Health-National Institute of Nursing Research R01NR008583; and by the National Cancer Institute U10 CA098543 and U10 CA095861.This manuscript was also supported by the second author’s institutional post-doctoral fellowship, CA117865-O1A1.
Footnotes
This is a PDF file of an unedited manuscript that has been accepted for publication. As a service to our customers we are providing this early version of the manuscript. The manuscript will undergo copyediting, typesetting, and review of the resulting proof before it is published in its final citable form. Please note that during the production process errors may be discovered which could affect the content, and all legal disclaimers that apply to the journal pertain.
Contributor Information
Beverly S. Musick, Indiana University School of Medicine Division of Biostatistics.
Sheri L. Robb, Indiana University School of Nursing.
Debra S. Burns, Purdue School of Engineering and Technology @ IUPUI Department of Music and Arts Technology.
Kristin Stegenga, Children’s Mercy Hospitals and Clinics.
Ming Yan, Indiana University School of Medicine Division of Biostatistics.
Kathy J. McCorkle, Indiana University School of Nursing.
Joan E. Haase, Indiana University School of Nursing.
References
- 1.Welker JA. Implementation of electronic data capture systems: barriers and solutions. Contemporary Clinical Trials. 2007 May;28(3):329–336. doi: 10.1016/j.cct.2007.01.001. [DOI] [PubMed] [Google Scholar]
- 2.Marks RG. Validating electronic source data in clinical trials. Controlled Clinical Trials. 2004 Oct;25(5):437–446. doi: 10.1016/j.cct.2004.07.001. [DOI] [PubMed] [Google Scholar]
- 3.Kennedy C, Charlesworth A, Chen JL. Interactive data collection: benefits of integrating new media into pediatric research. Computers, Informatics, Nursing: CIN. 2003 May-Jun;21(3):120–127. doi: 10.1097/00024665-200305000-00007. [DOI] [PubMed] [Google Scholar]
- 4.Rivera ML, Donnelly J, Parry BA, et al. Prospective, randomized evaluation of a personal digital assistant-based research tool in the emergency department. BMC Medical Informatics & Decision Making. 2008;8:3. doi: 10.1186/1472-6947-8-3. [DOI] [PMC free article] [PubMed] [Google Scholar]
- 5.Weber BA, Yarandi H, Rowe MA, Weber JP. A comparison study: paper-based versus web-based data collection and management. Applied Nursing Research: ANR. 2005 Aug;18(3):182–185. doi: 10.1016/j.apnr.2004.11.003. [DOI] [PubMed] [Google Scholar]


