

Abstract
Red blood cells (RBC) play an important role in the balance between generation and scavenging of nitric oxide (NO) and hence its local bioavailability and influence on vasomotor control. Previous studies have reported increased NO levels in RBC suspensions subsequent to exposure to shear forces; the present study was designed to further investigate changes in intracellular NO concentration and possible mechanisms involved for RBC exposed to well-controlled shear forces. Attached human RBC were subjected to shear stresses up to 0.1 Pa in a parallel-plate flow channel; fluorescent methods were used to monitor changes in intracellular NO and calcium concentrations. Intracellular NO concentration, estimated by the fluorescence level of 4-amino-5-methylamino-2′,7′-difluorofluorescein diacetate (DAF-FM), increased sharply within 30 s following the application of shear stress between 0.013 to 0.1 Pa. This increase was only partially prevented by the absence of L-arginine and by the presence of L-N-acetyl-methyl-arginine (L-NAME), strongly suggesting that this response was in part related to the activation of NO-synthase (NOS) enzyme. The increase in intracellular NO concentration under shear stress was also inhibited by calcium chelation in the suspending medium, indicating the role of calcium entry for NOS activation. Increases of intracellular calcium concentrations under the same shearing conditions were demonstrated by monitoring Fluo-3/AM fluorescence in RBC exposed to shear stress. Serine 1177 phosphorylated NOS protein, the activated form of the enzyme determined by immunohistochemistry, was found to be significantly increased following the exposure of RBC to 0.1 Pa shear stress for 1 min. These data confirm that RBC possess a NOS enzyme that is actively synthesizing NO and activated by effective shear forces. The data also suggest that there may be additional (e.g., non-enzymatic) NO generating mechanisms in RBC that are also enhanced under shear stress.
Keywords: nitric oxide synthase, erythrocyte, shear stress, activation, intracellular calcium
Introduction
An important role has been attributed to red blood cells (RBC) in the critical balance between the generation and scavenging of nitric oxide (NO) which determines its local bioavailability and influences vasomotor control [1; 2]. Earlier concepts were mainly based on the very potent NO scavenging ability of hemoglobin [1; 3], while further reports introduced RBC as a source of NO [4-6]. Hemoglobin is thus central to mechanisms affecting NO release from RBC such as: 1) binding of NO to oxyhemoglobin in the form of S-nitrosohemoglobin with NO released when hemoglobin is deoxygenated in tissues with lower oxygen partial pressure [4; 7]; 2) reduction of nitrite by hemoglobin [8]. Additionally, enzymatic mechanisms actively synthesizing NO using L-arginine as substrate were found to exist in RBC [9].
Kleinbongard et al. studied the properties of RBC NO synthase (NOS) in detail and reported the following features [9]: 1) RBC NOS is immunoreactive with endothelial NOS (eNOS), but not with inducible (iNOS) or neuronal (nNOS) isoforms. RBC NOS is mainly located on the cytoplasmic leaflet of RBC membrane. 2) RBC NOS uses L-arginine as substrate to generate NO and L-citrulin with the activity dependent on the availability of L-arginine. 3) RBC NOS has a comparable activity to eNOS (0.3 pmol/pg/min versus 0.7 pmol/pg/min, respectively as determined by the rate of conversion of L-arginine to L-citrulin in cultured human umbilical vein endothelial cells (HUVEC). 4) RBC NOS activity is controlled by phosphorylation of the protein at various sites (e.g., phosphorylation at serine at the position 1177 enhances activity). 5) RBC NOS activity is inhibited by non-specific NOS inhibitors. 6) Extracellular calcium plays an important role in the regulation of RCB NOS activity. These features thus indicate a close similarity between RBC NOS and eNOS.
NO generation in RBC has been demonstrated to be influenced by various factors ex vivo, including insulin [9] and acetylcholine [10]. Based on the similarities to eNOS, RBC NOS was hypothesized to be regulated by shear forces affecting RBC [11; 12]. Fischer et al. demonstrated that immunostaining specific to eNOS in RBC was enhanced in blood samples obtained following exposure to extracorporeal circulation during cardiac surgery [13]. Ulker et al. exposed RBC to 2 Pa shear stress by continuous pumping of suspensions through a 1.2 mm diameter glass tube [14]. Immunostaning specific to serine-1177 phosphorylated eNOS was significantly enhanced after 15 minutes of pumping, while non-phosphorylated eNOS immunostaining remained unchanged. NO concentrations measured by an electrochemical probe in RBC suspensions were also enhanced following the exposure of RBC to 2 Pa shear stress [14]. Increased NO concentration in RBC suspensions filtered through 5 μm pores also provided evidence for role of shear forces in the regulation of NO-generating mechanisms of RBC [15].
The present study was designed to further evaluate the hypothesized role of shear forces in the regulation of RBC NO-synthesizing activity. RBC were exposed to well-defined shear stresses in a flow channel while intracellular NO and calcium concentrations were monitored using appropriate fluorescent probes.
Experimental procedures
Blood samples and preparation of red blood cell suspensions
Venous blood samples were obtained from healthy human male volunteers and anticoagulated with sodium heparin (15 IU/ml). Sampling protocols were approved by local ethical committees and performed following oral informed consent of the volunteers. Leukocytes were removed by centrifuging 4 ml of blood through 2 ml of polysucrose (60 g/l) and sodium diatrizoate (167 g/l) solution (Histopaque 1119, Sigma Chemical Co., St. Louis, MO, USA) in a 10 ml polypropylene tube at 700 g for 30 min. The RBC pellet was washed three times with calcium- and magnesium-free phosphate buffered saline (PBS, 290 mOsm/kg, pH = 7.4). All procedures were conducted at room temperature (20 ± 2 °C), unless otherwise indicated.
RBC suspensions used for monitoring changes in intracellular NO concentration were prepared using washed RBC re-suspended in PBS at a hematocrit of 0.01 l/l. The suspensions were incubated at 37 °C with 4 μM 4-amino-5-methylamino-2′,7′-difluorofluorescein diacetate (DAF-FM DA) for 60 min, then washed three times with PBS following which they were re-suspended in PBS and incubated for 30 min to allow de-esterification of DAF-FM. L-arginine (1 mM) was added to the suspensions prior to the last incubation step (i.e., 30 min de-esterification) unless otherwise stated. For some experiments L-N-acetyl-methyl-arginine (L-NAME, 1 mM) was added to the L-arginine containing suspensions. Based upon the nature of the experimental protocol, calcium chloride (1 mM) or ethylenediaminetetraacetic acid (EDTA, 4 mM) were also added to the PBS used for washing and re-suspending RBC.
RBC used for monitoring intracellular calcium changes in response to shear stress were washed with a HEPES buffer (125 mmol/l NaCl, 3 mmol/L KCl, 1 mmol/l MgCl 2, 2 mmol/l CaCl2, 16 mmol/l HEPES, 1.2 mmol/l sodium phosphate, and 10 mmol/l glucose, pH 7.4) then re-suspended in this buffer at a hematocrit of 0.002%. Fluo-3/AM (F1241, Invitrogen, Carlsbad CA, USA) dissolved at 2 mM in dimethyl sulfoxide was added to the RBC suspensions to obtain 3 μM and the suspensions incubated with mild shaking for 1 hour at 37 °C. RBC were washed three times with PBS following the incubation period and then re-suspended in PBS at 0.01 l/l hematocrit.
Exposure of red blood cells to shear stress
RBC were exposed to various levels of shear stress in a rectangular flow chamber (Glycotech Co, Gaithersburg, MD, USA) having a 25×75 mm cover slip as the bottom surface (Figure 1). A 0.25 mm thick silicone rubber gasket separated the acrylic body of the chamber from the cover slip and a rectangular cutout area of the gasket formed the flow channel. The cover slip was firmly affixed by applying a continuous vacuum to special holes near the outer edges of the gasket. The dimensions of the formed flow channel were 60 mm (length) × 10 mm (width) × 0.25 mm (height).
Figure 1.

Experimental setup
In order to promote attachment of RBC to the cover slip they were pre-coated with poly-l-lysine by immersing them into a solution of 0.001% poly-l-lysine followed by drying at room temperature. RBC suspensions were introduced into the flow chamber very slowly and gently in order to prevent any activation by shear stress during the loading process. RBC were allowed to settle onto the pre-coated cover slip surface for 5 min following which unattached RBC were gently washed out using PBS containing 4 mM EDTA or 1 mM calcium chloride.
Shear stress was applied to the RBC by pumping PBS through the flow channel at a volumetric flow rate Q calculated as
| (1) |
where τ is shear stress, a is the height of flow channel, b is channel width and μ is the viscosity of the flowing medium. A syringe pump (New Era Pump Systems, Wantagh, NY, USA) was used to generate the required volumetric flow rates. PBS with calcium (1 mM) or EDTA (4 mM) with no added calcium was used for perfusion of the flow chamber.
Monitoring changes in intracellular nitric oxide concentration
The flow chamber was placed on a fluorometric system consisting of an inverted fluorescent microscope (I×71, Olympus, Japan) equipped with a photomultiplier tube fluorometric system (Ionoptix Inc., USA) (Figure 1). Fluorescent benzotriazole generated by the reaction of DAF-FM with nitrous anhydrite [16] was excited with a xenon lamp centered at 490 nm and the emitted fluorescence was recorded at wavelengths of 510 to 550 nm. Emitted light was recorded from a given population of RBC in a selected microscopic field (~25 – 40 RBC per field) at a sampling rate of 1 Hz; alterations in the fluorescence intensity were considered to reflect changes in intracellular NO concentration.
Monitoring changes in intracellular calcium concentration
The flow chamber as described above was mounted on the stage of an intravital fluorescent microscope (Olympus-BX51WI, Olympus USA) equipped with an Olympus ×40 (NA = 0.8) water immersion objective, a mercury arc lamp (100 W, Walker Instruments, Scottsdale, AZ) for epi-illumination and a rotatable turret with a filter (excitation: 450–490 nm; emission 515 nm) [17]. Fluorescent images were obtained with a Stanford Photonics video camera (XR/MEGA-10Z, Stanford Photonics Inc., Palo Alto, CA).
Individual RBC were selected on the basis of their clear visibility with an average of 4 RBC per slide used for analysis in each experimental condition. Fluorescent images of 4 separate slides with attached RBC were recorded for 30 s without applied shear stress and used to calculate the control (baseline) level. Subsequently, a shear stress of 0.1 Pa was applied to the slides for 60 s, followed by a 30 s period of video recording without stress. Fluorescence levels for each RBC were analysed separately for alterations of flourescence using 2.4.8 Piper Control Software (Stanford Photonics Inc., Palo Alto, CA). Results are expressed as the percentage change in the level of fluorescence following the shear stress relative to the pre-stress level. In order to correct for photobleaching, a total of 15 cells were illuminated without applied stress and the change in fluorescence monitored using the protocol described above; measurements of fluorescence following shear stress application were corrected using these results.
Immunoflourescence microscopy for serine-1177 phosphorylated eNOS
Cover slips with attached RBC were removed from the bottom of flow chambers following exposure to 0.1 Pa shear stress for 60 s as described above, air-dried for 30 min, then fixed with 4% paraformaldehyde in PBS at room temperature for an additional 30 minutes. After several washings in PBS, the cover slips were incubated for 1.5 hr in PBS containing 3% bovine serum albumin to block nonspecific binding and 0.05% Tween 20 for permeabilization of RBC membranes. RBC were immunolabeled with primary polyclonal rabbit antibodies against serine-1177 phosphorylated eNOS, Ser1177P-eNOS (Cell Signalling, Boston, USA) at a 1:10 dilution for 3 hr. The cover slips were then washed with PBS and incubated with an anti–rabbit FITC–conjugated secondary antibody for Ser1177P-eNOS (Invitrogen, Carlsbad CA, USA) for 1 hr. The slips were mounted in a fluorescent mounting medium (Vector Laboratories, Peterborougt, Cambridgeshire,U.K.) and examined with a fluorescent microscope (Olympus AX70). Pictures were taken with a CCD camera and processed by Olympus DP controller program version 3.2.1.276 (Olympus USA).
In order to determine Ser1177P-eNOS cellular distribution on each slip the intensity of immunoreactivity was evaluated semi-quantitatively. RBC were grouped and counted according to the following categories of their staining: a) none; b) moderate; c) intense. The percentage of RBC for each intensity level was determined by two investigators who were blinded to the identity of the cells and the average was used for data analysis.
Data presentation and statistics
The results are presented as mean ± standard error (SE). Student’s t test was used for comparisons between two experimental groups and one-way ANOVA followed by Dunnet’s or Newman-Keuls post tests was used for comparisons between multiple groups.
Results
Change in intracellular NO concentration
Figure 2 presents results from a typical experiment using RBC loaded with L-arginine and DAF-FM to monitor intracellular NO concentration; the suspending medium contained 1 mM calcium. Panel A represents the time course of fluorescence recorded from a cell population of ~50 RBC attached to the surface of cover slip; panels B and C show micrographs of the cells at rest and during application of 0.1 Pa shear stress. The fluorescence of the cells subjected to stress is expressed relative to the mean fluorescence intensity from the same cells when not exposed to shear stress. Application of 0.1 Pa shear stress resulted in elongation of RBC in the direction of flow (Panel C) and a sharp increase in fluorescence level which reached about 4% within ~30 s after the start of flow. During continuation of flow there was a further but slower and less pronounced trend of fluorescence increase. Following the removal of shear stress the level of fluorescence began to decrease (panel A). It is important to note that when no shear stress was applied to a similar population of DAF-FM loaded RBC there were no significant alterations of fluorescence level during the 600 s period of observation (panel A, No SS).
Figure 2.

Fluorescence level related to the reaction of DAF-FM with NO derivatives in RBC pre-loaded with L-arginine and exposed to 0.1 Pa shear stress (panel A, SS applied). The first vertical arrow marks the start of shear stress application (i.e., flow) and the second indicates flow stoppage. The lower panels are phase-contrast microscopic images of the RBC population from which fluorescence was recorded prior to the application of shear stress (B) and during application of shear stress (C). The horizontal arrow indicates the direction of flow. Panel A also shows the fluorescence level recorded from a similar RBC population without applying shear stress (No SS).
In a series of 8 experiments, the mean increase in fluorescence at 60 s after the start of shear stress was 3.66 ± 0.74 % and reached 4.91 ± 0.81 % at 120 s, both increases being significant compared to the level prior to shear stress application (p<0.01). If fluid flow was stopped after 120 s as shown in Figure 2, fluorescence exhibited a slow decrease at a rate of 0.06 ± 0.005 %/min. However, if the shear stress of 0.1 Pa was maintained beyond 120 s the fluorescence level continued to increase (Figure 3), reaching 15.3 ± 1.9% at 10 min (p<0.0001; n=8).
Figure 3.

Percentage increase of NO concentration-related fluorescence of RBC exposed to 0.1 Pa shear stress as a function of time. RBC were pre-incubated with 1 mM L-arginine and the suspensions contained 1 mM calcium. Data are presented as mean ± SE, n=8. Changes in fluorescence were statistically significant starting at 60 s after the start of application of shear stress (p<0.01).
The magnitude of the applied shear stress was an important determinant of the change of RBC-NO related fluorescence. Figure 4 presents increases of fluorescence when shear stress was varied over the range of 0.013 to 0.1 Pa and measured at 60 or 120 s following the start of flow. Fluorescence levels were found to be significantly enhanced over the entire range of applied shear stresses at either 60 or 120 s, although the differences became more obvious at 120 s. Furthermore, the changes in fluorescence for various levels of shear stress were significantly different from each other when compared at 120 s, but at 60 s only 0.013 and 0.1 Pa differed significantly (Figure 4).
Figure 4.

Percentage increase of NO concentration-related fluorescence of RBC exposed to various levels of shear stress in the presence of 1 mM L-arginine and 1mM calcium 60 and 120 s after the start of shear stress. †, ††: Difference from pre-stress (zero) level (p<0.05 and p<0.01 respectively). *, **: Difference from experiments with 0.1 Pa shear stress (p<0.05 and p<0.01 respectively); n=4 for all experiments.
The increase in fluorescence due to shear stress was found to be influenced by L-arginine. The change in fluorescence at 60 s under 0.1 Pa shear stress was 1.62 ± 0.39 % if RBC were not pre-incubated with 1 mM L-arginine and thus significantly less than the 3.66 ± 0.74 % when cells were pre-incubated with this agent (Figure 5.A, p<0.05, n=6). Including L-NAME in the RBC suspension during pre-incubation also blunted the change in fluorescence, reducing it to 1.46 ± 0.32 % (Figure 5.B, p<0.05, n=6).
Figure 5.

Percentage increase in RBC NO concentration-related fluorescence at 60 s for cells exposed to 0.1 Pa. Panel A: Without added L-Arginine: Panel B: in the presence of 1 mM L-NAME. In each panel the control column represents experiments on RBC pre-loaded with 1 mM L-arginine. RBC used in experiments with L-NAME were also pre-loaded with L-arginine. ††: Difference from pre-stress (zero) level (p<0.01). *: Difference from control (p<0.05). n=6 for both types of experiments.
Role of calcium in increased intracellular nitric oxide generation
Experiments were repeated in the presence or absence of extracellular calcium (Figure 6). Inclusion of 4 mM EDTA without added calcium in the suspending medium caused a marked decrease in fluorescence (i.e., 0.83 ± 0.26 %), nearly to one-fourth of that for cells suspended in 1 mM calcium (Figure 6, p<0.01). In Figure 6 results for both types of experiments used cells loaded with L-arginine and DAF-FM, shear stress was 0.1 Pa and fluorescence was measured at 60 s. Further experiments designed to evaluate the effect of calcium entry into RBC under the same shearing conditions indicated that the fluorescence in Fluo-3 loaded RBC increased 23.6 ± 2.5 % following 60 s exposure to 0.1 Pa shear stress, thereby indicating increased intracellular calcium concentration (Figure 7). Inclusion of EDTA without added calcium totally inhibited this increase.
Figure 6.

Percentage increase in RBC NO concentration-related fluorescence at 60 s for cells exposed to 0.1 Pa in suspensions containing EDTA without calcium, compared to those containing 1 mM calcium, but no EDTA. †, ††: Difference from pre-stress (zero) level (p<0.05 and p<0.01 respectively). **: Difference from control (p<0.01). n=6.
Figure 7.
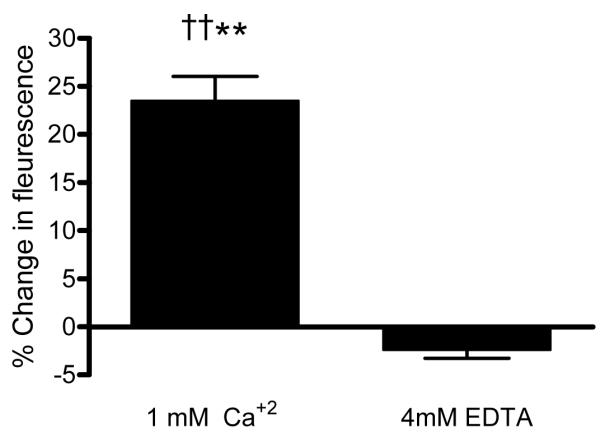
Change in intracellular calcium concentration related fluorescence in Fluo-3 loaded RBC (0.1 Pa, 60 s) in the presence of 1 mM calcium or 4 mM EDTA in the suspending medium (n=15). ††: Difference from pre-stress (zero) level (p<0.01). **: Difference from EDTA containing suspension (p<0.01). The presence of 4 mM EDTA totally inhibited the response.
Phosphorylation of red blood cell NOS under shear stress
Figures 8 A-D present fluorescent microscopic images of RBC immunostained with serine 1177 phosphorylated eNOS antibodies, with a semiquantitative analysis of such images presented in Figure 8.E. Figures 8.A and B are the control experiments prior to the application of shear stress with the flow chamber filled with either calcium-containing PBS (A) or EDTA-containing, calcium free PBS (B). Figure 8.C shows RBC exposed to 0.1 Pa fluid shear stress for 60 s in a medium containing 1 mM calcium; under these conditions 44.3 ± 5.3 % of the RBC were intensely immunostained while 53.0 ± 3.1 % were moderately immunostained. Figure 8.D also shows RBC exposed to 0.1 Pa for 60 s but in a calcium-free medium containing EDTA: only 5.3 ± 8.7 % of the RBC were intensely immunostained while 58.0 ± 1.2 % remained unstained.
Figure 8.

Serine 1177 phosphorylated eNOS immunofluorescent staining. A: RBC in PBS containing 1 mM calcium and not exposed to shear stress. B: RBC in PBS containing 4 mM EDTA (i.e., no calcium) and not exposed to shear stress. C: RBC exposed to 0.1 Pa shear stress in the presence of 1 mM calcium. D: RBC exposed to shear stress in PBS containing 4 mM EDTA (i.e., no calcium). E: semiquantitative evaluation of immunostaining of RBC. Immunostaining levels where n=none, m=moderate, i=intense. In panel E “Calcium” indicates the presence of 1 mM calcium and “EDTA” indicates the presence of 4 mM EDTA with no added calcium. Data are mean ± standard error of three experiments. *,***: Difference from corresponding bar for “Calcium” (p<0.05 and p<0.001 respectively).
Discussion
Activation of RBC NOS by shear stress has been previously demonstrated by increased levels of serine 1177 phosphorylated eNOS (i.e., the activated form of the enzyme protein [18; 19]), accompanied by increased extracellular NO concentrations measured electrochemically in RBC suspensions [14]. The present study provides further evidence for increased intracellular NO concentration in RBC subjected to fluid shear stress as monitored using the NO-specific fluorescent probe DAF-FM [16; 20]. Intracellular NO concentrations, as reflected by the level of DAF-FM related fluorescence, exhibited a rapid increase reaching a steady level within 30 s (Figure 2); the fluorescence level continued to increase as long as shear stress was maintained (Figure 3).
DAF-FM is one of the most successful probes for evaluating intracellular NO; the diacetate form (DAF-FM DA) is membrane permeable and remains non-fluorescent until it is de-esterified and nitrosylated by oxidation products of NO [16; 21]. However, these reactions are sensitive to the initial oxidation of DAF-FM to an anilinyl radical (i.e., one-elctron oxidation) in addition to NO oxidation, thus making the process susceptible to the oxidative status of the measurement environment (e.g., RBC cytosol) and hence making it difficult to obtain quantitative data using these probes [22]. Autooxidation of DAF-FM may be another potential artifact, with this process influenced by oxidants such as superoxide and peroxy radicals, yet such interference has not been considered a major obstacle in using DAF-FM as a probe specific to NO [21].
NO scavengers (e.g., reduced hemoglobin) have been used under various conditions to test the specificity of measured fluorescence to the presence of NO [23]. This approach was not applicable to the experimental model used herein since all measurements were conducted in the presence of a powerful NO scavenger (i.e., reduced hemoglobin in the cytoplasm of RBC). We thus accepted that the baseline level of fluorescence reflected the basal NO availability and that the subsequent alterations of fluorescence indicated changes of intracellular NO concentration. This assumption should be especially valid for monitoring fluorescence under our standardized conditions: the environment was unaltered during monitoring DAF-FM related fluorescence except for the application of SS which is expected to induce NO generation.
It should also be noted that the DAF-FM reaction with NO is not readily reversible [22], and therefore the fluorescence monitored throughout the experiment cannot reflect instantaneous changes in intracellular NO concentration. Accordingly, the continued increase of fluorescence during prolonged exposure (i.e., > 60 s) to constant shear stress may not mean that NOS activity also gradually increases during this period, but rather may reflect an intracellular accumulation of fluorescent DAF derivatives together with continued NOS activity at an elevated but steady level. Similar patterns of DAF-related fluorescence with induced NOS activity have been reported for other cell types [23-25].
The level of fluorescence at a given time point is determined by the balance between the formation rate of fluorescent benzotriazole by DAF-FM reacting with NO or its derivatives versus the loss of fluorescence due to photobleaching [16]. However, prominent changes in fluorescence were not observed in RBC in the absence of shear stress (Figure 2.A, No SS), suggesting that no significant photobleaching occurs under “no flow” conditions. The decreased level of fluorescence following stoppage of flow (Figure 2.A) could thus reflect a combination of factors including deactivation of NOS enzyme due to the absence of shear stress, depletion of L-arginine supply in RBC due to enhanced NOS activity and photobleaching of the fluorescent products of DAF-FM; the latter possibility might occur more efficiently due to the enhanced formation of these products with shear stress. Due to the possible contribution of various factors to the fluorescence intensity at a given time point it is not possible to exactly determine the time course of RBC NOS activity based on the DAF-FM related fluorescence during prolonged exposure to stress. Therefore, fluorescence levels measured at 60 s after the application of shear stress were used as the primary indicator of NOS activity for the experiments presented in Figures 5 and 6.
A relation between the observed increase in DAF-FM related fluorescence, intracellular NO concentration and the activation of NOS under shear stress is supported by the following findings: 1) The response to shear stress was significantly diminished if RBC were not pre-loaded with L-arginine, although such RBC were still responsive to stress at a reduced level (Figure 5.A). This remaining activity might be due to the basal levels of L-arginine in RBC, or may suggest alternative mechanisms of generating NO that are stimulated by shear stress. 2) The response to stress was also significantly blunted in the presence of L-NAME which is an L-arginine analogue and a competitive inhibitor of NOS, but again there was a remaining response to shear stress in terms of increased intracellular NO concentration (Figure 5.B). Although the concentration of L-NAME used in the experiments corresponds to that previously demonstrated to be maximally effective in RBC [26], the incomplete inhibition of the response to shear stress may reflect an insufficient L-NAME level due to enhanced NOS activity. 3) The increase in intracellular NO concentration was accompanied by enhanced levels of serine 1177 phosphorylated eNOS levels in RBC exposed to stress.
Another finding of the present study supporting the NOS-related mechanism of increased intracellular NO concentration is the dependence of the response on calcium entry into the RBC under stress. Chelating extracellular calcium by EDTA significantly inhibited the response although it did not totally prevent the increase of intracellular NO (Figure 6); the remaining degree of activation following the chelation of extracellular calcium may represent the non-calcium dependent pathway of NOS activation [12; 19]. The residual response after the removal of extracellular calcium may also indicate alternative mechanisms (e.g., non-enzymatic generation of NO) by shear stress. This finding thus strongly suggests that the NO response is accompanied by calcium entry into RBC; calcium entry under the same experimental conditions has also been confirmed in a separate series of experiments (Figure 7). Note that previous studies have shown that stress induces calcium influx into endothelial cells [27] and human red blood cells [28].
It has been well documented that enhancement of eNOS activity in endothelial cells depends on changes in intracellular calcium concentration [12; 19]. Non-activated eNOS is bound to caveolin-1 on the cytoplasmic side of the membrane and calmodulin cannot bind to the enzyme protein at low intracellular calcium concentrations [29]. An increase in intracellular calcium induces the binding of the calcium-calmodulin complex to the eNOS protein leading to its detachment from caveola and activation. [29]. However, it has been reported that the time course of the change in intracellular calcium concentration and eNOS activation may not always follow the same pattern, especially in the case of stimulation by shear stress [19]. This temporal discrepancy between the two physiological events is explained by alternative mechanisms including the phosphorylation of eNOS protein which leads to activation [19]. This activation pathway includes serine kinases (Akt and protein kinase A); their activation in turn is mediated by phosphatidylinositol 3-kinase [19]. A similar mechanism of activation has been postulated to exist in RBC, although this has not yet been experimentally confirmed [12].
It should be noted that the shear stress regime utilized in this study differed from previous experiments in which relations between shear stress and RBC NOS activation were investigated [14; 15]. In the present investigation a given stress level was continuously applied during an experiment, whereas previously stresses of 0.5-2 Pa could not be held constant due to the experimental system: RBC in suspension were exposed to stress only during passage through a glass tube for 18 s at 0.5 Pa, for 9 s at 1 Pa or for 4.5 s at 2 Pa [14]. In these prior studies application of 0.5 and 1 Pa SS did not increase NO concentration in the RBC suspensions whereas an increase was noted at 2 Pa. This difference suggests that exposure time, as well as stress level, are determinants of NOS activation. Interestingly, exposure of RBC to stress levels as high as 110 Pa for very short periods (i.e., several milliseconds) during filtration through 5 μm diameter by 11 μm long pores also resulted in enhancement of NO concentration in RBC suspensions [15]. Therefore, data obtained using different experimental systems suggest that activation of RBC NOS may be induced by a variety of shear stress magnitude-exposure time combinations. The experimental design of the current studies was not suitable to test a wide range of stress due to detachment of RBC from the bottom plate of the flow chamber at stresses above 0.1 Pa. Further experiments are therefore needed to clarify how the specific details of applied shear stress (e.g., flow pattern, strength, exposure time) influence RBC NOS activation.
The magnitude of stress used in the present study was about 10 times lower than wall shear stress levels reported for various parts of the circulatory system [30-33]. However, the reported range for wall stress may not be relevant for all RBC within a flowing suspension since cells tend to move towards the axis of a tube or vessel and thus undergo inward radial migration [34]. Since the shear stress is smaller near the center of a tube, the magnitude of shear stress used in this study may represent a physiologically relevant level.
It has been argued that RBC have a dual role in tissue oxygenation: in addition to their well-known oxygen carrier function, RBC may contribute to the regulation of local blood flow with NO playing a central role in this process [35]. NO synthesized by RBC NOS activity has been hypothesized to contribute to the RBC-originated NO pool, although Chen, et al. reported that the amount of NO generated by RBC NOS may not represent a physiologically important fraction of total NO bioavailability at vascular wall [36]. Experimental studies directly exploring the contribution of the enzymatic generation of NO by RBC to local vasomotor control do not yet exist. However, NO synthesis by RBC should still be considered an important factor contributing to local hemodynamics, since it has been shown that NO generated by RBC is a regulator of RBC deformability [9; 26; 36; 37]. The relatively fast increase in intracellular NO concentration at physiological levels of shear stress would be expected to improve RBC deformability and blood flow accordingly, especially at the microcirculatory level.
Acknowledgement
The authors thank to Dr. Pedro Cabrales for his valuable contributions during experimental design. Supported by NIH Research Grants HL 015722, HL 070595 and HL 090511 (HJM) and R01-HL 52684 (PCJ) and by the Akdeniz University Research Projects Unit (OKB).
Footnotes
Publisher's Disclaimer: This is a PDF file of an unedited manuscript that has been accepted for publication. As a service to our customers we are providing this early version of the manuscript. The manuscript will undergo copyediting, typesetting, and review of the resulting proof before it is published in its final citable form. Please note that during the production process errors may be discovered which could affect the content, and all legal disclaimers that apply to the journal pertain.
References
- [1].Imig JD, Gebremedhin D, Harder DR, Roman RJ. Modulation of Vascular Tone in Renal Microcirculation by Erythrocytes - Role of EDRF. American Journal of Physiology. 1993;264:H190–H195. doi: 10.1152/ajpheart.1993.264.1.H190. [DOI] [PubMed] [Google Scholar]
- [2].Liao JC, Hein TW, Vaughn MW, Huang KT, Kuo L. Intravascular flow decreases erythrocyte consumption of nitric oxide. Proceedings of the National Academy of Sciences of the United States of America. 1999;96:8757–8761. doi: 10.1073/pnas.96.15.8757. [DOI] [PMC free article] [PubMed] [Google Scholar]
- [3].Azarov I, Huang KT, Basu S, Gladwin MT, Hogg N, Kim-Shapiro DB. Nitric Oxide Scavenging by Red Blood Cells as a Function of Hematocrit and Oxygenation. J. Biol. Chem. 2005;280:39024–39032. doi: 10.1074/jbc.M509045200. [DOI] [PubMed] [Google Scholar]
- [4].Jia L, Bonaventura C, Bonaventura J, Stamler JS. S-nitrosohaemoglobin: a dynamic activity of blood involved in vascular control. Nature. 1996;380:221–226. doi: 10.1038/380221a0. [DOI] [PubMed] [Google Scholar]
- [5].Pawloski JR, Hess DT, Stamler JS. Export by red blood cells of nitric oxide bioactivity. Nature. 2001;409:622–626. doi: 10.1038/35054560. [DOI] [PubMed] [Google Scholar]
- [6].Stamler JS, Jia L, Eu JP, McMahon TJ, Demchenko IT, Bonaventura J, Gernert K, Puantadosi CA. Blood flow regulation by S-nitrosohemoglobin in the physiological oxygen gradient. Science. 1997;276:2034–2037. doi: 10.1126/science.276.5321.2034. [DOI] [PubMed] [Google Scholar]
- [7].Allen BW, Piantadosi CA. How do red blood cells cause hypoxic vasodilation? The SNO-hemoglobin paradigm. Am J Physiol Heart Circ Physiol. 2006;291:H1507–H1512. doi: 10.1152/ajpheart.00310.2006. [DOI] [PubMed] [Google Scholar]
- [8].Grubina R, Huang Z, Shiva S, Joshi MS, Azarov I, Basu S, Ringwood LA, Jiang A, Hogg N, Kim-Shapiro DB, Gladwin MT. Concerted Nitric Oxide Formation and Release from the Simultaneous Reactions of Nitrite with Deoxy- and Oxyhemoglobin. J. Biol. Chem. 2007;282:12916–12927. doi: 10.1074/jbc.M700546200. [DOI] [PubMed] [Google Scholar]
- [9].Kleinbongard P, Schutz R, Rassaf T, Lauer T, Dejam A, Jax T, Kumara I, Gharini P, Kabanova S, Ozuyaman B, Schnurch HG, Godecke A, Weber AA, Robenek M, Robenek H, Bloch W, Rosen P, Kelm M. Red blood cells express a functional endothelial nitric oxide synthase. Blood. 2006;107:2943–2951. doi: 10.1182/blood-2005-10-3992. [DOI] [PubMed] [Google Scholar]
- [10].Carvalho FA, Mesquita R, Martins-Silva J, Saldanha C. Acetylcholine and choline effects on erythrocyte nitrite and nitrate levels. Journal of Applied Toxicology. 2004;24:419–427. doi: 10.1002/jat.993. [DOI] [PubMed] [Google Scholar]
- [11].Barvitenko NN, Adragna NC, Weber RE. Erythrocyte signal transduction pathways, their oxygenation dependence and functional significance. Cellular Physiology and Biochemistry. 2005;15:1–18. doi: 10.1159/000083634. [DOI] [PubMed] [Google Scholar]
- [12].Ozuyaman B, Grau M, Kelm M, Merx MW, Kleinbongard P. RBC NOS: regulatory mechanisms and therapeutic aspects. Trends Mol. Med. 2008;14:314–322. doi: 10.1016/j.molmed.2008.05.002. [DOI] [PubMed] [Google Scholar]
- [13].Fischer UM, Schindler R, Brixius K, Mehlhorn U, Bloch W. Extracorporeal Circulation Activates Endothelial Nitric Oxide Synthase in Erythrocytes. Ann Thorac Surg. 2007;84:2000–2003. doi: 10.1016/j.athoracsur.2007.07.034. [DOI] [PubMed] [Google Scholar]
- [14].Ulker P, Sati L, Celik-Ozenci C, Meiselman HJ, Baskurt OK. Mechanical stimulation of nitric oxide synthesizing mechanisms in erythrocytes. Biorheology. 2009;46:121–132. doi: 10.3233/BIR-2009-0532. [DOI] [PubMed] [Google Scholar]
- [15].Ulker P, Meiselman HJ, Baskurt OK. Nitric oxide generation in red blood cells induced by mechanical stress. Clin. Hemorheol. Microcirc. 2010;45:169–175. doi: 10.3233/CH-2010-1293. [DOI] [PubMed] [Google Scholar]
- [16].Kojima H, Nakatsubo N, Kikuchi K, Kawahara S, Kirino Y, Nagoshi H, Hirata Y, Nagano T. Detection and imaging of nitric oxide with novel fluorescent indicators: diaminofluoresceins. Anal. Chem. 1998;70:2446–2453. doi: 10.1021/ac9801723. [DOI] [PubMed] [Google Scholar]
- [17].Yang L, Andrews DA, Low PS. Lypophosphatidic acid opens a Ca++ channel in human erythrocytes. Blood. 2000;95:2420–2425. [PubMed] [Google Scholar]
- [18].Dimmeler S, Fleming I, Fisslthaler B, Hermann C, Busse R, Zeiher AM. Activation of nitric oxide synthase in endothelial cells by Akt-dependent phosphorylation. Nature. 1999;399:601. doi: 10.1038/21224. [DOI] [PubMed] [Google Scholar]
- [19].Fleming I, Busse R. Molecular mechanisms involved in the regulation of the endothelial nitric oxide synthase. Am J Physiol Regul Integr Comp Physiol. 2003;284:R1–12. doi: 10.1152/ajpregu.00323.2002. [DOI] [PubMed] [Google Scholar]
- [20].Kojima H, Urano Y, Kukuchi K, et al. Fluorescent indicators for imaging NO production. Angew Chem. Int. Ed. 1999;38:3209–3212. doi: 10.1002/(sici)1521-3773(19991102)38:21<3209::aid-anie3209>3.0.co;2-6. [DOI] [PubMed] [Google Scholar]
- [21].Balcerczyk A, Soszynski M, Bartosz G. On the specificity of 4-amino-5-methylamino-2′,7′-difluorofluorescein as a probe for nitric oxide. Free Radical Biology and Medicine. 2005;39:327–335. doi: 10.1016/j.freeradbiomed.2005.03.017. [DOI] [PubMed] [Google Scholar]
- [22].Wardman P. Fluorescent and luminescent probes for measurement of oxidative and nitrosative species in cells and tissues: Progress, pitfalls, and prospects. Free Radical Biology and Medicine. 2007;43:995–1022. doi: 10.1016/j.freeradbiomed.2007.06.026. [DOI] [PubMed] [Google Scholar]
- [23].Gunasekar PG, Kanthasamy AG, Borowitz JL, Isom GE. Monitoring intracellular nitric oxide formation by dichlorofluorescin in neuronal cells. Journal of Neuroscience Methods. 1995;61:15–21. doi: 10.1016/0165-0270(95)00018-p. [DOI] [PubMed] [Google Scholar]
- [24].Imrich A, Kobzik L. Fluorescence-based measurement of nitric oxide synthase activity in activated rat macrophages using dichlorofluorescin. Nitric Oxide-Biology and Chemistry. 1997;1:359–369. doi: 10.1006/niox.1997.0135. [DOI] [PubMed] [Google Scholar]
- [25].McGarry JG, Maguire P, Campbell VA, O’Connell BC, Prendergast PJ, Jarvis SP. Stimulation of nitric oxide mechanotransduction in single osteoblasts using atomic force microscopy. J. Orthop. Res. 2008;26:513–521. doi: 10.1002/jor.20515. [DOI] [PubMed] [Google Scholar]
- [26].Bor-Kucukatay M, Wenby RB, Meiselman HJ, Baskurt OK. Effects of nitric oxide on red blood cell deformability. Am. J. Physiol Heart Circ. Physiol. 2003;284:H1577–H1584. doi: 10.1152/ajpheart.00665.2002. [DOI] [PubMed] [Google Scholar]
- [27].Hoyer J, Kohler R, Distler A. Mechanosensitive Ca2 oscillations and STOC activation in endothelial cells. Faseb Journal. 1988;12:359–366. doi: 10.1096/fasebj.12.3.359. [DOI] [PubMed] [Google Scholar]
- [28].Larsen FL, Katz S, Roufogalis BD, Brooks DE. Physiological shear stresses enhance the Ca2+ permeability of human erythrocytes. Nature. 1981;294:667–668. doi: 10.1038/294667a0. [DOI] [PubMed] [Google Scholar]
- [29].Feron O, Saldana F, Michel JB, Michel T. The Endothelial Nitric-oxide Synthase-Caveolin Regulatory Cycle. J. Biol. Chem. 1998;273:3125–3128. doi: 10.1074/jbc.273.6.3125. [DOI] [PubMed] [Google Scholar]
- [30].Greve JM, Les AS, Tang BT, Blomme M.T. Draney, Wilson NM, Dalman RL, Pelc NJ, Taylor CA. Allometric scaling of wall shear stress from mice to humans: quantification using cine phase-contrast MRI and computational fluid dynamics. Am J Physiol Heart Circ Physiol. 2006;291:H1700–H1708. doi: 10.1152/ajpheart.00274.2006. [DOI] [PubMed] [Google Scholar]
- [31].Nagaoka T, Yoshida A. Noninvasive Evaluation of Wall Shear Stress on Retinal Microcirculation in Humans. Invest. Ophthalmol. Vis. Sci. 2006;47:1113–1119. doi: 10.1167/iovs.05-0218. [DOI] [PubMed] [Google Scholar]
- [32].Reneman RS, Arts T, Hoeks APG. Wall shear stress - an important determinant of endothelial cell function and structure in the arterial system in vivo. J. Vasc. Res. 2006;43:251–269. doi: 10.1159/000091648. [DOI] [PubMed] [Google Scholar]
- [33].Schmid-Schonbein GW. Biomechanics of Microcirculatory Blood Perfusion. Annual Review of Biomedical Engineering. 1999;1:73–102. doi: 10.1146/annurev.bioeng.1.1.73. [DOI] [PubMed] [Google Scholar]
- [34].Goldsmith HL, Cokelet GR, Gaehtgens P. Robin Fahraeus: evolution of his concepts in cardiovascular physiology. Am. J. Physiol. 1989;257:H1005–H1015. doi: 10.1152/ajpheart.1989.257.3.H1005. [DOI] [PubMed] [Google Scholar]
- [35].Jensen FB. The dual roles of red blood cells in tissue oxygen delivery: oxygen carriers and regulators of local blood flow. J Exp Biol. 2009;212:3387–3393. doi: 10.1242/jeb.023697. [DOI] [PubMed] [Google Scholar]
- [36].Chen KJ, Pittman RN, Popel AS. Hemorrhagic shock and nitric oxide release from erythrocytic nitric oxide synthase: A quantitative analysis. Microvascular Research. 2009;78:107–118. doi: 10.1016/j.mvr.2009.02.009. [DOI] [PMC free article] [PubMed] [Google Scholar]
- [37].Bor-Kucukatay M, Yalcin O, Gokalp O, Kipmen-Korgun D, Yesilkaya A, Baykal A, Ispir M, Senturk UK, Kaputlu I, Baskurt OK. Red blood cell rheological alterations in hypertension induced by chronic inhibition of nitric oxide synthesis in rats. Clin. Hemorheol. Microcirc. 2000;22:267–275. [PubMed] [Google Scholar]