Abstract
This article demonstrates the encapsulation of cubic iron oxide NPs by Brome mosaic virus capsid shells and the formation, for the first time, of virus-based nanoparticles (VNPs) with cubic cores. Cubic iron oxide nanoparticles (NPs) functionalized with phospholipids containing poly(ethylene glycol) tails and terminal carboxyl groups exhibited exceptional relaxivity in magnetic resonance imaging experiments, which opens the way for in vivo MRI studies of systemic virus movement in plants. Preliminary data on cell-to-cell and long-distance transit behavior of cubic iron oxide NPs and VNPs in N. benthamiana leaves indicate that VNPs have specific transit properties, i.e., penetration into tissue and long-distance transfer through the vasculature in N. Benthamiana plants, even at low temperature (6° C), while NPs devoid of virus protein coats exhibit limited transport by comparison. These particles potentially open new opportunities for the high contrast functional imaging in plants and for the delivery of therapeutic anti-microbial cores into plants.
Keywords: Virus-based nanoparticles, magnetic nanoparticle, virus transit, plants
Plant-infecting icosahedral viruses have recently provided a new class of bio-inspired architectures for non-genomic materials packaging.1–9 Virus-based nanoparticles (VNPs) are protein cages encapsulating a nanoscopic cargo that can be genetically engineered to achieve desired physical and chemical properties10–12 or can be used without any modification.4, 7, 9 Important features of VNPs include their monodisperse character, chemical addressability, and symmetric architecture that are potentially useful for targeted delivery.13 Until now, most such VNPs have been designed for biomedical applications such as vaccines, high-contrast functional imaging, and vascular delivery of therapeutic agents.11–12, 14–18 In certain cases, the VNP protein cage mimics the morphology and functional characteristics of wild-type virus capsids (VCs).9 Such constructs have promise as tools for studying virus-induced physiological responses.
In particular for plants, with their exact size and controllable surface chemistry, VNPs can be used for high-contrast functional imaging of vascular transport processes, making it possible to examine specific features such as determining the dimensions of the various pathway restrictions within plant vascular systems.19–23 Understanding vascular transport processes is crucial to environmental and agronomic concerns relating to biomass partitioning, water stress, and disease. Knowledge of the physical parameter(s) governing protein-based macromolecular movement in the plant vasculature is essential for researchers to better engineer plants (through either genetically engineered plants, breed crops for improved vascular flow, or nanotech engineering) for increased delivery of protein biomass to target tissues. Water stress is a crucial consideration in respect to the potential impact of climate change on rainfall and temperature, which are predicted to affect crop yields. With respect to disease, VNPs can be used to explore the fate of virion particles in host plants, and those vector interactions that result in the widespread dissemination of disease. When VNPs have magnetic properties imparted by their cargo, magnetic resonance imaging (MRI) can be employed for tracking VNP transit. To the best of our knowledge, there have been no attempts so far to explore these opportunities. In this paper, we report the first attempt towards comparing transport properties of VNPs made of Brome mosaic virus (BMV) capsid proteins (CPs) and iron oxide NPs in a plant host (Nicotiana benthamiana).
In a previous paper, we described the formation of VNPs around 20.1 nm iron oxide NPs coated with phospholipids containing a poly(ethyelene glycol) (PEG) tail of 2,000 Da with terminal carboxyl groups.7 The NPs were efficiently encapsulated by BMV VCs yielding 41 nm VNPs with narrow VNP size distribution (2.2% standard deviation).7
In the present work we report the formation of VNPs with cubic NP cores and the comparative study of the transit of cubic NPs functionalized with PEGylated phospholipids with and without viral coats in Nicotiana benthamiana leaves. We found that virus capsids influence both subcellular and long distance transport and that VNPs with magnetic cores can be transported across long distances and inside cells of different types.
Cubic iron oxide NPs of 18.6 nm in diameter were chosen for VNP formation because they can be unambiguously discriminated in a stained plant tissue from organelles and endogenous macromolecules and because they can carry adequate charge density for encapsulation.24 The MRI signature of cubic NPs was also studied to validate them as MRI contrast agents. We believe this work represents one of few examples that bridge bioinspired nano-architectures and phytology.25
Results and Discussion
Cubic Magnetic NP Structure and Surface Functionalization
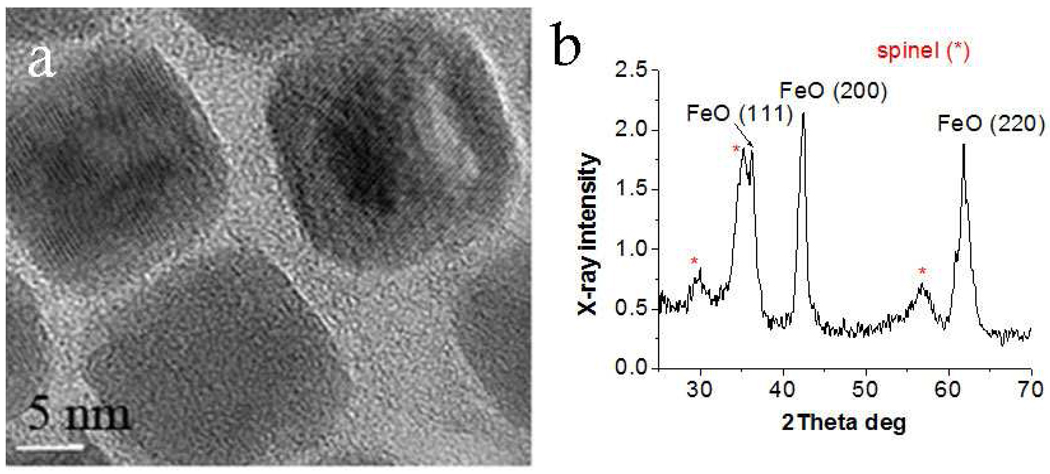
Figure 1 shows a high resolution TEM (HRTEM) image (a) and X-ray diffraction (XRD) profile (b) of cubic NPs with a diameter of 18.6 nm and a relative size standard deviation of 7.7%.26 Although HRTEM shows lattice fringes of a nearly single crystal, the XRD profile reveals formation of two phases: wüstite (Fe(1-x)O) and spinel (most likely Fe3O4). As result of the mixing of these two phases (wüstite being antiferromagnetic and spinel being superparamagnetic), NPs are superparamagnetic with a blocking temperature of ~250 K (see the Supporting Information text and Figure S1).
Figure 1.
HRTEM image (a) and XRD profile (b) of the as-prepared 18.6 nm iron oxide NPs.
Given that prepared magnetic NPs are hydrophobic, an added coat of PEGylated phospholipids is necessary to impart water solubility and in some cases, functionality in biological applications.27–30 The coating process is driven by hydrophobic interactions between lipids and the oleic acid tails located on the iron oxide NP surface. Carboxyl-terminated PEGylated phospholipids (HOOC-PEG-PL) are characterized by an anionic surface charge (from the terminal -COOH groups) water-affinity, and sterically-controlled stability (from the PEG chains), all important requirements for VNP synthesis.31 After coating with HOOC-PEG-PL, the NPs were easily dispersed in water and stable as colloidal suspensions for months.
As discussed in a preceding paper,7 the lower the curvature of spherical NPs on their surface, the higher the HOOC-PEG-PL ligand and charge density. Sufficient charge density is critical in the formation of well-defined VNPs.7 Cubic NPs have flat surface which leads to the highest surface density of PEGylated phospholipids. Indeed ATR-FTIR measurements indicated that for cubic NPs, the surface ligand density is 5.32 per nm2, which translates into a charge density of 2.62 per nm2. For comparison, for the largest spherical iron oxide NPs (20.1 nm) studied in our preceding work,7 these values are 3.5 and 1.67 per nm2, respectively. In the case of cubic NPs, the higher charge density allows for increased stability of VNPs.
MRI Response of Cubic NPs Coated with HOOC-PEG-PL
In order to evaluate the utility of magnetic VNPs as MRI contrast agents, MR relaxivities and map images of the cores (HOOC-PEG-PL coated 18.6 nm cubic NPs) were investigated. Experiments were performed in a clinical 3 T MR scanner at room temperature. Inverse relaxation times (1/T1(samples)-1/T1(solvent)) and (1/T2(samples)-1/T2(solvent)) were plotted as a function of iron concentration (Figure S2, Supporting Information). The longitudinal r1 and transverse r2 relaxivities were then estimated from the slopes of the plots to be 0.97 mM−1s−1 and 140.28 mM−1s−1, respectively. The r2/r1 ratio of 145 was much higher than that of commercial contrast agents with similar particle sizes such as Feridex (AMI-25) and Supravist (SH U 555C)32 as shown in Table 1. Therefore, since a higher relaxivity ratio offers a higher T2 contrast, such NPs represent promising candidates for high-efficiency T2 (negative) contrast agents. VNP-Gd complexes have been investigated as T1 contrast agents,33 and have been shown to display remarkably high r1 and r2 (Table 1). However, due to the toxicity of Gd, only chelate Gd compounds can be used as contrast agents. This raises the supplemental issue of stability in specific local physiological conditions. Therefore, iron oxide compounds in a nanoparticle form represent an interesting alternative. Such compounds act as, T2-shortening contrast agents as they have a more pronounced effect on the T2 relaxation time than on the T1 relaxation time (greater r2/r1 ratio).34 In addition, T2-weighted MRI is favorable compared to T1-weighted MRI in specific functional imaging applications.35.
Table 1.
Comparative table of r1 and r2 relaxivities and the relaxivity ratio(r2 /r1) measured at 3T for nanoparticles discussed in this paper, commercially available MRI contrast agents, and reported in literature VNP-Gd complexes.33
| Materials | NP size (nm) | r1 (mM−1s−1) | r2 (mM−1s−1) | r2/r1 |
|---|---|---|---|---|
| Cubic iron oxide NPs (this paper) | 18.6 | 0.97 | 140.28 | 144.6 |
| Feridex(AMI-25) | 30 | 4.1 | 93 | 22.6 |
| Supravist (SH U 555C) | Core size 3–5 nm; hydrodynamic diameter 20 nm | 7.3 | 57 | 7.8 |
| VNP-Gd complexes33 | n/a | 202 | 376 | 1.86 |
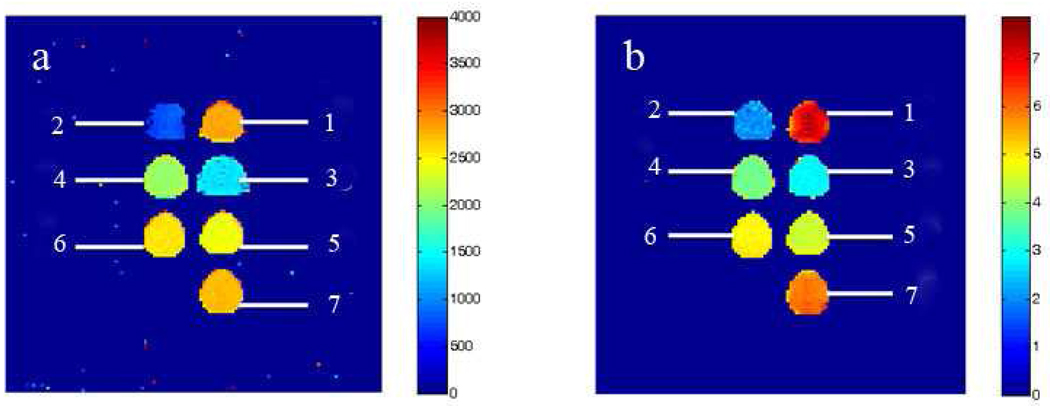
To qualitatively illustrate the T1 and T2 relaxation-time changes and thus MR contrast as a function of the increasing NP concentration, T1 and T2 map images were produced (Fig 2). Both T1 and T2 map images clearly show dose-dependent contrast changes as the iron concentration increases. This is because both T1 and T2 relaxation times become shorter with increasing iron concentration. The dose-dependent effect on the T2 relaxation time is significant requiring a logarithmic scale in order to represent the T2 differences generated by small concentration changes of the iron oxide NPs in solution.
Figure 2.
(a) Longitudinal T1 and (b) T2 map images of the 18.6 nm cubic iron oxide NPs coated with HOOC-PEG-PL and dispersed in Milli-Q water. Scale bar in (a) is linear (unit: milliseconds), while in (b) it is in logarithmic units. Sample concentrations are (1): 0 mM Fe (pure Milli-Q water), (2): 0.93 mM Fe, (3): 0. 37 mM Fe, (4): 0.14 mM Fe, (5): 0.06 mM Fe, (6): 0.04 mM Fe, and (7): 0.01 mM Fe.
The T-weighted signal intensity on the MR image is determined by both T1 and T2 relaxation times according to the formula36: Where I is the signal intensity and ρ is the proton density.
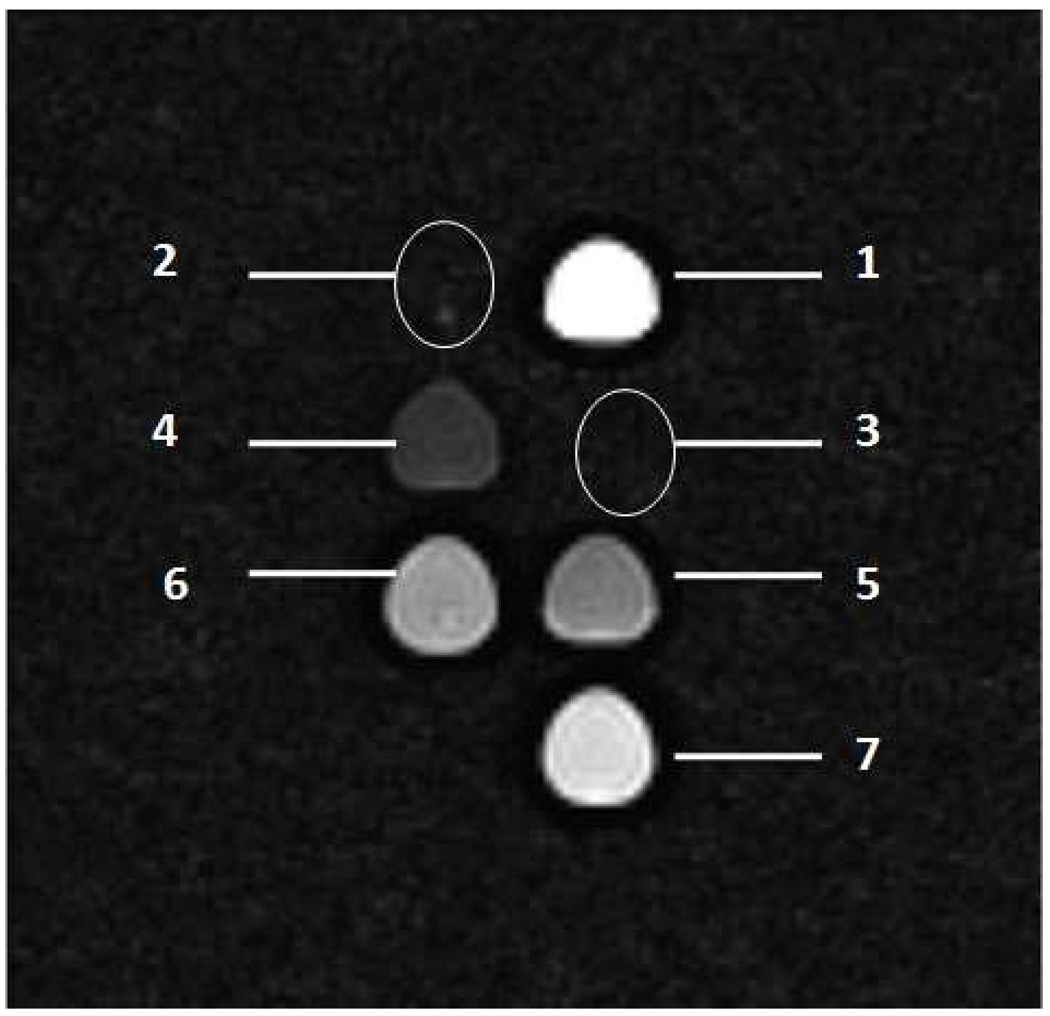
The MRI contrast can be optimized by changing the pulse sequence parameters. The two most important parameters are the repetition time (TR) and the echo time (TE).37–38 The TR is the time between consecutive 90-degree radio frequency (RF) pulse, while the TE is the time between the initial 90-degree RF pulse and the echo. By choosing a short TR and a short TE, the MRI intensity becomes independent of T2 in which case the image becomes T1-weighted. Similarly, a T2-weighted image can be obtained by imaging at long TR and long TE times. In a typical MR image, the T1 MR signal will become brighter with increasing iron concentration, whereas the T2 MR signal will become darker.39 To further validate our findings on the r2 efficiency of the samples studied in contrasting MRI images, a T2 weighted MR image is shown in Figure 3. It can be easily seen that for a sample concentration of 0.14 mM Fe (Fig. 3, sample 4), good contrast in the T2-weighted images is obtained, while at higher concentration the signal is quenched and barely detectable above background (Fig. 3, samples 2 and 3).
Figure 3.
T2 -weighted image (sample 2 and 3 spots are circled because the intensities are as low as the background signal due to the high T2 effect of the NPs in water). The sample concentrations are the same as those of the caption to Figure 2.
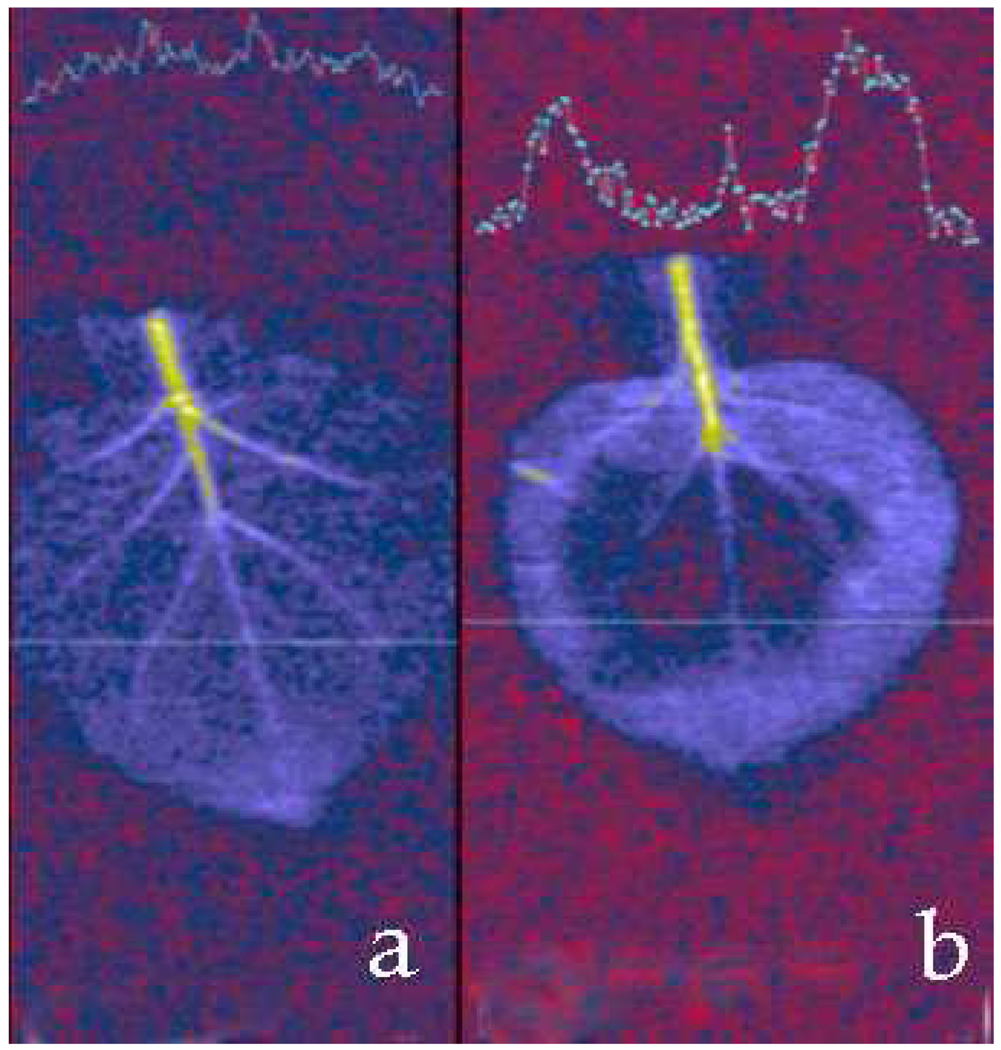
Figure 4 shows a control sample and a NP injected leaf. Both were soaked in water right before measurements to enhance the contrast: water brings up the background while NPs provide negative contrast. The area spread corresponding to the magnetic NP diffusion is easily discernable as a negative contrast area even in a large bore clinical 3T MRI scanner. Therefore, the images of the samples as thin as N. benthamiana leaves (200–300 microns) showed sufficient contrast to locate the NPs at concentrations below 1 mM Fe (~1012 particles/cm3).
Figure 4.
(a) T2-weighted MR image (repetition time 3 s, echo time 37 ms) of N. benthamiana leafs before (a) and after (b) infiltration with HOOC-PEG-PL-coated 18.6 nm cubic NPs. A cross section of the MRI map is shown on the top part of each image illustrating contrast enhancement induced through NPs infiltration.
BMV Protein Self-assembly around the HOOC-PEG-PL Coated Cubic NPs
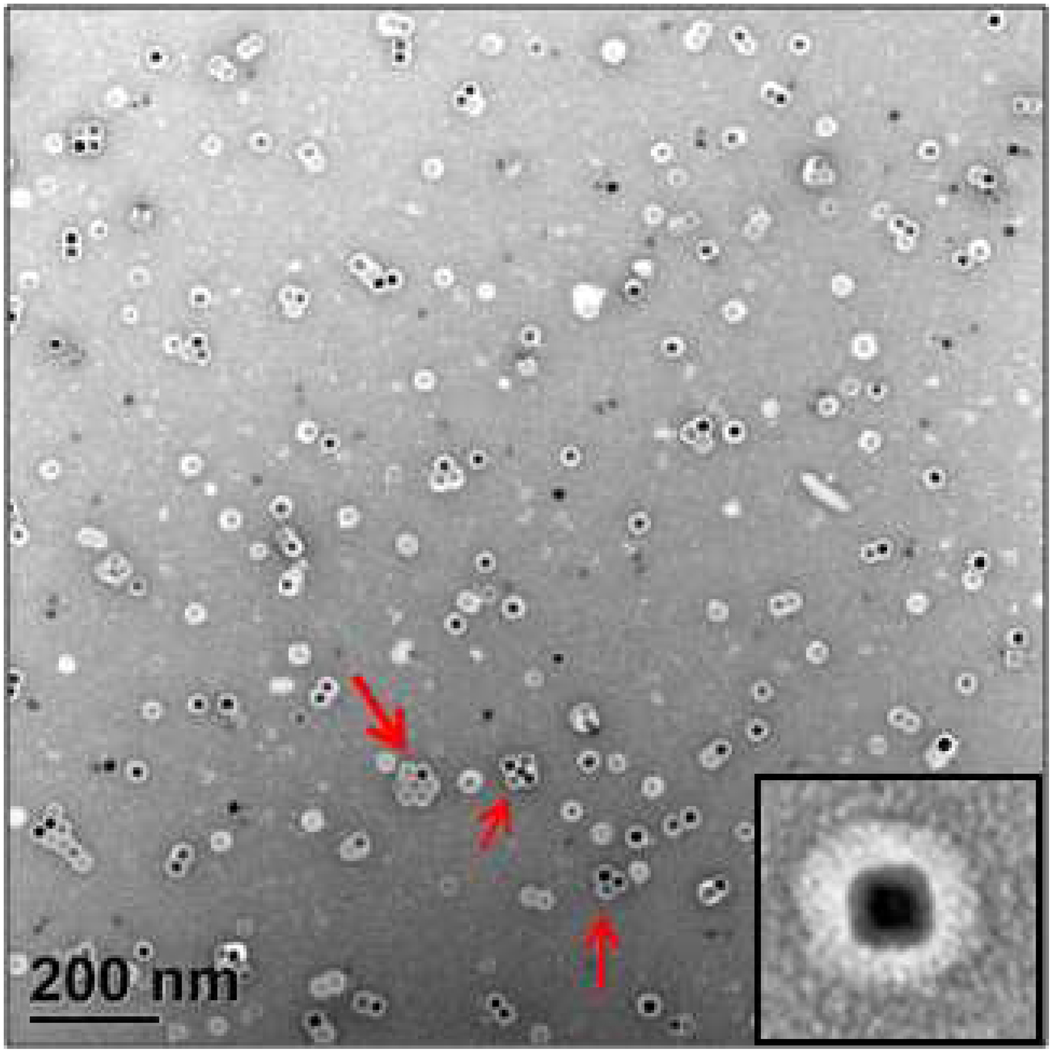
Figure 5 presents a TEM micrograph of VNPs formed by self-assembling of BMV coat protein subunits around 18.6 nm iron oxide cores covered with HOOC-PEG-PL. The VNP mean diameter is 36.5 nm at 6.2% relative standard deviation. The efficiency of encapsulation,40 evaluated from TEM micrographs as the ratio of well-defined single VNPs to the total number of NPs, is around 80%. We believe that high efficiency is due to high HOOC-PEG-PL ligand (charge) density on the flat NP surfaces. We also observed the trend of cubic NPs to aggregate due to enhanced contact between flat NP faces. Virus proteins also coat these NP clusters (indicated by red arrows in Fig. 5). A hydrodynamic VNP diameter of 58 nm obtained from DLS data (Fig. 3S, Supporting Information) is noticeably higher than the measured diameter of a single VNP obtained from the TEM images (36.5 nm), suggesting the existence of clusters in solution (not only on the TEM grid).
Figure 5.
Negatively stained TEM image of VNPs formed by self-assembling BMV proteins around the 18.6 nm cubic NPs coated with HOOC-PEG-PL. The dark spots are iron oxide NPs. Light rings around NPs are BMV shells including the HOOC-PEG-PL shells. The red arrows illustrate possibly pre-assembled VNP clusters. Inset shows a higher magnification image of a single VNP.
An intriguing feature of assembly is that despite its cubic core, the VNP protein coat has a quasi-spherical (probably, icosahedral) appearance, (Fig. 5, inset). To the best of our knowledge, this is the first direct illustration of the BMV capsid resilience to significant morphological core constraints. This feature may be an indication of a core-protein interaction mainly limited to the flexible N-termini of the protein, while structural domains remain unaffected by the core presence.
Due to the high relaxivity of the iron oxide NPs, along with the innate biocompatibility of virus capsids and the possibility of further modifying the capsid surface sites, superparamagnetic VNPs are promising candidates for enhanced MRI contrast agents, which may allow monitoring the systemic movement of VNPs as mimics for virus transit. Whether the mimic role is indeed achieved will be a question for future studies. Here we take a first step in this direction by presenting next the comparison between the transit of magnetic NPs and VNPs in N. benthamiana leaves using sectioned leaves viewed by electron microscopy.
Comparison of the Transit of Iron Oxide NPs Coated with HOOC-PEG-PL and VNPs in Leaves at Subcellular and Cellular Levels
VC proteins are known to facilitate transport of viral genomes within plants.41–43 However, it is unknown whether VNPs with inorganic cores (in particular, iron oxide cores) behave in a similar way or the same behavior can be observed for merely biocompatible (HOOC-PEG-PL coated) iron oxide NPs. In order to learn whether VNPs offer any advantages in particle transport inside a plant, we designed a comparative study of the transport of these two kinds of particles in N. benthamiana leaves.
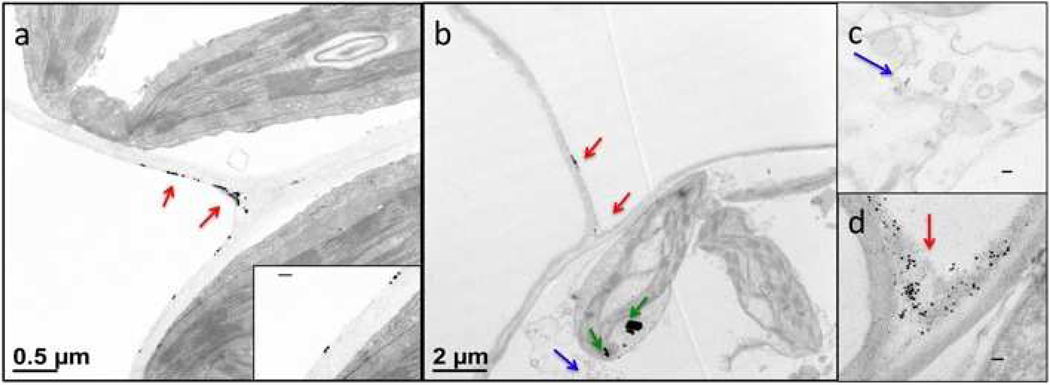
Details of the infiltration of the intact plants with iron oxide NPs and VNPs (Fig. S4, Supporting Information) are given in the Experimental Section. The iron oxide cores provide high contrast in the electron microscope due to the high electron density of iron, while their cubic shape allows for easy identification. The examination of stained thin leaf sections under TEM showed that the majority of iron oxide NPs was found in the intercellular void space of the leaves at cell junctions known as the plant apoplast. Cubic NPs were not detected inside the other plant cells (Fig. 6a). Magnetic VNPs also accumulated at the cell junctions of the intercellular space (Fig. 6b and d) with a distinctive difference: some of the particles were found to have entered the other plant cells, as shown in Fig. 6b and c.
Figure 6.
Stained TEM images of histological preparations of leaf sections. (a) Iron oxide NPs attached to the exterior of the cell wall in the apoplast; red arrows indicate the iron oxide NPs while the enlarged inset shows cubic particles sticking to the cell wall. (b) Magnetic VNPs after entering the plant leaf also gathered at the cell junctions of the apoplast (red arrows) but some particles were present within plant cells (blue arrow). The dark spots inside the chloroplast are indicated by green arrows and are impurities in the staining solution which may have been confused for NPs, were it not for their specific shape. (c) Image of VNPs in the cytoplasm.. (d) Image of VNPs gathered at the cell junction area of the apoplast. All the scale bars in the insets are 100 nm.
Infiltration of both the iron oxide NP and VNP solutions should put both NPs and VNPs directly into intercellular spaces known as the apoplast. The particles become attached to the exterior of the cell wall and the VNPs could then enter the plant cells. Transportation of particles after penetrating the cell’s interior then occurs via plasmodesmata junctions. Plasmodesmata facilitates the transport of molecules that are less than 3 nm in diameter between neighboring cells, but can be upregulated to selectively enable movement of large macromolecules. It has been suggested that plant virus CPs can dilate these microscopic channels and therefore assist the VNP entry and passage through the plasmodesmata to plant cells.41–43 Some VNPs were found near the cell nucleus (Fig. 6c). These results suggest that when BMV VCs encapsulate iron oxide NPs instead of the native genome, the BMV CPs may maintain functions enabling cell-to-cell virus trafficking in plants.
Comparison of the Long-range Transport of Iron Oxide NPs and VNPs in Plant Leaves
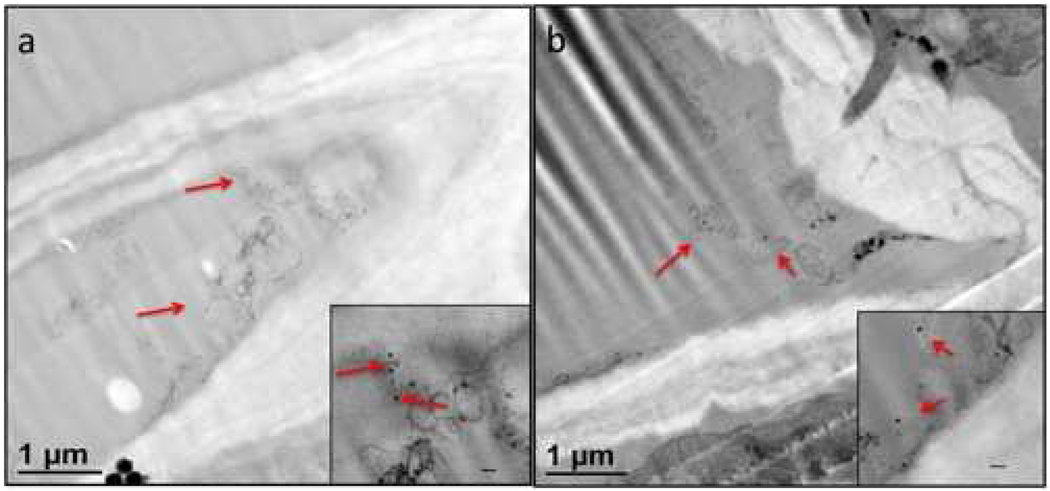
Vascular tissue in plants mainly consists of phloem, xylem, and associated parenchyma cells. Conducting tissue of the xylem represents the principle water conducting tissue for the transport of solutes throughout the plant. Phloem is the primary conduit for nutrients and macromolecules including sugars, hormones, proteins, nucleic acid, plant viruses, and viroids.44–47 To learn about the possible differences in the transport of iron oxide NPs and VNPs over long distances in the plant vascular system, the particle solutions were fed into the petiole of a carefully detached N. benthamiana leaf which was kept in an appropriate physiological buffer, light and humidity conditions to remain fresh (Fig. S5, Supporting Information).). Leaf segments were dissected surrounding the primary, secondary and tertiary veins to determine the extent of the NPs and VNP transport in the vascular system. We detected both kinds of particles mainly in the phloem and xylem (Fig. 7).
Figure 7.
Magnetic VNPs in (a) phloem and (b) xylem after 25 °C incubation for 24 hr. Insets show enlarged images, scale bars are 100 nm. Red arrows indicate VNPs.
VNPs were observed at the distal edge of leaves, having traveled through the primary and secondary veins for 24 hr (Fig. S6, the Supporting Information); only a few particles were found in tertiary veins. No differences were observed in the transit rate between iron oxide NPs and VNPs when the leaves were incubated at room temperature after 24 h.
However, when leaves were incubated at 6 °C, we noted striking differences between the transit of the two kinds of particles. After 48 hrs of exposure to the feeding solution at 6 °C, numerous VNPs were detected up to the distal edge of the leaf blade (position 5, Fig. S7, Supporting Information) while only a few iron oxide NPs were found in the positions 1 and 2 along the petiole (Fig. S7, Supporting Information). These results strongly suggest that viral coats could facilitate NP transit along plant veins, consistent with the expected roles of the capsid protein in mediating cell-to-cell and systemic spread of virus in an infected plant.48–49 In ref. 50 control of systemic movement function by intergenic complete substitution of a plant virus CP gene was demonstrated. However, the mechanisms by which a CP contributes to systemic transport remains to be clarified. These findings provide further support of the idea that BMV CP may have evolved to assist with the intravascular long-distance movement of virions.
Conclusion
Cubic iron oxide NPs coated with HOOC-PEG-PL display excellent MRI response as a T2-weighted MRI contrast agent, surpassing commercially available MRI agents. Despite their cubic shape, these NPs nucleate formation of regular VNPs with high incorporation efficiency and solution stability. Comparison of cell-to-cell trafficking of NPs and VNPs demonstrates that the HOOC-PEG-PL coated NPs are found in the intercellular void space attached to the cell wall, while VNPs penetrate the cells and are found in the cytoplasm. For the long-range transport, VNPs can be carried to a distal edge of the leaf even at 6 °C, while the HOOC-PEG-PL coated NP transport is limited to a low part of the petiole. These examples demonstrate that VCs provide exclusive cell-to-cell trafficking and long-range transport in N. benthamiana leaves. Furthermore, the BMV capsid protein as well as the N-terminal arginine-rich sequence were recently demonstrated to be able to traverse cell membranes and deliver both recombinant protein and RNA into plant leafs.44 Our studies further expand the utility of BMV capsids as a way to deliver foreign materials into plant cells. This study also demonstrates the high promise of VNPs as MRI probes and provide proof of principle studies to monitor the physiological processes important for plant growth and development using VNPs.
Experimental Section
Materials
FeCl3·6H2O (98%) and eicosane (99%) were purchased from Sigma-Aldrich and used as received. Hexanes (85%), ethanol (95%), and acetone (99.78%) were purchased from EMD Chemicals and used as received. Chloroform (Mallinckrodt, 100%), oleic acid (TCI, 95%), and oleic acid sodium salt (TCI, 97%) were used without purification. 1,2-Distearoyl-sn-Glycero-3-Phosphoethanolamine-N-[Carboxy(Polyethylene Glycol)2000] (Ammonium Salt) (HOOC-PEG-PL, 2000 Da PEG (Avanti, 99%) were used as received. Nutrition liquid concentrate Grow™ 7-9-5 (a fertilizer) was bought from from Dyna-Gro. Capsid proteins (CPs) were obtained from BMV produced in N. benthamiana plants. Purification of virus proteins was described in our preceding papers.4, 51
Iron Oxide NP Synthesis, Functionalization with HO-PEG-PL, and VNP Formation
The synthesis of cubic iron oxide NPs with 18.6 nm diameter is described in our preceding paper.26 Functionalization of NPs with HOOC-PEG-PL was described elsewhere.7 In a typical experiment, VNPs were formed by mixing one equivalent of 18.6 nm cubic NPs with 540 equivalents of capsid monomers in TNKM buffer (50 mM Tris base + 50 mM NaCl + 10 mM KCl +5 mM MgCl2, pH 7.4) in a total volume of 100 µL. The mixture was dialyzed against 100 mL of SAMA buffer (50 mM Na(OAc) + 8 mM Mg(OAc)2, pH 4.5) at 4 °C for 24 hrs. The reassembled VNP samples were kept at 4 °C.
Sucrose cushion purification could be applied when necessary, to further purify the VNP solution if excess virus proteins remained in solution. The VNP solution (100 µL) was layered on top of 200 µL of 10% sucrose SAMA solution in a 1.5 mL centrifuge vial. After 30 min centrifugation at 9,000 g the supernatant containing free proteins, small amino acids and protein aggregates was removed and the VNPs were collected as a pellet and re-suspended in 100 µL of the SAMA buffer for storage.
Characterization
Dynamic Light Scattering (DLS)
DLS measurements were carried out with a Zetasizer Nano-S (Malvern Instruments). Sample preparation for DLS included dilution, sonication for about 10–20 min, and filtration with a 0.2 µm syringe filter (Millipore). Measurement duration was set to be determined automatically, and data were averaged from at least three runs. Intensity and volume distributions of the particle sizes were recorded.
Attenuated Total Reflectance FTIR Spectroscopy
Attenuated Total Reflectance (ATR) FTIR spectroscopy of functionalized magnetic NPs was recorded with a Nicolet Magna-IR 550 spectrometer. Standard solutions with different concentrations of COOH-PEG-PL were placed on a silicon crystal prism, evaporated, and examined by ATR-FTIR. A linear calibration curve of the intensity of a band characteristic of carbonyl groups (around 1700 cm−1) vs. concentration of the lipid solution was plotted.7 The amount of the HOOC-PEG-PL molecules on the NP surface was determined for each sample using ATR-FTIR spectroscopy. The intensity of the carbonyl band was compared with the calibration curve to derive the weight concentration of the ligands on the NPs. Ligand-density on each particle was calculated by dividing the number concentration of ligands by a number concentration of particles (measured and calculated by UV-VIS spectroscopy).
Sample Concentration Analysis by UV-VIS Spectroscopy
UV-Vis absorption of a series of standard chloroform solutions of iron oxide NPs with predetermined concentrations was measured at I = 300 nm using a Cary 100 Bio spectrophotometer (Varian) to plot a calibration curve of intensity versus concentration. The extinction coefficient calculated from the calibration curve was 14.25 (g/l)−1(cm)−1. To determine the concentration of the target solution, its absorption was measured at the same wavelength and weight concentration was derived using the Lambert-Beer’s law. To calculate the number concentration, the weight of a single NP was calculated based on its diameter (from the TEM size analysis) and density for FeO (5.7 g/cm3).7
To find the concentration of BMV proteins, UV-VIS absorption was performed on the protein solution using a NanoDrop® ND-1000 UV-Vis spectrophotometer. Absorbance at 280 nm was used to find the concentration of proteins using Lambert-Beer’s law. The extinction coefficient of the protein was taken as 0.82 (g/l)−1(cm)−1.7
Transmission Electron Microscopy (TEM) Imaging
Electron-transparent NP specimens for TEM were prepared by placing a drop of dilute solution onto a carbon-coated Cu grid. Images were acquired at an accelerating voltage of 80 kV on a JEOL JEM1010 transmission electron microscope. Images were analyzed with the National Institute of Health developed image-processing package ImageJ to estimate NP diameters. Between 150 and 300 NPs were used for this analysis.
The VNP sample preparation for TEM started with 10 µL of the capsid solution being dropped on a carbon-coated copper grid. After 10 min, the excess solution was removed with filter paper. 10 µL of saturated uranyl acetate was dropped onto the grid to stain the viruses. After 10 min, the excess solution was removed with filter paper. The sample was then left to air dry for several minutes.
Magnetic Measurements
Magnetic measurements were carried out using a Quantum Design MPMS XL magnetometer. Zero-field cooling (ZFC) curves were taken by cooling the sample in null field (+/− 0.1 Oe) down to 4.5 K, applying a 50 Oe field, and then measuring the magnetization in regular temperature increments up to 300 K. For the Field Cooling (FC) curves, the samples were cooled in the 50 Oe field to 4.5 K and magnetization measurements were repeated in regular temperature increments up to 300 K.
Relaxivity Measurements
The T1 and T2 relaxation times(s) were measured for different concentrations of HOOC-PEG-PL coated 18.6 nm cubic iron oxide NPs using a 3 Tesla magnetic resonance (MR) scanner (Magnetom Trio, Siemens Medical Solutions, Erlangen, Germany). The different concentrations of the samples were prepared by diluting them with milli-Q water (resistance 18.2 MΩ). T1-weighted images were obtained by Turbo spin echo sequence with inversion recovery. TR/TE = 15000/12 ms, TI = 100, 200, 400, 800, 1600, 3200, 4000, 5000, 6000, 10000. Turbo factor = 7, slice thickness = 3 mm, matrix 128×128, field of view = 60 mm. T2-weighted images were obtained with spin echo sequence. TR = 3000 ms, TE = 11, 22, 44, 88, 176, 352, 700 ms. slice thickness = 3 mm, matrix 128×128, field of view = 60 mm. The r1 and r2 relaxivities (mM−1s−1) were calculated from the slope of the linear plots of (1/T1(sample) - 1/T1(solvent)) and (1/T2(sample) - 1/T2(solvent)) vs. Fe ion concentrations. (1/T1(solvent) and 1/T2(solvent) corresponded to the relaxation times of milli-Q water; 1/T1(sample) and 1/T2(sample) are the relaxation times of samples with a different concentration of the HOOC-PEG-PL coated iron oxide NPs)
MRI Scans of the Plant Leaves
To prepare leaf samples for MRI scanning, the plant leaf of N. benthamiana were humidified in milli-Q water and fixed between two square-shaped Plexiglas Acrylic sheets. The edge of the Acrylic sheets/leaf sandwich was carefully sealed with a film of poly(vinyl alcohol) to keep the leaf humid during measurements. The as-prepared leaf was scanned at turbo spin-echo sequence using a clinical 3 Tesla MR scanner (Magnetom Trio, Siemens Medical Solutions, Erlangen, Germany). Scan parameters were: TR (repetition time) = 3000 ms and TE (echo time) = 37 ms, slice thickness = 6 mm, number of averages = 10, field of view = 140 mm, phase field of view = 70 mm; matrix 256×128, bandwidth = 130 Hz/pixel, echo train length = 7.
Plant sample preparation method
N. benthamiana Growth Conditions
N. benthamiana plants were grown from in-house produced seeds in a growth chamber with 26/22 °C day/night temperature cycles and 16-h-light/8-h-dark cycles. For each set of experiments, we used 6-to 8-week-old plants that were typically at the six-leaf stage.
Plant Leaves Infiltrations
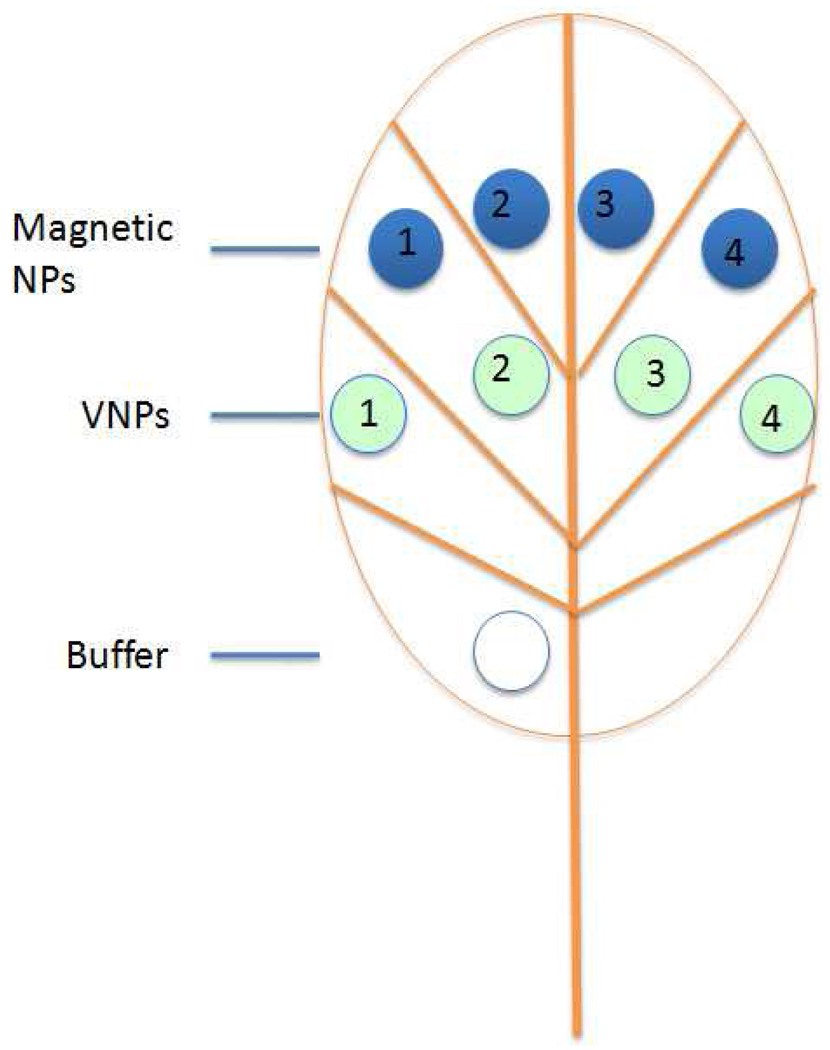
To test functionalized magnetic NPs as contrast agent for plant MRI studies, 18.6 nm cubic NPs coated with HOOC-PEG-PL were dissolved in infiltration buffer (10 mM MgCl2 and 10 mM MES, pH 5.9). N. benthamiana leaves were infiltrated on the abaxial side using a 1 mL needleless syringe. Infiltrated zone boundaries corresponded to a lower lateral vein, the midvein, the edge of the leaf, and either the leaf tip or an upper lateral vein (Scheme 1).
Scheme 1.
Sample infiltration pattern of magnetic NPs (blue zones) and VNPs (green zones) in N. benthamiana plant leaves. Blue and green zones 1–4 were infiltrated with 0.5 mg/mL, 0.25 mg/mL, 0.1 mg/mL, and 0.05 mg/mL of NPs or VNPs. A single zone near the base of the leaf was infiltrated with the infiltration buffer (10 mM MgCl2 and 10 mM MES, pH 5.9) as control.
To learn about particle intercellular transport at different concentrations, magnetic NP or VNP solutions were infiltrated in N. benthamiana leaves of intact plants according to the pattern shown in Scheme 1. The concentrations of magnetic NP and VNP samples applied in zones 1–4 were 0.5 mg/mL, 0.25 mg/mL, 0.1 mg/mL, and 0.05 mg/mL. The same pattern was applied to two adjacent leaves on one plant and to two different plants. Following infiltration, the plants were kept in a growth chamber for 24 hr before the samples were taken for histology sectioning and study.
NP and VNP Uptake via the Cut Petioles
To compare the NP and VNP transport in the plant vascular system, adjacent leaves of approximately the same size from the same plant were chosen for each set of experiments. The leaves were submerged in water to avoid air-blocking of the leaf vascular structure and then cut at the base of the petiole using a sharp, sterile razor blade. Leaves were carefully transferred into a 2 mL Eppendorf vial containing magnetic NPs or VNPs suspended in 1.8 mL of a fertilizer (the final concentration in each Eppendorf vial was ~ 0.1 mg/mL normalized by the Fe concentration) and sealed with Parafilm around the leaf petiole to reduce evaporation during the experiment. The cut leaves in the Eppendorf vials were maintained in a growth chamber under normal growth conditions or at a low temperature (6 °C). Finally, for result replication, adjacent leaves from the same plant and of approximately the same size were chosen for each set of experiments.
Leaf Tissue Embedding, Sectioning, and Transmission Electron Microscopy
Samples of N. Benthamiana leaves (six for each leaf) were cut out from the petiole and the primary, secondary, and tertiary veins. The samples were fixed in 3 % glutaraldehyde in 0.05 M phosphate buffer at pH 6.8 and 4 °C for 15 minutes under vacuum and then overnight on the lab bench at room temperature. Following fixation, samples were rinsed with 0.05 M sodium phosphate buffer (pH 6.8), post-fixed in 1 % osmium tetroxide at 4 °C for 90 min, and dehydrated by passage through a graded ethanol series. Samples were infiltrated and embedded in low viscosity epoxy resin52 polymerized at 65 °C, and sectioned with a Sorvall, Inc. Porter-Blum MT-2 ultramicrotome. Ultrathin sections (~70 nm) were stained with saturated aqueous uranyl acetate, followed by lead citrate, and examined using a JEOL JEM-1010 transmission electron microscope at an accelerating voltage of 80 kV. Images were acquired using a Gatan MegaScan Camera Model 794/20.
Supplementary Material
ACKNOWLEDGMENT
This work has been supported, in part, by NSF award 0631982, NIH award GM081029, R01AI090280-01, NSF award 0220560, and the IU FRSP grant. B.D. acknowledges partial support from the Indiana METACyt Initiative of Indiana University, funded in part through a major grant from the Lilly Endowment, Inc. L.B. thanks the Federal Program “Scientists and Educators of Innovative Russia” 2009–20013, contract #14.740.11.0380. We also thank the IU Nanoscale Characterization Facility and the IU imaging facility at the Department of Psychological and Brain Sciences for access to the instrumentation. J.V. acknowledges support from OCAST PSB09-028.
Footnotes
Supporting Information Available: Description of magnetic properties of cubic iron oxide NPs and their relaxivity data, DLS of VNPs, iron oxide NP and VNP transit in plants (photographs of leaf feeding, TEM images of cross-sections, the NP and VNP uptake chart). This material is available free of charge via the Internet at http://pubs.acs.org.
References
- 1.Douglas T, Young M. Host-Guest Encapsulation of Materials by Assembled Virus Protein Cages. Nature. 1998;393:152–155. [Google Scholar]
- 2.Smith LM, Pontes O, Searle I, Yelina N, Yousafzai FK, Herr AJ, Pikaard CS, Baulcombe DC. An Snf2 Protein Associated with Nuclear Rna Silencing and the Spread of a Silencing Signal between Cells in Arabidopsis. Plant Cell. 2007;19:1507–1521. doi: 10.1105/tpc.107.051540. [DOI] [PMC free article] [PubMed] [Google Scholar]
- 3.Stephanidis B, Adichtchev S, Gouet P, McPherson A, Mermet A. Elastic Properties of Viruses. Biophys. J. 2007;93:1354–1359. doi: 10.1529/biophysj.107.109033. [DOI] [PMC free article] [PubMed] [Google Scholar]
- 4.Dragnea B, Chen C, Kwak E-S, Stein B, Kao CC. Gold Nanoparticles as Spectroscopic Enhancers for in Vitro Studies on Single Viruses. J. Am. Chem. Soc. 2003;125:6374–6375. doi: 10.1021/ja0343609. [DOI] [PubMed] [Google Scholar]
- 5.Douglas T, Strable E, Willits D, Aitouchen A, Libera M, Young M. Protein Engineering of a Viral Cage for Constrained Nanomaterials Synthesis. Adv. Mater. 2002;14:415–418. [Google Scholar]
- 6.Dixit SK, Goicochea NL, Daniel M-C, Murali A, Bronstein L, De M, Stein B, Rotello VM, Kao CC, Dragnea B. Quantum Dot Encapsulation in Viral Capsids. Nano Lett. 2006;6:1993–1999. doi: 10.1021/nl061165u. [DOI] [PubMed] [Google Scholar]
- 7.Huang X, Bronstein LM, Retrum JR, Dufort C, Tsvetkova I, Aniagyei S, Stein B, Stucky G, McKenna B, Remmes N, et al. Self-Assembled Virus-Like Particles with Magnetic Cores. Nano Lett. 2007;7:2407–2416. doi: 10.1021/nl071083l. [DOI] [PubMed] [Google Scholar]
- 8.Loo L, Guenther RH, Lommel SA, Franzen S. Encapsidation of Nanoparticles by Red Clover Necrotic Mosaic Virus. J. Amer. Chem. Soc. 2007;129:11111–11117. doi: 10.1021/ja071896b. [DOI] [PubMed] [Google Scholar]
- 9.Sun J, DuFort C, Daniel M-C, Murali A, Chen C, Gopinath K, Stein B, De M, Rotello VM, Holzenburg A, et al. Core-Controlled Polymorphism in Virus-Like Particles. Proc. Nation. Acad. Sci. USA. 2007;104:1354–1359. doi: 10.1073/pnas.0610542104. [DOI] [PMC free article] [PubMed] [Google Scholar]
- 10.Gilbert L, Toivola J, Lehtomaki E, Donaldson L, Kapyla P, Vuento M, Oker-Blom C. Assembly of Fluorescent Chimeric Virus-Like Particles of Canine Parvovirus in Insect Cells. Biochem. Biophys. Res. Commun. 2004;313:878–887. doi: 10.1016/j.bbrc.2003.11.176. [DOI] [PubMed] [Google Scholar]
- 11.Liepold L, Anderson S, Willits D, Oltrogge L, Frank JA, Douglas T, Young M. Viral Capsids as Mri Contrast Agents. Magn. Reson. Med. 2007;58:871–879. doi: 10.1002/mrm.21307. [DOI] [PubMed] [Google Scholar]
- 12.Prasuhn DE, Yeh RM, Obenaus A, Manchester M, Finn MG. Viral Mri Contrast Agents: Coordination of Gd by Native Virions and Attachment of Gd Complexes by Azide-Alkyne Cycloaddition. Chem. Commun. 2007:1269–1271. doi: 10.1039/b615084e. [DOI] [PubMed] [Google Scholar]
- 13.Douglas T, Young M. Viruses: Making Friends with Old Foes. Science. 2006;312:873–875. doi: 10.1126/science.1123223. [DOI] [PubMed] [Google Scholar]
- 14.Guo S, Huang F, Guo P. Construction of Folate-Conjugated Prna of Bacteriophage Phi29 DNA Packaging Motor for Delivery of Chimeric Sirna to Nasopharyngeal Carcinoma Cells. Gene Ther. 2006;13:814–820. doi: 10.1038/sj.gt.3302716. [DOI] [PMC free article] [PubMed] [Google Scholar]
- 15.Rae CS, Khor IW, Wang Q, Destito G, Gonzalez MJ, Singh P, Thomas DM, Estrada MN, Powell E, Finn MG, et al. Systemic Trafficking of Plant Virus Nanoparticles in Mice via the Oral Route. Virology. 2005;343:224–235. doi: 10.1016/j.virol.2005.08.017. [DOI] [PubMed] [Google Scholar]
- 16.Schiller JT, Lowy DR. Papillomavirus-Like Particle Vaccines. J. Natl. Cancer Inst. Monogr. 2001:50–54. doi: 10.1093/oxfordjournals.jncimonographs.a024258. [DOI] [PubMed] [Google Scholar]
- 17.Singh P, Prasuhn D, Yeh RM, Destito G, Rae CS, Osborn K, Finn MG, Manchester M. Bio-Distribution, Toxicity and Pathology of Cowpea Mosaic Virus Nanoparticles in Vivo. J. Control. Release. 2007;120:41–50. doi: 10.1016/j.jconrel.2007.04.003. [DOI] [PMC free article] [PubMed] [Google Scholar]
- 18.Koutsky LA, Ault KA, Wheeler CM, Brown DR, Barr E, Alvarez FB, Chiacchierini LM, Jansen KU. A Controlled Trial of a Human Papillomavirus Type 16 Vaccine. N. Engl. J. Med. 2002;347:1645–1651. doi: 10.1056/NEJMoa020586. [DOI] [PubMed] [Google Scholar]
- 19.Ding B, Itaya A, Qi Y. Symplasmic Protein and Rna Traffic: Regulatory Points and Regulatory Factors. Curr. Opin. Plant Biol. 2003;6:596–602. doi: 10.1016/j.pbi.2003.09.010. [DOI] [PubMed] [Google Scholar]
- 20.Foster TM, Lough TJ, Emerson SJ, Lee RH, Bowman JL, Forster RL, Lucas WJ. A Surveillance System Regulates Selective Entry of Rna into the Shoot Apex. Plant Cell. 2002;14:1497–1508. doi: 10.1105/tpc.001685. [DOI] [PMC free article] [PubMed] [Google Scholar]
- 21.Gisel A, Barella S, Hempel FD, Zambryski PC. Temporal and Spatial Regulation of Symplastic Trafficking During Development in Arabidopsis Thaliana Apices. Development. 1999;126:1879–1889. doi: 10.1242/dev.126.9.1879. [DOI] [PubMed] [Google Scholar]
- 22.Haritatos E, Medville R, Turgeon R. Minor Vein Structure and Sugar Transport in Arabidopsis Thaliana. Planta. 2000;211:105–111. doi: 10.1007/s004250000268. [DOI] [PubMed] [Google Scholar]
- 23.Kuhn C, Franceschi VR, Schulz A, Lemoine R, Frommer WB. Macromolecular Trafficking Indicated by Localization and Turnover of Sucrose Transporters in Enucleate Sieve Elements. Science. 1997;275:1298–1300. doi: 10.1126/science.275.5304.1298. [DOI] [PubMed] [Google Scholar]
- 24.Rez G, Csak J, Fellinger E, Laszlo L, Kovacs AL, Oliva O, Kovacs J. Time Course of Vinblastine-Induced Autophagocytosis and Changes in the Endoplasmic Reticulum in Murine Pancreatic Acinar Cells: A Morphometric and Biochemical Study. Europ. J. Cell Biol. 1996;71:341–350. [PubMed] [Google Scholar]
- 25.Nair R, Varghese SH, Nair BG, Maekawa T, Yoshida Y, Kumar DS. Nanoparticulate Material Delivery to Plants. Plant Sci. 2010;179:154–163. [Google Scholar]
- 26.Bronstein LM, Huang X, Retrum J, Schmucker A, Pink M, Stein BD, Dragnea B. Influence of Iron Oleate Complex Structure on Iron Oxide Nanoparticle Formation. Chem. Mater. 2007;19:3624–3632. [Google Scholar]
- 27.Dubertret B, Skourides P, Norris DJ, Noireaux V, Brivanlou AH, Libchaber A. In Vivo Imaging of Quantum Dots Encapsulated in Phospholipid Micelles. Science. 2002;298:1759–1762. doi: 10.1126/science.1077194. [DOI] [PubMed] [Google Scholar]
- 28.Nitin N, LaConte LEW, Zurkiya O, Hu X, Bao G. Functionalization and Peptide-Based Delivery of Magnetic Nanoparticles as an Intracellular Mri Contrast Agent. J. Biol. Inorg. Chem. 2004;9:706–712. doi: 10.1007/s00775-004-0560-1. [DOI] [PubMed] [Google Scholar]
- 29.Lim YT, Lee KY, Lee K, Chung BH. Immobilization of Histidine-Tagged Proteins by Magnetic Nanoparticles Encapsulated with Nitrilotriacetic Acid (Nta)-Phospholipids Micelle. Biochem. Biophys. Res. Comm. 2006;344:926–930. doi: 10.1016/j.bbrc.2006.03.209. [DOI] [PubMed] [Google Scholar]
- 30.Xie J, Peng S, Brower N, Pourmand N, Wang SX, Sun S. One-Pot Synthesis of Monodisperse Iron Oxide Nanoparticles for Potential Biomedical Applications. Pure Appl. Chem. 2006;78:1003–1014. [Google Scholar]
- 31.Chen C, Daniel M-C, Quinkert ZT, De M, Stein B, Bowman VD, Chipman PR, Rotello VM, Kao CC, Dragnea B. Nanoparticle-Templated Assembly of Viral Protein Cages. Nano Lett. 2006;6:611–615. doi: 10.1021/nl0600878. [DOI] [PubMed] [Google Scholar]
- 32.Barick KC, Aslam M, Prasad PV, Dravid VP, Bahadur D. Nanoscale Assembly of Amine-Functionalized Colloidal Iron Oxide. J. Magn. Magn. Mater. 2009;321:1529–1532. doi: 10.1016/j.jmmm.2009.02.080. [DOI] [PMC free article] [PubMed] [Google Scholar]
- 33.Allen M, Bulte JWM, Liepold L, Basu G, Zywicke HA, Frank JA, Young M, Douglas T. Paramagnetic Viral Nanoparticles as Potential High-Relaxivity Magnetic Resonance Contrast Agents. Magn. Reson. Med. 2005;54:807–812. doi: 10.1002/mrm.20614. [DOI] [PubMed] [Google Scholar]
- 34.Ananta JS, Matson ML, Tang AM, Mandal T, Lin S, Wong K, Wong ST, Wilson LJ. Single-Walled Carbon Nanotube Materials as T2-Weighted Mri Contrast Agents. J. Phys. Chem. C Lett. 2009;113:19369–19372. [Google Scholar]
- 35.Laurent S, Forge D, Port M, Roch A, Robic C, Vander Elst L, Muller RN. Magnetic Iron Oxide Nanoparticles: Synthesis, Stabilization, Vectorization, Physicochemical Characterizations, and Biological Applications. Chem. Rev. 2008;108:2064–2110. doi: 10.1021/cr068445e. [DOI] [PubMed] [Google Scholar]
- 36.Lee VS. Cardiovascular Mri: Physical Principles to Practical Protocols. Philadelphia: Lippincott Williams & Wilkins; 2006. [Google Scholar]
- 37.Marshall I. Computational Simulations and Experimental Studies of 3d Phase-Contrast Imaging of Fluid Flow in Carotid Bifurcation Geometries. J. Magn. Reson. Imag. 2010;31:928–934. doi: 10.1002/jmri.22096. [DOI] [PubMed] [Google Scholar]
- 38.Bachmann R, Nassenstein I, Kooijman H, Dittrich R, Stehling C, Kugel H, Niederstadt T, Kuhlenbaumer G, Ringelstein EB, Kramer S, et al. High-Resolution Magnetic Resonance Imaging (Mri) at 3.0 Tesla in the Short-Term Follow-up of Patients with Proven Cervical Artery Dissection. Invest. Radiol. 2007;42:460–466. doi: 10.1097/01.rli.0000262758.98098.d6. [DOI] [PubMed] [Google Scholar]
- 39.Park JY, Daksha P, Lee GH, et al. Highly Water-Dispersible Peg Surface Modified Ultra Small Superparamagnetic Iron Oxide Nanoparticles Useful for Target-Specific Biomedical Applications. Nanotechnology. 2008;19:365603. doi: 10.1088/0957-4484/19/36/365603. [DOI] [PubMed] [Google Scholar]
- 40.Sun J, DuFort C, Daniel M-C, Murali A, Chen C, Gopinath K, Stein B, De M, Rotello VM, Holzenburg A, et al. Corecontrolled Polymorphism in Viruslike Particles. Proc. Nat. Acad. Sci. 2006;104:1354. doi: 10.1073/pnas.0610542104. [DOI] [PMC free article] [PubMed] [Google Scholar]
- 41.Scholthof HB. Plant Virus Transport : Motions of Functional Equivalence. Trends Plant Sci. 2005;10:376–382. doi: 10.1016/j.tplants.2005.07.002. [DOI] [PubMed] [Google Scholar]
- 42.Takeda A, Kaido M, Okuno T, Mise K. The C Terminus of the Movement Protein of Bromemosaic Virus Controls the Requirement for Coat Protein in Cell-to Cell Movement and Plays a Role in Long-Distance Movement. J. Gen. Virol. 2004;85:1751–1761. doi: 10.1099/vir.0.79976-0. [DOI] [PubMed] [Google Scholar]
- 43.Alzhanova DV, Napuli AJ, Creamer R, Dolja VV. Cell-to-Cell Movement and Assembly of a Plant Closterovirus: Roles for the Capsid Proteins and Hsp70 Homolog. EMBO J. 2001;20:6997–7007. doi: 10.1093/emboj/20.24.6997. [DOI] [PMC free article] [PubMed] [Google Scholar]
- 44.Nelson RS, Van Bel A. The Mystery of Virus Trafficking into, through,and out of Vascular Tissue. Prog. Bot. 1998;59:476–533. [Google Scholar]
- 45.Lucas WJ, Wolf S. Connections between Virus Movement, Macromolecular Signaling and Assimilate Allocation. Curr. Opin. Plant Biol. 1999;2:192–197. doi: 10.1016/S1369-5266(99)80035-1. [DOI] [PubMed] [Google Scholar]
- 46.Carrington JC, Whitham SA. Viral Invasion and Host Defense: Strategies and Counter-Strategies. Curr. Opin. Plant Biol. 1998;1:336–341. doi: 10.1016/1369-5266(88)80056-6. [DOI] [PubMed] [Google Scholar]
- 47.Carrington JC, Kasschau KD, Mahajan SK, Schaad MC. Cell-to-Cell and Long-Distance Transport of Viruses in Plants. Plant Cell. 1996;8:1669–1681. doi: 10.1105/tpc.8.10.1669. [DOI] [PMC free article] [PubMed] [Google Scholar]
- 48.Callaway A, Giesman-Cookmeyer D, Gillock ET, Sit TL, A LS. The Multifunctional Capsid Proteins of Plant Rna Viruses. Annu. Rev. Phytopathol. 2001;39:419–460. doi: 10.1146/annurev.phyto.39.1.419. [DOI] [PubMed] [Google Scholar]
- 49.Carrington JC, Dasschau KD, Mahajan SK, Schaad MC. Cell-to-Cell and Long-Distance Transport of Viruses in Plants. Plant Cell. 1996;8:1669–1681. doi: 10.1105/tpc.8.10.1669. [DOI] [PMC free article] [PubMed] [Google Scholar]
- 50.Callaway AS, George CG, Lommel SA. A Sobemovirus Coat Protein Gene Complements Long-Distance Movement of a Coat Protein-Null Dianthovirus. Virology. 2004;330:186–195. doi: 10.1016/j.virol.2004.09.037. [DOI] [PubMed] [Google Scholar]
- 51.Chen C, Daniel M-C, Quinkert ZT, De M, Stein B, Bowman VD, Chipman PR, Rotello VM, Kao CC, Dragnea B. Nanoparticle-Templated Assembly of Viral Protein Cages. Nano Lett. 2006;6:611–615. doi: 10.1021/nl0600878. [DOI] [PubMed] [Google Scholar]
- 52.Spurr AR. A Low-Viscosity Epoxy Resin Embedding Medium for Electron Microscopy. J. Ultrastruct. Res. 1969;26:31–43. doi: 10.1016/s0022-5320(69)90033-1. [DOI] [PubMed] [Google Scholar]
Associated Data
This section collects any data citations, data availability statements, or supplementary materials included in this article.


