Abstract
The mean corpuscular volume (MCV) of peripheral blood mononuclear cells (PBMCs) was determined by Coulter Counter, and data were used to calculate the intracellular drug concentrations. A total of 574 PBMC samples were collected from 190 patients. The MCV was 282.9 fl (minimum, 207.0; maximum, 354.6), with a standard deviation of 8.8%. Previous reports have often used a fixed value of 400 fl for the MCV, which may result in artificially low estimates of the intracellular concentrations of antivirals.
TEXT
A correlation between nonnucleoside reverse transcriptase inhibitor (NNRTI) and protease inhibitor (PI) plasma concentrations and efficacies has been described in several studies, but it has to be considered that almost all antiretroviral agents act within HIV-infected cells. Consequently, antiretroviral drug concentrations in peripheral blood mononuclear cells (PBMCs) could represent a more reliable measure of antiretroviral activity (2).
Several factors play a role in antiretroviral drug accumulation in PBMCs. Antiretroviral physiochemical characteristics affect intracellular diffusion of antiretrovirals, and lipophilic compounds have higher concentrations (6). Influx and efflux transporters are expressed on PBMC cellular membranes and present a high intersubject variability of expression and activity that influences intracellular concentrations (8).
Intracellular quantification of anti-HIV drugs requires sensitive instrumentation due to the very low concentrations present. Liquid chromatography coupled with mass spectrometry (LC-MS or MS-MS) has been used for the determination of drug concentrations in PBMCs, and numerous assays have been published (3, 4, 8, 10, 12). Intracellular concentration is generally expressed as the amount of drug per 106 cells; however, to evaluate the intracellular concentration/plasma concentration ratio, it is necessary to convert this to the amount of drug per volume unit of cells. An arbitrary mean corpuscular volume (MCV) of 400 fl for PBMCs is most frequently adopted to convert the results (1, 9, 13). Consequently, quantification of intracellular concentrations could be potentially biased by interindividual variability of the MCV of PBMCs.
The aim of this study was to analyze the MCVs of PBMC samples from a large group of patients infected with HIV by use of a Coulter Counter. The MCV population data are reported and discussed in relation to the adoption of the fixed value of 400 fl for the PBMC volume.
Two EDTA tubes of blood samples (12 to 15 ml) were taken from each HIV-positive patient receiving antiretroviral therapy after their written informed consent was obtained in accordance with local ethic committee requirements.
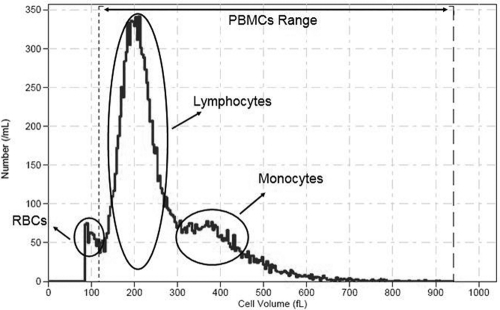
PBMCs were isolated from 12 to 14 ml of blood by Lymphoprep density gradient centrifugation (700 × g for 25 min at 4°C with a Jouan model BR4i centrifuge [Saint-Herblain, France]) as previously described (9). PBMCs were then quickly washed twice in 40 ml ice-cold phosphate-buffered saline (PBS) to prevent drug loss (6) and centrifuged (700 × g, 6 min, 4°C). During the last wash step, cell numbers and MCVs were determined by diluting 500 μl PBS cell suspension with 19.5 ml of Isoton solution in a beaker (twice) and using a Beckman Coulter Z2 (Instrumentation Laboratory, Milan, Italy) with the following settings: aperture diameter, 100 μm; 58.66 kDa; upper size limit, 12 μm; lower size limit, 5.5 μm. Eight counts for each sample (four for each beaker) were performed, and the final acquisition range was manually set for each sample to exclude the eventual red blood cell contamination (Fig. 1). Data were managed by Z2 AccuComp software (version 3.01).
Fig. 1.
Representative graph of PBMC distribution in a patient sample. Broken vertical lines mark the manually adopted range. Circles indicate the PBMC and red blood cell (RBC) populations.
The resulting pellet of washed PBMCs was dissolved with 1 ml extraction solution (methanol-water, 70:30 [vol/vol]), switched in two cryovials (500 μl each), and then stored at −80°C for subsequent high-pressure liquid chromatography (HPLC)-MS analysis with a fully validated method (5). The entire procedure took less than 1 h.
A total of 574 PBMC samples were collected from 190 patients, and clinical information for the patients is reported in Table 1.
Table 1.
General clinical information of patients
| Parameter | Value |
|---|---|
| No. of patients | 190 |
| No. (%) of Caucasians | 170 (90) |
| No. (%) of males | 124 (65) |
| Age (yr) [mean (range)] | 44 (19–79) |
| Wt (kg) [mean (range)] | 69 (39–116) |
| BMI (kg/m2) [mean (range)] | 23.6 (15.7–35.8) |
The mean MCV was 282.9 fl (minimum, 207.0; maximum, 354.6), with a standard deviation of 8.8%. The intrapatient MCV standard deviation was 3.6% (4 to 8 samples per 37 patients were collected for the area under the concentration-time curve [AUC] studies), and the interpatient MCV standard deviation was 5.0% (3 to 8 samples per 47 patients). No statistically significant association between the mean values for sex, age, and body mass index (BMI) and the MCVs was observed.
Concentration is, by definition, the amount of a substance in a given volume. Therefore, intracellular drug concentration corresponds to the ratio of the amount of drug inside the cell to the cell volume. In practice, where blood samples contain millions of PBMCs, the drug concentration in a certain number of PBMCs (N PBMCs) is the sum of the drug amounts in cells divided by the volume of the PBMCs. The last formula can be expressed in a simpler way by using the MCV, as follows: [N PBMCs] = (amount of drug in cells)/(MCV × N PBMCs).
Considering the final formula reported above, the evaluation of intracellular drug concentrations can be biased by errors in three different measurements: (i) the amount of the drug, usually determined by HPLC-MS or MS-MS; (ii) the number of PBMCs, usually counted using a Bürker/Malassez counting chamber and microscope; and (iii) the MCV, presumptively considered to be 400 fl. Therefore, to obtain accurate results, it is necessary to carefully evaluate all three variables.
Although quantitative analysis data are obtained through sophisticated and sensitive instruments, the PBMC counting and MCV data result from the use of no special or precise equipment.
The choice of 400 fl for the PBMC volume comes from the work of Gao et al. (7) that is directly or indirectly cited in several studies to justify data conversion. Gao et al. performed their experiments with quiescent or activated peripheral blood leukocytes (PBLs) stimulated with phytohemagglutinin (a mitogen agent) and, using a Coulter Counter, reported a volume of ≈0.25 μl per 106 cells for quiescent PBLs and ≈0.38 μl per 106 cells for stimulated PBLs.
Because PBMCs are a heterogeneous population of cells composed of lymphocytes and monocytes and are not activated in a physiological situation (which increases their volume), a value of 400 fl for the PBMC volume seems to be inappropriate. Moreover, an exhaustive study on the cellular volume of PBMCs (11) suggests mean volumes of 174 fl for lymphocytes and 339 fl for monocytes, in accordance with our data (data not shown).
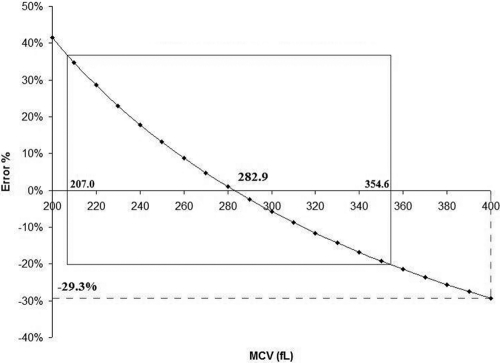
Assessment of the data using our MCV versus 400 fl produced a mean percent error of −29.3% (Fig. 2).
Fig. 2.
The percent error in measuring intracellular drug concentrations is inversely correlated to the error in MCV evaluation. Use of a 400-fl value for the MCV instead of our MCV produces a percent error of −29.3% in drug concentration data.
In our study, the MCV observed using a Coulter Counter was 282.9 fl, smaller than 400 fl. The use of 400 fl as a presumptive standard value of MCV and a manual cell count could significantly bias the methods of quantification, and as a result, previous reports may have potentially underestimated intracellular drug exposure. Moreover, it has to be noted that we detected an MVC ranging from 207.0 fl to 354.6 fl. Thus, MCV quantification should be performed for each patient.
Therefore, we suggest calculation of individual MCVs and automatic cell counting as more accurate and reliable tools to quantify intracellular antiretroviral drug concentrations.
Footnotes
Published ahead of print on 14 March 2011.
REFERENCES
- 1. Almond L. M., Hoggard P. G., Edirisinghe D., Khoo S. H., Back D. J. 2005. Intracellular and plasma pharmacokinetics of efavirenz in HIV-infected individuals. J. Antimicrob. Chemother. 56:738–744 [DOI] [PubMed] [Google Scholar]
- 2. Bazzoli C., et al. 2010. Intracellular pharmacokinetics of antiretroviral drugs in HIV-infected patients, and their correlation with drug action. Clin. Pharmacokinet. 49:17–45 [DOI] [PubMed] [Google Scholar]
- 3. Becher F., et al. 2003. A strategy for liquid chromatography/tandem mass spectrometric assays of intracellular drugs: application to the validation of the triphosphorylated anabolite of antiretrovirals in peripheral blood mononuclear cells. J. Mass Spectrom. 38:879–890 [DOI] [PubMed] [Google Scholar]
- 4. Colombo S., et al. 2005. Intracellular measurements of anti-HIV drugs indinavir, amprenavir, saquinavir, ritonavir, nelfinavir, lopinavir, atazanavir, efavirenz and nevirapine in peripheral blood mononuclear cells by liquid chromatography coupled to tandem mass spectrometry. J. Chromatogr. B Analyt. Technol. Biomed. Life Sci. 819:259–276 [DOI] [PubMed] [Google Scholar]
- 5. D'Avolio A., et al. 2011. A HPLC-MS method for the simultaneous quantification of fourteen antiretroviral agents in peripheral blood mononuclear cell of HIV infected patients optimized using medium corpuscular volume evaluation. J. Pharm. Biomed. Anal. 54:779–788 [DOI] [PubMed] [Google Scholar]
- 6. Ford J., Khoo S. H., Back D. J. 2004. The intracellular pharmacology of antiretroviral protease inhibitors. J. Antimicrob. Chemother. 54:982–990 [DOI] [PubMed] [Google Scholar]
- 7. Gao W.-Y., Cara A., Gallo R. C., Lori F. 1993. Low levels of deoxynucleotides in peripheral blood lymphocytes: a strategy to inhibit human immunodeficiency virus type 1 replication. Proc. Natl. Acad. Sci. U. S. A. 90:8925–8928 [DOI] [PMC free article] [PubMed] [Google Scholar]
- 8. Giraud C., Manceau S., Treluyer J. M. 2010. ABC transporters in human lymphocytes: expression, activity and role, modulating factors and consequences for antiretroviral therapies. Expert Opin. Drug Metab. Toxicol. 6:571–589 [DOI] [PubMed] [Google Scholar]
- 9. Khoo S. H., et al. 2002. Intracellular accumulation of human immunodeficiency virus protease inhibitors. Antimicrob. Agents Chemother. 46:3228–3235 [DOI] [PMC free article] [PubMed] [Google Scholar]
- 10. Pruvost A., Theodoro F., Agrofoglio L., Negredo E., Benech H. 2008. Specificity enhancement with LC-positive ESI-MS/MS for the measurement of nucleotides: application to the quantitative determination of carbovir triphosphate, lamivudine triphosphate and tenofovir diphosphate in human peripheral blood mononuclear cells. J. Mass Spectrom. 43:224–233 [DOI] [PubMed] [Google Scholar]
- 11. Sharma S., Cabana R., Shariatmadar S., Krishan A. 2008. Cellular volume and marker expression in human peripheral blood apheresis stem cells. Cytometry A 73:160–167 [DOI] [PubMed] [Google Scholar]
- 12. ter Heine R., et al. 2009. Quantification of HIV protease inhibitors and non-nucleoside reverse transcriptase inhibitors in peripheral blood mononuclear cell lysate using liquid chromatography coupled with tandem mass spectrometry. J. Chromatogr. B Analyt. Technol. Biomed. Life Sci. 877:575–580 [DOI] [PubMed] [Google Scholar]
- 13. ter Heine R., et al. 2010. Intracellular and plasma steady-state pharmacokinetics of raltegravir, darunavir, etravirine and ritonavir in heavily pre-treated HIV-infected patients. Br. J. Clin. Pharmacol. 69:475–483 [DOI] [PMC free article] [PubMed] [Google Scholar]


