

Abstract
Transcranial MR-guided Focused Ultrasound (TcMRgFUS) provides a potential noninvasive alternative to surgical resection and for other treatments for brain disorders. Use of low frequency ultrasound provides several advantages for TcMRgFUS, but is potentially limited by reflection and standing wave effects that may cause secondary hotspots within the skull cavity. The purpose of this work was to use volumetric MR temperature imaging (MRTI) and ex vivo human skulls filled with tissue-mimicking phantom material to search for heating distant from the focal point that may occur during sonication with a TcMRgFUS system as a result of reflections or standing wave effects. Heating during 120 s sonications was monitored within the entire skull volume for 12 different locations in two different skulls. The setup used a hemispheric array operating at 220 kHz. Multiple sonications were delivered at each location while varying the MRTI slice positions in order to provide full coverage of the skull cavity. An automated routine was used evaluate the MRTI to detect voxel regions that appeared to be heated by ultrasound. No secondary hotspots with a temperature rise of 15% or more of the focal heating were found. The MRTI noise level prevented the identification of possible hotspots with a lower temperature rise. These results suggest that significant secondary heating by this TcMRgFUS system at points distant from the focal point are not common.
Index Terms: Biomedical applications of acoustic radiation, Acoustic devices, Magnetic resonance imaging, Brain
I. Introduction
Since the 1940’s, focused ultrasound has been investigated for noninvasive ablation in the brain as a potential alternative to surgical resection and radiosurgery [1]–[5]. Until recently, clinical tests of the method have required the removal of a section of the skull to allow for ultrasound propagation into the brain [2],[3],[6]–[10] due to high ultrasound absorption and heating of the skull bone and beam aberration caused by its irregular shape and large acoustic impedance.
In the past decade, focused ultrasound systems have been developed to overcome these obstacles produced by the skull [11]–[13]. These systems reduce skull heating through active cooling of the scalp and a transducer design with a large aperture to distribute the ultrasound energy over a large skull region, and they correct for beam aberrations using a phased array transducer design. When combined with methods that use acoustic simulation based on CT scans of the skull bone to determine the phase and amplitude corrections for the phased array [14],[15] and MR temperature imaging (MRTI) to monitor the heating [16]–[18], a completely noninvasive alternative to surgical resection in the brain becomes possible. These systems have been tested in animals [19],[20] and in initial human trials [21],[22]. Such systems may also be useful for ultrasound-based targeted drug delivery methods in the brain [23] and for the treatment of stroke [24].
A current limitation of the method is that it is potentially restricted to deep and centrally-located targets in the brain. If the focal point is placed in more peripheral regions, the incidence angle between large portions of the skull bone and ultrasound wavefront becomes more oblique. As this angle increases, less of the ultrasound beam penetrates the skull, and at extreme angles, the beam is totally reflected. As a result, fewer elements in the array can be effectively utilized when peripheral regions are targeted, increasing the peak energy density and the heating on the skull surface. Shear mode conversion also increases as this angle increases, further increasing the heating due to the higher absorption coefficient of the shear mode. This limitation was evident in analysis of MR temperature measurements in the focal region and on the brain surface in the first patient treatments with a Transcranial MR-guided Focused Ultrasound (TcMRgFUS) system [21].
One way to increase the focal heating without increasing the time-averaged acoustic power deposition (which will determine the degree of skull heating) is to use the enhanced heating that arises when microbubbles are present at the focus [5],[25],[26]. By employing ultrasound bursts with peak pressure amplitudes above the cavitation threshold in the brain during a sonication, microbubbles are generated from gas nuclei within water in the tissue. These microbubbles locally enhance the heating in the focal zone through viscous heating, absorption of bubble acoustic emission and other factors [25], resulting in an enhancement of the focal heating. If the ultrasound bursts are delivered with a low duty cycle, the time averaged intensity on the skull can potentially be largely reduced.
If microbubble-enhanced heating is employed, one can also use lower frequency ultrasound to further reduce skull heating, as the ultrasound absorption by the bone decreases as the frequency is reduced. It would be normally difficult to heat at the focus at very low frequencies due to the low acoustic absorption in soft tissue, but with microbubble enhancement, one can still achieve therapeutic heating levels. Furthermore, with the extreme aperture used in TcMRgFUS systems, one can still achieve a reasonably small focal zone even at a low frequency. Because of these potential advantages of using microbubble-enhancement and lower ultrasound frequencies, the manufacturer of the TcMRgFUS system (InSightec, Haifa Israel) has built a new system that operates at 220 kHz. A low ultrasound frequency may also be advantageous for temporary disruption of the blood-brain barrier [27].
The use of lower frequency and microbubble-enhancement, however, introduces several potential complications. Because of the low ultrasound absorption at low frequencies, the ultrasound beam can travel a long distance in soft tissue before being fully absorbed. The skull is practically a closed chamber, and multiple reflections and standing waves may occur before the beam is fully absorbed. The curved shape of the skull cavity may also act as a lens, refocusing of the beam at unwanted locations. Potentially, the additive effect of the reflected beams can result in secondary hotspots. Since the inertial cavitation threshold is reduced at lower frequencies, these reflections and standing waves may lead to unwanted cavitation events that may cause damage away from the focal point.
These reflection and standing wave effects may have been observed during a recent clinical trial in stroke patients in which ultrasound bursts produced by a planar 300 kHz transducer was tested for enhanced delivery of tissue plasminogen activator (tPa) [28],[29]. This trial, which used long (90 min), low duty cycle burst exposures, was halted early because of brain hemorrhage that occurred in several patients. While the source of the hemorrhage is not known, it has been suggested based on experiments [30] and simulation studies [31] that it could have been due to the pressure amplitude being higher than expected in some brain regions because of reflection and standing waves, leading to cavitation-induced hemorrhage.
While the transducer design and sonication parameters for TcMRgFUS differ greatly from that used the stroke trial described above, it is important to ensure that reflections and standing waves do not produce unwanted secondary hotspots that can potentially cause brain tissue damage away from the focal zone. The large geometric gain of the hemisphere array designed for TcMRgFUS ablation is expected to largely mitigate these effects, but nevertheless they need to be excluded not only by simulations, but also experimentally. The purpose of this work was therefore to evaluate whether such effects are common. Phantom-filled, ex vivo human skulls and volumetric MR temperature imaging were employed to systematically search for secondary hotspots distant from the focal point during exposures delivered by a TcMRgFUS system.
II. Materials And Methods
A. Sonications
The goal of this work was to acquire three-dimensional MRTI to provide full coverage of the temperature distribution within the entire skull cavity. Due to the relatively long time required to acquire MR temperature images with sufficient SNR to detect low-level heating, it was not possible to achieve such coverage during a single sonication. Therefore, several sonications were delivered in succession at each target location with the imaging slices varying between sonications.
This strategy of using multiple sonications at a single location is problematic with microbubble-enhanced heating. When microbubbles are produced at the focus, they can remain for an extended period of time and influence subsequent exposures. Over several sonications, the number of these microbubbles can increase with every exposure, potentially significantly altering the energy deposition pattern so that most of the acoustic wave is absorbed within the focal volume. Thus, relatively low-energy sonications were used to avoid significant microbubble enhancement that could effect subsequent sonications. To achieve a large enough temperature increase at the focus, a long (120 s) sonication was required. This long duration also improved our ability to detect small hotspots, as the size of any heated area would increase over time due to thermal conduction. However, the long sonication duration limited our ability to detect secondary heating near the focal zone and near the skull.
The power level used for each test location was determined by the feedback provided by the MR temperature imaging acquired during test sonications. Sonications were delivered at a nominal power, which was increased in subsequent sonications until the hottest voxel within the focal zone reached a level slightly below the threshold for apparent microbubble enhancement, which was lower in the second skull tested. The parameters used during the experiments are listed in Table 1.
TABLE I.
Information on target locations
| Skull | Loc | Power (W) | Dur. (s) | Tpeak (°C) | % coverage | #locations with cavitation | Focal loc |
|---|---|---|---|---|---|---|---|
| 1 | 1 | 125 | 120 | 8.2 ± 0.6 | 99 | 3 of 7 | Geo. Focusa |
| 1 | 2 | 125 | 120 | 8.3 ± 0.8 | 93 | 1 of 11 | Beam steer 5 mm |
| 1 | 3 | 125 | 120 | 9.6 ± 1.0 | 93 | 1 of 6 | Geo. focus |
| 1 | 4 | 120 | 120 | 10.2 ± 1.0 | 100 | 2 of 7 | Geo. focus |
| 1 | 5 | 115 | 120 | 8.6 ± 0.5 | 89 | 1 of 6 | Geo. focus, transducer angled 5° |
| 1 | 6 | 110 | 120 | 9.0 ± 0.5 | 99 | 1 of 7 | Geo. focus, transducer angled −5° |
| 2 | 1 | 165 | 120 | 7.6 ± 0.6 | 91 | 0 of 6 | Geo. focus |
| 2 | 2 | 210 | 120 | 6.9 ± 0.4 | 91 | 0 of 6 | Beam steer 16 mm |
| 2 | 3 | 130 | 120 | 6.8 ± 0.5 | 97 | 0 of 6 | Geo. focus |
| 2 | 4 | 200 | 120 | 5.6 ± 0.2 | 98 | 0 of 7 | Beam steer 20 mm |
| 2 | 5 | 110 | 120 | 6.3 ± 0.6 | 100 | 1 of 6 | Beam steer 17 mm |
| 2 | 6 | 190 | 120 | 5.6 ± 0.2 | 100 | 0 of 6 | Beam steer 20 mm |
Geo. focus: targets located at transducer’s geometric focal point.
B. Phantom
The sonications were performed in two ex vivo human skulls (minus the mandible) filled with a tissue-mimicking phantom. The skulls were obtained several years ago. At that time they were placed in a vacuum chamber in deionized water for several days for degassing and then stored submerged in formalin. On the day the phantom was poured, they were degassed again in water for several hours. Acoustic properties of the formalin-fixed skulls were assumed to be similar to those of fresh skulls [32]. A proprietary tissue mimicking phantom material consisting of degassed water, milk powder (with fat content less than 1%), and additional preserving materials was prepared. The phantom materials and recipe were supplied by InSightec (Haifa, Israel). While in a liquid state, it was poured into the skull, which was inside a plastic bag to contain any leakage. The material set overnight in a cold room and excess phantom material removed from the outer surface. The skull was completely filled with the phantom material and stored in water between experiments at 4°C.
The attenuation coefficient and speed of sound of the phantom were measured using a single-element 220 kHz transducer. The attenuation coefficient of the phantom was obtained by an absolute method that requires two samples of the phantom with different thicknesses [33], and the sound speed was measured via a time-of-flight measurement. Using a calibrated hydrophone, the signal amplitude and the time of flight were measured for each sample. These measurements were repeated in water after removing the phantom samples. The measurements were repeated at six acoustic power levels. The attenuation coefficient and sound speed (mean ± S.D. of six measurements) were 0.053 ± 0.002 Np/cm/MHz (0.46 ± 0.02 dB/cm/MHz) and 1625 ± 2 m/s, respectively. The phantom recipe aimed to have similar acoustic properties as brain, which has a reported attenuation coefficient and sound speed of approximately 0.05 Np/cm/MHz and 1600 m/s, respectively [34].
C. Device
The experiments were performed using the ExAblate 4000 TcMRgFUS system (InSightec, Haifa, Israel). It consists of a 30 cm diameter hemispherical 1024 element phased array transducer operating at 220 kHz coupled with a 1024-channel driving system, a treatment planning/MRI thermometry/dosimetry workstation, and a water cooling/circulation/degassing system. The driving system allows for individual control of the phase and amplitude for each element in the phased array. The width and length of the half intensity profile produced by the transducer in water were provided by the manufacturer and were approximately 3.0 and 5.8 mm, respectively (Fig. 1). The system was integrated with a clinical 3T MRI unit (GE Healthcare, Milwaukee, WI). MR imaging was performed using an eight-channel torso coil (GE Healthcare, Milwaukee, WI) wrapped around the outside of the transducer.
Fig. 1.

Maps of the normalized intensity of the TcMRgFUS device measured in water. Contours at 15% (−8.2 dB) and 50% (−3 dB) of the peak intensity are shown.
The transducer was oriented on its side and was housed in a manually-operated positioning system with four degrees of freedom (xyz translation, pitch angle) that was integrated into a standard MRI table. This positioning system was used to place the geometric focus of the transducer at different locations at deep and centrally located regions within the phantom, where initial patient tests of the device are likely to occur. Additional focal steering was achieved using electronic steering via the phased array. The ultrasound driving system was located inside the MRI room. A control computer and power supply, as well as the water circulation/degassing/chilling system and the treatment planning/dosimetry workstation were located outside the room.
The system was designed with a circular flexible membrane with a hole in the center to contain the water that fills the space between the transducer and a patient’s head. Here, the center hole was stretched around a plastic phantom holder to which the phantom-filled human skull was attached. The membrane’s outer circumference was sealed to the outside face of the transducer. The plastic phantom holder was mounted to the MRI table. In this configuration, the entire skull was in water (Fig. 2). The water allowed for acoustic coupling of the ultrasound beam. It was chilled to 15–20°C to provide cooling and was continuously degassed and circulated between sonications. Water temperature and pressure inside the transducer were monitored throughout treatment by the TcMRgFUS control computer.
Fig. 2.
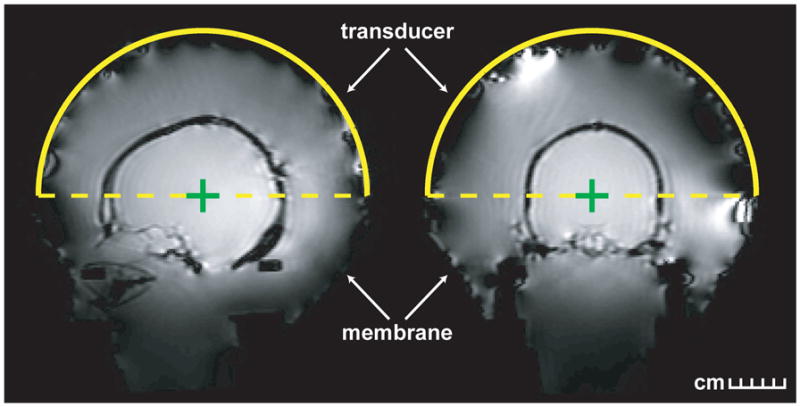
Treatment planning images of the phantom-filled skull within the TcMRgFUS device. The skull was attached to a plastic holder which was mounted to the MRI table. A flexible membrane was attached to the holder and the transducer, and the space inside the phantom filled with degassed, cooled water. In this configuration, the entire skull was submerged in water. Left: sagittal; Right: coronal.
The commercial treatment planning software was used to provide phase offsets to compensate for skull-induced beam aberrations based on CT scans (512×512 matrix, 28 cm field of view, 1 mm slice thickness) showing the geometry and density of the skull. For transducer elements that produce a mean US wavefront at an angle of less than 45° relative to the skull surface, an algorithm similar to that presented in Ref. [14] was used to add a phase offset to correct for the effect of the bone. This offset was determined by the average thickness and density of the skull in the path of the element [35]. For angles greater than or equal to 45°, total reflection was assumed [36] and the element was deactivated. The relationship between the density measured on the CT scan and the speed of sound was found experimentally in ex vivo human skulls [35]. The amplitude of each element was modulated to obtain an equal acoustic intensity on average at the inner surface of the skull.
D. Temperature mapping
For MRTI, phase-difference images of a fast spoiled gradient echo (FSPGR) sequence were obtained to estimate changes in the temperature-sensitive water proton resonant frequency [16]. The following parameters were used for MRTI: TR/TE: 21/15.5 ms, flip angle: 30°, slice thickness: 3 mm, field of view: 28 cm, matrix (phase×frequency): 128×256, bandwidth: ±14.7 kHz, scan time: 2.8 s per slice. For each sonication, five sagittal imaging planes were acquired. A time-series of images in five user-defined planes were obtained before, during, and for several minutes after each sonication. Two pre-sonication baseline images were acquired. The scanner reconstructed complex image data needed to create these phase-difference images, which were converted to temperature maps by the treatment planning/thermometry workstation using a temperature sensitivity of −0.01 ppm/°C [37]. To properly combine the phase information for each coil element, the scanner reconstructed complex image data for each coil element individually. Individual phase-difference images were created for each coil element and then combined in a weighted average using the magnitude squared as the weighting term.
Because of the relatively long scan time per image slice, each test location required multiple repeated sonications to obtain temperature images to cover the entire skull volume. For the first six sonications delivered at each location, the spacing between the images was adjusted (spacing=0, 6, 9 12, 18, 24 mm) with the center slice at the focal coordinate. For the last four or five sonications (depending on the location of the focal point in the left/right direction), images were acquired with inter-slice spacing of zero to cover the peripheral slices. This strategy was employed to provide 41 contiguous slices to cover the entire phantom, with as many sonications as possible that had imaging that included the focus to ensure that the sonications were consistent from location to location. This scheme is shown in Fig. 3. Note that in the first two locations tested in the first skull, this protocol was being developed and some of the sonications were delivered while acquiring only three image planes. In these cases, the data was linearly interpolated to the time-points of the five slice data. In several locations in the first skull tested, some peripheral regions in the left/right direction were not imaged due to operator error. Also, in the second skull tested some of the phantom material leaked out of the skull before it set, so in the first experiment with it (first two locations) a region at the skull base around the foramen magnum were not filled with phantom. The percentage of the skull cavity that was imaged is listed in Table I.
Fig. 3.
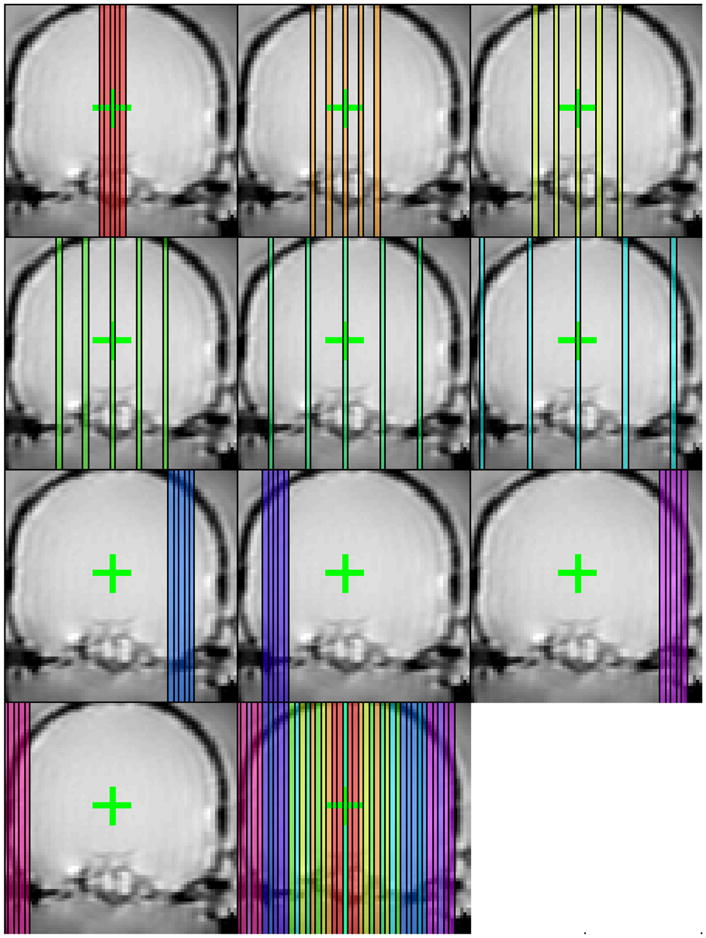
Sagittal imaging planes obtained over ten sonications at one test location. Five imaging planes were acquired for each sonication. For the first six sonications delivered at each test location, the center slice was prescribed on the focal coordinate and the inter-slice spacing was increased. During the last four sonications, the inter-slice spacing was set to zero and the images were offset to obtain slices at the periphery.
The median time between sonications was 10.0 min (range: 7.7–22.1 min). This long time was necessary to allow for the skull and phantom to cool between sonications. A total of 136 sonications were delivered over the course of the experiments. Before the two minute sonication, the location of the focal point was measured during short, low-power sonications that produced a temperature rise of ~1–3°C. This imaging was repeated in multiple imaging orientations to ensure that the imaging was precisely centered on the focal point.
E. Temperature data processing
The inner surface of the skull was determined using semi-automated segmentation. Segmentation was performed on the average of all the magnitude reconstructions in the time-series of FSPGR images used for MRI temperature monitoring. First the area outside the inner surface of the skull was segmented manually and areas outside were removed. Next, using an image threshold approximately 33% between the average intensities of the skull bone and the phantom material was used to create a mask of the phantom material. To determine the location with the hottest voxel, an area around the focal heating was searched in all the imaging planes that included the focal point. Any heating within areas less than or equal to two cm away from this point and less than or equal to one cm away from the edge of the phantom were assumed to be the result of focal and skull-induced heating, respectively.
A Gaussian filter (radius 0.7 mm) was applied to the MR temperature images. The noise level in the images was found by taking the standard deviation of all the voxels greater than 2.5 cm away from the hottest voxel and more than one cm from the phantom edge. Small (magnitude less than approximately 1°C) phase instabilities over time were observed. To remove these instabilities, the mean phase difference in the region used to calculate the noise level was subtracted from the phase-difference data.
After this processing, voxels a distance greater than one cm away from the edge of the phantom segmentation and more than two cm away from the hottest voxel were analyzed using an automated routine to detect secondary hotspots using the following rules:
Two temperature images at the end of sonication (time = 120, 148s) were averaged together. Voxels that had a temperature rise greater than or equal to 15% of the mean peak focal temperature at that test location were identified.
The first two temperature images were averaged together. The average temperature change had to be less than or equal to ±0.5°C, which excludes voxels greater than approximately two standard deviations of the standard deviation in non-heated regions in the temperature images (see below).
The last three images in the time-series of temperature images were averaged together. Voxels that deviated (plus or minus) more than 33% from the temperature measured in rule 1 were excluded.
Rules 2 and 3 (along with the filtering described above) were used to screen out the effects of noise and artifacts in the imaging. Isolated voxels that passed the above rules were assumed to be noise and were excluded. The 15% threshold used in rule 1 was determined by examining the results at different thresholds. For thresholds less than about 15%, the measurements were confounded by noise and conclusive results could not be determined. To confirm that this scheme was working as expected, all voxels that were heated greater than 15% of the mean in rule 1 were manually inspected to confirm that their temperature/time trajectory was obviously not due to heating.
III. Results
The location of the targets in the two skulls tested is shown in Fig. 4. Focal heating was observed at the targeted location for every sonication where one of the imaging planes was centered on the target location. The mean peak temperature rise achieved at the focus during all of these sonications (excluding measurements with apparent microbubble-enhanced heating, see below) was 8.8 ± 1.0°C and 6.4 ± 0.8°C, respectively, for the first and second skull (Fig. 5). The relatively small error bars suggest that the sonications were consistent from sonication-to-sonication and from location-to-location even though the power level varied. The mean peak temperature rise for each location is listed in Table 1. The mean standard deviation in non-heated regions in the temperature maps after filtering was 0.26 ± 0.03°C.
Fig. 4.

Targeted locations for the first (top) and second (bottom) skull.
Fig. 5.

The average peak temperature as a function of time for the sonications in the first and second skull tested. Measurements during sonications with apparent microbubble-enhanced heating were excluded. Mean ± S.D. shown.
Examples of the temperature mapping through the focal heating zone are shown in Fig. 6. The heating was largely contained to the focal zone and in regions adjacent to the skull bone. Examination of the maximum temperature rise achieved (Fig. 7) found no obvious secondary hotspots beyond the focal heating zone. Several bright areas were observed in this imaging, but examination of their behavior as a function of time (e.g. plot in Fig. 7) demonstrated clearly that they were the result of image artifacts.
Fig. 6.

Temperature maps at selected time points during sonication at one of the test locations. Native sagittal images are shown in the top row, and coronal and axial reformat of the data are shown in the middle and lower row, respectively. The last image in the series shows the maximum temperature achieved during sonication.
Fig. 7.

Projections of the maximum temperature elevation achieved during sonication at one of the test locations. Several bright areas were observed away from the focal point (circled regions), but analysis of their temperature/time trajectory at these voxels (plot) demonstrates that they were clearly due to artifacts, not heating.
Voxels with apparent ultrasound-induced heating were identified using the automated detection scheme described above and are shown for four test locations in Fig. 8. Yellow voxels in this figure are within two cm of the hottest point. The volume produced by these voxels took on a variety of shapes depending on the location. Voxels outside of this zone are plotted in blue and red. In the first skull, no voxels with heating of 15% of the peak temperature were identified away from the heated focal volume. In the second skull, where the peak focal temperature that could be achieved was lower, voxels were found outside of the two cm boundary that could be consistent with ultrasound-induced heating. Most of these were contiguous with the focal volume (blue voxels in the figure) and were assumed to be due to focal heating and thermal conduction. A very small number of voxels (two voxels each on locations 4 and 6) more distant from the focal volume were identified (red voxels in the figure, encircled), but examination of their temperature/time curves suggest that they were likely due to noise. They occurred in the two locations with the lowest mean peak temperature rise at the focus. The heated volume in the last location tested in the second skull was elongated in the left/right direction, presumably an artifact from relatively large beam steering in that direction.
Fig. 8.

Locations that were identified as ultrasound-induced heating (see text for metric). Regions within two cm of the hottest voxel (indicated by crosses) are colored yellow. In the second skull, regions outside of this zone identified as potential heating were found and are colored red or blue. Blue voxels indicate regions contiguous with the focal heating volume. In two of the locations, a region of two voxels more distant from the focal heating volume was identified (circled). The temperature rise as a function of time for these areas is shown in the graphs on the right for each sonicated location and are likely noise. In locations where the target location was moved via electronic beam steering, the geometric focus is indicated by a black “×”.;
In every location tested in the first skull and in one location tested in the second, at least one of the sonications had apparent microbubble enhancement. This enhancement was evident as a rapid increase in temperature rise at the focal point and a change in shape of the heated area (Fig. 9). This enhancement occurred near the end of the two minute sonication. In every case that this enhancement was observed, subsequent sonications were performed without apparent microbubble enhancement, suggesting that the phantom was not irreversibly changed due to this enhancement.
Fig. 9.

MR temperature maps as a function of time for three consecutive sonications. In the second, microbubble-enhanced imaging was evident at the end of sonication by a rapid increase in temperature and a change in shape of the heating profile. The location of the heating also changes with this enhancement, moving from the focal plane (dotted lines) towards the transducer (upward in the images). Note that third sonication performed after the enhancement did not result in microbubble enhancement, suggesting that this level of microbubble activity did not irreversibly change the phantom or the energy deposition. Contours indicate regions that reached a temperature elevation of at least 8°C.
IV. Discussion
Volumetric MRTI analysis failed to find any detectable secondary hotspots distant from the focal point with temperatures approaching the temperature at the focus with this TcMRgFUS device. This finding is in contrast to simulations of a different, non-focused, low-frequency ultrasound system [28],[29] that was used in a clinical trial for stroke that suggested that peak pressure amplitudes exceeding the expected value can occur away from the targeted location and could have caused the unexpected hemorrhage events that caused the trial to be prematurely stopped [30],[31]. While this result does not prove unambiguously that such hotspots can never occur, it does suggest that they are not common with this TcMRgFUS device.
These findings can be explained by the large differences in transducer design between the TcMRgFUS device and the device used for the stroke therapy. The device tested for stroke patients consisted of small, unfocused (flat) transducers placed on one side of the patient’s head. These transducers produce a largely collimated beam with relatively low spatial localization along the beam direction. As a result, additive effects from reflections off of the inner skull can have a large relative effect on the magnitude and the location of the peak acoustic pressure amplitude, even at points distant from the target. In contrast, the hemispheric device tested in this study has a huge geometric gain which produces a sharp focus that diverges extremely rapidly as a function of distance from the focal point. As a result, reflections from the inner skull surface are not likely to have a large effect on the acoustic pressure amplitude at points distant from the focal zone.
One can use these results to make conservative safety estimates for this device. Secondary hotspots with a temperature rise of more than 15% of the focal point did not occur at any point within the skull more than approximately two cm from the focus. Assuming linear ultrasound absorption and a linear relationship between temperature rise and acoustic intensity, which is a reasonable approximation with the low frequency, highly focused transducer in this TcMRgFUS system [38], they suggest that the acoustic intensity at distant regions within the skull was less than 15% of that at the focus.
Even if distant regions were heated with this device, the risk of overheating at them is low due to the low acoustic absorption at 220 kHz. The main risk at distant locations at this frequency is inertial cavitation, so safety concerns should mainly be described in terms of inertial cavitation thresholds. These results suggest that if the transducer is driven to the inertial cavitation threshold at the focal point (for microbubble-enhanced heating), tissues at distant areas could have cavitation thresholds with acoustic intensities that were approximately 6.7 times lower without risk for secondary damage. Regions with lower cavitation thresholds may exist in necrotic and pathological tissue, in the ventricles, or in other regions that have different fluid content or other properties than the target tissue. In terms of pressure amplitude, which is proportional to the square root of the intensity, the data suggests that tissues at points distant from the target tissue could have inertial cavitation thresholds approximately 2.6 times lower than at the focal point. Note that the 15% threshold used here was determined solely on the basis of image noise levels, and these results in our opinion are likely conservative.
This study had several limitations. First, due to the low acoustic absorption at 220 kHz, long sonications were necessary to achieve a sufficient temperature rise at the focus. This long sonication duration increased the size of the focal heating zone and areas heated near the skull bone due to thermal conduction. As a result, it was not possible to evaluate regions close to the focus or the skull for secondary hotspots. While in early time-points the focal heating was small and no large secondary spots were observed, it was not possible to systematically search for low-level heating due to noise considerations. This region may be more vulnerable to reflection effects than the distant regions investigated in this study, as areas close to the focal point may already have relatively high intensity levels due to side lobes or other features of the beam distribution. The long sonication duration also required a long cooling duration between sonications, which limited the total number of locations we could feasibly test. It may be possible that different skull and transducer configurations could allow for refocusing of the ultrasound beam at points distant from the focal zone.
The long sonication duration, however, did mitigate another limitation of this study: volume averaging. The slice thickness was 3 mm, and it is possible that the temperature rise of a potential secondary hotspot located exactly between two slices was underestimated. With a two minute sonication, any secondary heating will be smeared over a large volume, making it unlikely that it would have been missed here.
V. Conclusion
Analysis of volumetric MRTI that covered nearly the entire skull volume failed to find any regions more than approximately two cm away from the focal point and one cm away from the inner skull surface with secondary heating at a level of 15% or more of the peak temperature at the focus. Reflection and standing waves within the skull cavity that were suggested as a source for hemorrhage in with a different low-frequency therapeutic ultrasound device were not observed with this clinical TcMRgFUS system. While these experiments do not prove unambiguously that such secondary effects can never occur with this TcMRgFUS device, they do suggest that they are not common. Future work is necessary to evaluate regions close to the focal point and inner skull surface and to search for hotspots with a lower thermal rise to provide safety margins which are less conservative.
Acknowledgments
This work was supported in part by a research grant from the Focused Ultrasound Surgery Foundation and by Award Number RC2NS069413 from the National Institute of Neurological Disorders And Stroke. The content is solely the responsibility of the authors and does not necessarily represent the official views of the National Institute of Neurological Disorders And Stroke or the National Institutes of Health. InSightec provided the TcMRgFUS system and provided support for MRI time.
Contributor Information
Nathan McDannold, Email: njm@bwh.harvard.edu, Brigham & Women’s Hospital/Harvard Medical School, Boston, MA, 02115 (phone: 617-278-0605).
Eun-Joo Park, Brigham & Women’s Hospital/Harvard Medical School, Boston, MA, 02115.
Chang-Sheng Mei, Radiology Department at Brigham & Women’s Hospital, Boston, MA, 02115, and the Physics Department at Boston College, Chestnut Hill, MA 02467.
Eyal Zadicario, InSightec, Ltd., Haifa, Israel.
Ferenc Jolesz, Brigham & Women’s Hospital/Harvard Medical School, Boston, MA, 02115.
VII. Bibliography
- 1.Lynn JG, Putnam TJ. Histology of cerebral lesions produced by focused ultrasound. Am J Path. 1944;20:637–652. [PMC free article] [PubMed] [Google Scholar]
- 2.Meyers R, Fry WJ, Fry FJ, Dreyer LL, Shultz DF, Noyes RF. Early experiences with ultrasonic irradiation of the pallidfugal and nigral complexes in hyperkinetic and hypertonic disorders. J Neurosurg. 1959;16:32–54. doi: 10.3171/jns.1959.16.1.0032. [DOI] [PubMed] [Google Scholar]
- 3.Fry WJ, Fry FJ. Fundamental neurological research and human neurosurgery using intense ultrasound. IRE Trans Med Electron. 1960;ME-7:166–181. doi: 10.1109/iret-me.1960.5008041. [DOI] [PubMed] [Google Scholar]
- 4.Ballantine HT, Bell E, Manlapaz J. Progress and problems in the neurological applications of focused ultrasound. J Neurosurg. 1960;17:858–876. doi: 10.3171/jns.1960.17.5.0858. [DOI] [PubMed] [Google Scholar]
- 5.Lele PP. Effects of ultrasound on “solid” mammalian tissues and tumors in vivo. In: Repacholi MH, Grondolfo M, Rindi A, editors. Ultrasound: Medical Applications, Biological Effects and Hazard Potential. New York: Plenum Pub. Corp; 1987. pp. 275–306. [Google Scholar]
- 6.Oka M, Okumura T, Yokoi H, Murao T, Miyashita Y, Oka K, Yoshitatsu S, Yoshioka K, Hirano H, Kawashima Y. Surgical application of high intensity focused ultrasound. Med J Osaka Univ. 1960;10:427–442. [Google Scholar]
- 7.Heimburger RF. Ultrasound augmentation of central nervous system tumor therapy. Indiana Med. 1985;78(6):469–476. [PubMed] [Google Scholar]
- 8.Guthkelch AN, Carter LP, Cassady JR, Hynynen K, Iacono RP, Johnson PC, Obbens EA, Roemer RB, Seeger JF, Shimm DS. Treatment of malignant brain tumors with focused ultrasound hyperthermia and radiation: results of a phase I trial. J Neurooncol. 1991;10(3):271–284. doi: 10.1007/BF00177540. [DOI] [PubMed] [Google Scholar]
- 9.Park JW, Jung S, Junt TY, Lee MC. Focused ultrasound surgery for the treatment of recurrent anaplastic astrocytoma: A preliminary report. Therapeutic Ultrasound; 5th International Symposium on Therapeutic Ultrasound; 2006. pp. 238–240. [Google Scholar]
- 10.Ram Z, Cohen ZR, Harnof S, Tal S, Faibel M, Nass D, Maier SE, Hadani M, Mardor Y. Magnetic resonance imaging-guided, high-intensity focused ultrasound for brain tumor therapy. Neurosurgery. 2006;59(5):949–955. doi: 10.1227/01.NEU.0000254439.02736.D8. [DOI] [PubMed] [Google Scholar]
- 11.Hynynen K, Jolesz FA. Demonstration of potential noninvasive ultrasound brain therapy through an intact skull. Ultrasound Med Biol. 1998;24(2):275–283. doi: 10.1016/s0301-5629(97)00269-x. [DOI] [PubMed] [Google Scholar]
- 12.Thomas J, Fink MA. Ultrasonic beam focusing through tissue inhomogeneities with a time reversal mirror: application to transskull therapy. IEEE Trans Ultrason Ferroelectr Freq Contr. 1996;43(6):1122–1129. [Google Scholar]
- 13.Clement GT, Sun J, Giesecke T, Hynynen K. A hemisphere array for non-invasive ultrasound brain therapy and surgery. Phys Med Biol. 2000;45(12):3707–3719. doi: 10.1088/0031-9155/45/12/314. [DOI] [PubMed] [Google Scholar]
- 14.Clement GT, Hynynen K. A non-invasive method for focusing ultrasound through the human skull. Phys Med Biol. 2002;47(8):1219–1236. doi: 10.1088/0031-9155/47/8/301. [DOI] [PubMed] [Google Scholar]
- 15.Aubry JF, Tanter M, Pernot M, Thomas JL, Fink M. Experimental demonstration of noninvasive transskull adaptive focusing based on prior computed tomography scans. J Acoust Soc Am. 2003;113(1):84–93. doi: 10.1121/1.1529663. [DOI] [PubMed] [Google Scholar]
- 16.Ishihara Y, Calderon A, Watanabe H, Okamoto K, Suzuki Y, Kuroda K. A precise and fast temperature mapping using water proton chemical shift. Magn Reson Med. 1995;34(6):814–823. doi: 10.1002/mrm.1910340606. [DOI] [PubMed] [Google Scholar]
- 17.Hynynen K, Vykhodtseva NI, Chung AH, Sorrentino V, Colucci V, Jolesz FA. Thermal effects of focused ultrasound on the brain: determination with MR imaging. Radiology. 1997;204(1):247–253. doi: 10.1148/radiology.204.1.9205255. [DOI] [PubMed] [Google Scholar]
- 18.Vykhodtseva NI, Sorrentino V, Jolesz FA, Bronson RT, Hynynen K. MRI detection of the thermal effects of focused ultrasound on the brain. Ultrasound Med Biol. 2000;26(5):871–880. doi: 10.1016/s0301-5629(00)00216-7. [DOI] [PubMed] [Google Scholar]
- 19.Hynynen K, Clement GT, McDannold N, Vykhodtseva N, King R, White PJ, Vitek S, Jolesz FA. 500-element ultrasound phased array system for noninvasive focal surgery of the brain: A preliminary rabbit study with ex vivo human skulls. Magn Reson Med. 2004;52(1):100–107. doi: 10.1002/mrm.20118. [DOI] [PubMed] [Google Scholar]
- 20.Pernot M, Aubry JF, Tanter M, Boch AL, Marquet F, Kujas M, Seilhean D, Fink M. In vivo transcranial brain surgery with an ultrasonic time reversal mirror. J Neurosurgery. 2007;106:1061–1066. doi: 10.3171/jns.2007.106.6.1061. [DOI] [PubMed] [Google Scholar]
- 21.McDannold N, Clement GT, Black PM, Jolesz FA, Hynynen K. Transcranial MRI-guided focused ultrasound surgery of brain tumors: Initial findings in three patients. Neurosurgery. 2010;66(2):323–332. doi: 10.1227/01.NEU.0000360379.95800.2F. [DOI] [PMC free article] [PubMed] [Google Scholar]
- 22.Martin E, Jeanmonod D, Morel A, Zadicario E, Werner B. High-intensity focused ultrasound for noninvasive functional neurosurgery. Ann Neurol. 2009;66(6):858–861. doi: 10.1002/ana.21801. [DOI] [PubMed] [Google Scholar]
- 23.Hynynen K, McDannold N, Vykhodtseva N, Jolesz FA. Noninvasive MR imaging-guided focal opening of the blood-brain barrier in rabbits. Radiology. 2001;220(3):640–646. doi: 10.1148/radiol.2202001804. [DOI] [PubMed] [Google Scholar]
- 24.Alexandrov AV, Molina CA, Grotta JC, Garami Z, Ford SR, Alvarez-Sabin J, Montaner J, Saqqur M, Demchuk AM, Moye LA, Hill MD, Wojner AW. Ultrasound-enhanced systemic thrombolysis for acute ischemic stroke. N Engl J Med. 2004;351(21):2170–2178. doi: 10.1056/NEJMoa041175. [DOI] [PubMed] [Google Scholar]
- 25.Holt RG, Roy RA. Measurements of bubble-enhanced heating from focused, mhz-frequency ultrasound in a tissue-mimicking material. Ultrasound Med Biol. 2001;27(10):1399–1412. doi: 10.1016/s0301-5629(01)00438-0. [DOI] [PubMed] [Google Scholar]
- 26.Sokka SD, King R, Hynynen K. MRI-guided gas bubble enhanced ultrasound heating in in vivo rabbit thigh. Phys Med Biol. 2003;48(2):223–241. doi: 10.1088/0031-9155/48/2/306. [DOI] [PubMed] [Google Scholar]
- 27.McDannold N, Vykhodtseva N, Hynynen K. Targeted disruption of the blood-brain barrier with focused ultrasound: association with cavitation activity. Phys Med Biol. 2006;51(4):793–807. doi: 10.1088/0031-9155/51/4/003. [DOI] [PubMed] [Google Scholar]
- 28.Daffertshofer M, Gass A, Ringleb P, Sitzer M, Sliwka U, Els T, Sedlaczek O, Koroshetz WJ, Hennerici MG. Transcranial low-frequency ultrasound-mediated thrombolysis in brain ischemia: increased risk of hemorrhage with combined ultrasound and tissue plasminogen activator: results of a phase II clinical trial. Stroke. 2005;36(7):1441–1446. doi: 10.1161/01.STR.0000170707.86793.1a. [DOI] [PubMed] [Google Scholar]
- 29.Reinhard M, Hetzel A, Kruger S, Kretzer S, Talazko J, Ziyeh S, Weber J, Els T. Blood-brain barrier disruption by low-frequency ultrasound. Stroke. 2006;37(6):1546–1548. doi: 10.1161/01.STR.0000221813.27519.0b. [DOI] [PubMed] [Google Scholar]
- 30.Azuma T, Kawabata KI, Umemura SI, Ogihara M, Kubota J, Sasaki K, Furuhata H. Bubble Generation by Standing Wave in Water Surrounded by Cranium with Transcranial Ultrasonic Beam. Jpn Soc Appl Phys. 2005;44(6B):4625–4630. [Google Scholar]
- 31.Baron C, Aubry JF, Tanter M, Meairs S, Fink M. Simulation of Intracranial Acoustic Fields in Clinical Trials of Sonothrombolysis. Ultrasound Med Biol. 2009 doi: 10.1016/j.ultrasmedbio.2008.11.014. [DOI] [PubMed] [Google Scholar]
- 32.Fry FJ, Barger JE. Acoustical properties of the human skull. J Acoust Soc Am. 1978;63(5):1576–1590. doi: 10.1121/1.381852. [DOI] [PubMed] [Google Scholar]
- 33.Huang J. PhD Dissertation. Boston University; 2002. Heating in vascular tissue and flow-through tissue phantoms induced by focused ultrasound. [Google Scholar]
- 34.Duck FA. Acoustic Properties of Tissue at Ultrasonic Frequencies. In: Duck Francis A., editor. Physical Properties of Tissue. A Comprehensive Reference Book. ch 4. London: Academic Press; 1990. pp. 73–135. [Google Scholar]
- 35.Clement GT, Hynynen K. Correlation of ultrasound phase with physical skull properties. Ultrasound Med Biol. 2002;28(5):617–624. doi: 10.1016/s0301-5629(02)00503-3. [DOI] [PubMed] [Google Scholar]
- 36.Clement GT, White PJ, Hynynen K. Enhanced ultrasound transmission through the human skull using shear mode conversion. J Acoust Soc Am. 2004;115(3):1356–1364. doi: 10.1121/1.1645610. [DOI] [PubMed] [Google Scholar]
- 37.Hindman JC. Proton resonance shift of water in the gas and liquid states. J Chem Phys. 1966;44:4582–4592. [Google Scholar]
- 38.Hynynen K. The role of nonlinear ultrasound propagation during hyperthermia treatments. Med Phys. 1991;18(6):1156–1163. doi: 10.1118/1.596626. [DOI] [PubMed] [Google Scholar]