Perfusion of forskolin, a direct activator of adenylate cyclase, is known to increase aqueous humor outflow across the trabecular meshwork. In this study, the authors characterized the effect of elevated cAMP on the actomyosin system in TM cells to further establish the mechanism of action of forskolin on the aqueous humor outflow.
Abstract
Purpose.
Elevated cAMP in the trabecular meshwork (TM) cells increases the aqueous humor outflow facility. The authors investigated the mechanisms by which elevated cAMP opposes the RhoA-Rho kinase pathway, leading to the relaxation of the actomyosin system in bovine TM cells.
Methods.
Forskolin (Fsk) and rolipram were used to elevate cAMP levels. Changes in the phosphorylation of RhoA at Ser188 (a putative inhibitory site), the regulatory light chain of myosin (pMLC), and the regulatory subunit of myosin phosphatase (MYPT1) were determined by Western blot analysis. The actomyosin contraction was measured by collagen gel contraction (CGC) assay. The impact of cAMP on cell-matrix adhesion was followed by immunostaining of focal adhesion proteins and by electric cell-substrate impedance sensing.
Results.
Elevated cAMP led to an increase in the phosphorylation of RhoA at Ser188, to the inhibition of endothelin-1 (ET-1)–induced activation of RhoA, and to the formation of stress fibers. The loss of pMLC along the stress fibers was comparable to that induced by Y-27632 (Rho kinase inhibitor). A concomitant reduction in both MYPT1 phosphorylation and pMLC was observed. Elevated cAMP also reduced (ET-1)–induced CGC and the cell-substrate resistance by >50%.
Conclusions.
In TM cells, elevated cAMP leads to the phosphorylation of RhoA at Ser188. Consequent inhibition of RhoA activity reduces the phosphorylation of MYPT1 at Thr853, leading to a reduction in MLC phosphorylation and actomyosin contraction. These actions, similar to those of the Rho kinase inhibitors, possibly underlie the reported increase in outflow facility in response to Fsk perfusion ex vivo.
More than 60 million people worldwide are affected by primary open-angle glaucoma.1 When left untreated, this disease results in a progressive loss of vision through optic neuropathy.2 Although the etiology is not well understood, treatments that lower IOP slow the deterioration of vision. Since the advent of topical prostaglandin analogs, pharmacologic strategies to reduce IOP have gained prominence over surgical treatments.3 In humans, >80% of the aqueous humor exits the anterior chamber by the trabecular meshwork (TM) route.4 Therefore, the outflow facility across the TM forms the primary determinant of IOP. Apart from the muscarinic agonist pilocarpine, there are no clinically viable drugs that elicit significant IOP reduction by enhancing outflow through the TM. Prostaglandin analogs, the most efficacious ocular hypotensive drugs to date,5 lower IOP by increasing outflow largely through the uveoscleral pathway.6,7 Clearly, there is a need to find new and efficacious pharmacologic agents that would promote aqueous humor egress through the TM outflow pathway to achieve further reductions in IOP.
In the TM, the resistance to outflow resides at the level of the juxtacanalicular tissue.8 As demonstrated in recent studies, actomyosin contraction of the resident TM cells dynamically regulates the outflow across the TM. Specifically, a decrease in actomyosin contraction of TM cells (i.e., TM relaxation) increases the outflow facility and vice versa.9–11 One potential mechanism is that the actomyosin contraction regulates the mechanical tension in the extracellular matrix (ECM) of the juxtacanalicular tissue, leading to its structural remodeling and to consequent changes in the facility for aqueous outflow. Overall, while exploring drugs that affect the aqueous outflow facility by opposing actomyosin contraction, it is imperative to assess the status of cell-matrix adhesion of the TM cells.
Among the drugs and agents that have been tested ex vivo and in vivo to oppose actomyosin contraction, inhibitors of the RhoA-Rho kinase-signaling axis have been the most common.12–14 Recently, statins that reduce RhoA activation, as well as many Rho kinase inhibitors, have been demonstrated to reduce IOP by increasing outflow facility across the TM in nonhuman species.13–16 Exposure to forskolin (Fsk), which activates adenylate cyclase, is also known to be efficacious in reducing resistance to aqueous humor outflow.9,17–19 In a previous study, we demonstrated that Fsk reduces the phosphorylation of the regulatory light chain of myosin II (also called the myosin light chain or MLC).20 However, we did not delineate the molecular mechanisms underlying the dephosphorylation of MLC and its impact downstream on cell-matrix adhesion. Thus, the main objectives of the present study were to delineate further the molecular mechanisms involved in MLC dephosphorylation in response to elevated intracellular cAMP in TM cells and to compare the effects with that of direct Rho kinase inhibition.
Given the pleiotropic influence of cAMP, we analyzed its impact on signaling molecules key to the regulation of actomyosin contraction and actin remodeling (i.e., actin polymerization and depolymerization). Our major findings show that elevated cAMP causes MLC dephosphorylation, and, hence, relaxation of actomyosin, mainly by phosphorylation of RhoA at the Ser188 residue, which antagonizes the activation of the small GTPase. There was an associated decrease in cell-ECM interactions. Elevated cAMP also decreased the phosphorylation of cofilin, thus enhancing actin depolymerization and leading to a further loss of stress fibers.
Materials and Methods
Drugs and Chemicals
Antibodies for MYPT1, phospho-MYPT1 (Thr853), phospho-MLC (Thr18 and Ser19), and phospho-cofilin were obtained from Cell Signaling Technology (Danvers, MA). Phospho-MYPT1 (Thr696) antibody was purchased from Millipore (Temecula, CA). Anti-vinculin antibody, endothelin-1, blebbistatin, and Y-27632 were from Sigma (St. Louis, MO). Ser188 antibody was purchased from Santa Cruz Biotechnology (Santa Cruz, CA). Texas-Red conjugated phalloidin, Alexa 488-conjugated goat anti-mouse, and anti-rabbit antibodies were from Molecular Probes (Eugene, OR). Gold electrodes (8W10E+) for measuring changes in cell impedance were from Applied Biophysics, Inc. (Troy, NY). The cDNA synthesis kit was from Invitrogen (SuperScript III CellsDirect; Invitrogen, Grand Island, NY). The cAMP assay kit was obtained from Assay Designs (Ann Arbor, MI), and the RhoA activation assay kit was from Cytoskeleton, Inc. (Denver, CO). Cyclo RGD peptide was obtained from AnaSpec (Fremont, CA).
Cell Culture
Bovine TM cells were cultured as previously described.20 The explants of TM from the eyes were cultured at 37°C in 5% CO2 in Dulbecco's minimum essential medium (DMEM; Invitrogen) supplemented with 10% fetal bovine serum, 5% calf serum, and gentamicin (10 μg/mL). Second- or third-passage cells were used for all experiments.
cAMP Assay
Intracellular cAMP levels were measured using an enzyme immunoassay. TM cells grown to confluence and serum starved for 24 hours were treated with Fsk (10 μM) alone for 10 minutes, treated with rolipram (50 μM) alone for 30 minutes, or pretreated with rolipram for 30 minutes followed by Fsk for 10 minutes. The cells were lysed using 0.1 M HCl and were transferred to a 96-well plate coated with an anti-rabbit IgG antibody. The increase in cAMP levels was determined by measuring the optical density at 405 nm (measured in duplicate) and comparing the results to a calibration curve. cAMP levels were normalized to the protein concentration in each sample, and the data are presented as picomole of cAMP per milligram of protein. The results are expressed as mean ± SEM of two independent experiments.
Western Blot Analysis
Serum-starved cells were treated with drugs for the desired time, and protein was extracted using 2× Laemmli sample buffer. Protein estimation was performed using a protein assay kit (RC DC; Bio-Rad, Hercules, CA). An equal amount of protein (30 μg) was loaded in a 15% or 8% SDS-PAGE gel. Proteins were then transferred overnight at 30 V to a nitrocellulose membrane. After the transfer, the blots were blocked with 5% milk for 1 hour and incubated with primary antibody overnight. After a few washes, the blots were incubated with the appropriate secondary antibody for 1 hour. They were then washed and developed using an enhanced chemiluminescence kit (Pierce, Rockford, IL).
Reverse Transcription–Polymerase Chain Reaction
Total RNA was isolated using reagent (Trizol; Gibco BRL, Grand Island, NY) and was quantified by measuring absorption at 260 nm. Genomic DNA contamination was removed by treating RNA with DNase I. First-strand cDNA synthesis and PCR amplification of cDNA were performed using a cell-direct cDNA synthesis kit (Superscript III; Invitrogen). RT-PCR products were run on a 2% agarose gel and visualized by ethidium bromide staining, along with 100-bp markers (Amersham Biosciences, Piscataway, NJ). The primer sequences and expected product sizes are given in Tables 1 and 2. Product sequences were confirmed, and negative controls were performed for all the primer pairs used.
Table 1.
Primer Pair Sequences for Adenylate Cyclase Isoforms
| Gene | Primer Sequence | Ta (°C) | Size |
|---|---|---|---|
| AC1 | Sense: CATGACCTGCGAGGACGAT | 52 | 213 |
| Antisense: TCCCGTTCGACATGTTTGTA | |||
| AC2 | Sense: GGATCTCTCTCACGATCATC | 52 | 230 |
| Antisense: CAGGAACACGGAACAGGATA | |||
| AC3 | Sense: GTACTACACGGGACCCAGCA | 55 | 269 |
| Antisense: GCTCTAAGGCCACCATAGGTA | |||
| AC4 | Sense: TGACCATCACCTATGGCATCACCT | 55 | 204 |
| Antisense: TAATGGCCATGACGAAGACGAGCA | |||
| AC5 | Sense: ACCAAGGCTACACTCAACTAC | 52 | 116 |
| Antisense: CAGCGCAGGATGAGGAAG | |||
| AC6 | Sense: TCTATGTGGAGCTGGAGGCAAACA | 55 | 146 |
| Antisense: AGCCATGTAGGTGCTACCAATCGT | |||
| AC7 | Sense: CTGGCCAACGCAGTCATCTT | 55 | 227 |
| Antisense: TGCTCCTTGAGCCGTTCGAT | |||
| AC8 | Sense: ACCGGCATTGAGGTAGTGAT | 52 | 272 |
| Antisense: ATGACCACTTGGAGGATGAC | |||
| AC9 | Sense: CACCGCAAAATACTTAGATGACC | 52 | 240 |
| Antisense: ACATTCCCTGATGACGCTGT |
Table 2.
Primer Pair Sequences for cAMP-Specific PDE Isoforms
| Gene | Primer Sequence | Ta (°C) | Size (bp) |
|---|---|---|---|
| PDE4A | Sense: CTC GCA CAA GTT CAA AAG GAT G | 55 | 355 |
| Antisense: GCC TCC AGC GTA ATC CGA CA | |||
| PDE4B | Sense: AGC TCA TGA CCC AGA TAA GTG | 50 | 236 |
| Antisense: ATA ACC ATC TTC CTG AGT GTC | |||
| PDE4C | Sense: ACA CTG AAC TCC TGT CCC CTG AAG | 55 | 386 |
| Antisense: GAT GTG ACT CAA GAG TGA CCA CTG G | |||
| PDE4D | Sense: CCC TGG ACT GTT ATC ATG CA | 50 | 308 |
| Antisense: TGA TTG GAC ACA CCA GGA TG | |||
| PDE5 | Sense: GTG AAA GAT ATT TCT AGT CAC TTG | 50 | 769 |
| Antisense: ATA CAT GTA ATT GAT TCT GTT TGC | |||
| PDE7 | Sense: GGA CGT GGG AAT TAA GCA AGC | 58 | 285 |
| Antisense: TCC TCA CTG CTC GAC TGT TCT | |||
| PDE8 | Sense: CAG CCA GAG ACG ACA CTC TTC CAT | 58 | 502 |
| Antisense: ATG ATC TTA GCG TTG ACT CGG AGC |
Collagen Gel Contraction Assay
Collagen gel contraction (CGC) assay was performed as previously described.21,22 Briefly, the 24-well culture clusters were coated with 1% BSA at 37°C for 1 hour. Cells were trypsinized and resuspended in culture medium at a density of 1 × 10⁷ cells/mL. Rat-tail collagen type I (BD Biosciences, San Jose, CA), 10× DMEM (Sigma, St. Louis, MO), reconstitution buffer (pH 7.3), TM cell suspension, and water were mixed on ice to obtain a final collagen concentration of 1.9 mg/mL and a final cell density of 2 × 10⁵ cells/mL. The resultant mixture (0.5 mL) was added to each well of the culture clusters, and the gel was allowed to polymerize at 37°C for 90 minutes. Once released from the wells, serum-free DMEM (0.5 mL), without or with the drugs, was then added on top of the gels. The gels were imaged every 24 hours for 2 days. The area was calculated using ImageJ software (developed by Wayne Rasband, National Institutes of Health, Bethesda, MD; available at http://rsb.info.nih.gov/ij/index.html). Results are from duplicates of at least three independent experiments, and the bar graph shows mean ± SEM.
RhoA Activation Assay
Confluent serum-starved cells were treated with drugs and lysed on ice using lysis buffer (50 mM Tris, pH 7.5, 10 mM MgCl2, 0.5 M NaCl, 0.1% Triton X-100, and 0.1% sodium dodecyl sulfate [SDS]) containing a protease inhibitor cocktail (Sigma). The lysate was centrifuged for 5 minutes at 12,000g at 4°C. The supernatant was incubated with protein-agarose beads (Rhotekin-RBD, 20–30 μg; Cytoskeleton, Inc.) for 1 hour at 4°C. Beads were washed with ice-cold Tris buffer containing 10 mM MgCl2 and 150 mM NaCl and were spun at 5000 rpm. The immunoprecipitated complex was resuspended in 2× SDS sample buffer, boiled at 95°C for 10 minutes, and then subjected to 15% SDS-PAGE, followed by Western blot analysis. The separated proteins were immunoblotted with antibody against RhoA.
Measurements of Electrical Cell-Substrate Resistance by Impedance Analysis
Cells were seeded on gold electrodes (8W10E+) and placed in an incubator at 37°C with humidified air and 5% CO2. The attachment and spreading of the cells on the electrodes was monitored continuously at 4 kHz until the observed electrical resistance reached a plateau and stabilized. This usually occurred within 20 to 24 hours after inoculation. Impedance to current flow was measured at different frequencies (25–60 kHz) periodically before and after inoculation. After reaching the steady state of electrical-cell substrate resistance, cells were exposed to different agents, and the impedance was assessed at the different frequencies every 30 minutes. Change in the measured resistance normalized to that of the bare electrode was taken as a measure of cell-matrix adhesion, as discussed further below. Results from three independent experiments are expressed as mean ± SEM.
Immunofluorescence
Serum-starved cells were treated with the desired drugs for the given time period. After a quick rinse with phosphate-buffered saline, cells were fixed with 4% paraformaldehyde for 10 minutes and then permeabilized with 0.1% Triton X-100 for 10 minutes. To stain for pMLC, the cells were blocked with 10% goat serum + 3% BSA; for vinculin staining, the cells were blocked with 10% FBS for 1 hour. Cells were incubated in primary antibody overnight, followed by incubation in secondary antibody for 1 hour. Double staining for actin was performed by incubating cells in Texas-red conjugated phalloidin for 20 minutes. After extensive washing, the coverslips were mounted (ProLong AntiFade; Invitrogen). Images were acquired using a confocal microscope (SP5; Leica Microsystems, Bannockburn, IL). After similar treatment, DIC images of cells fixed on coverslips were obtained to study the morphologic changes induced by Y-27632 and Fsk. The images are representative of three independent experiments.
Statistical Analysis
One-way analysis of variance was used to compare mean values for different treatments with Bonferroni's posttest analysis (Prism 5.0 for Windows; GraphPad Software, Inc., San Diego, CA). P < 0.05 was considered statistically significant. Results are expressed as mean ± SEM. For analysis of electrical resistance results, normalized numerical values from individual experiments were pooled and are expressed as mean ± SEM. P < 0.05 was considered statistically significant (n denotes the number of independent experiments).
Results
Expression Profile of Adenylate Cyclases and Phosphodiesterases
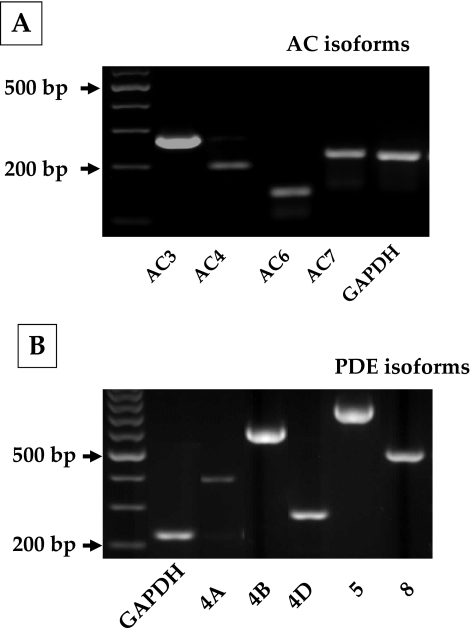
Before examining the cAMP effects, we characterized the gene expression profile of adenylate cyclases (ACs) and phosphodiesterases (PDEs) in bovine TM cells. To date, 10 subtypes of ACs (AC1–9 and sAC) and 11 PDE families (PDE1–11) with several isoforms have been identified in mammals; of these, expression of AC2 and AC4 and PDE4, PDE5, and PDE7 is reported in human TM cells.23,24 We examined the expression of AC1–9 and cAMP-specific PDE isoforms (4, 5, 7, and 8) in bovine TM cells. As shown in Figure 1A, AC isoforms 3, 4, 6, and 7 are expressed in these cells. Regarding PDEs, PDE4 and its splice variants—PDE4A, PDE4B, and PDE4D—in addition to PDE5 and PDE8, are expressed (Fig. 1B). We consistently noticed a band for PDE4C that was smaller than the expected gene product size (Fig. 1B) and turned out to be a nonspecific interaction. The primer sequences and expected product sizes are given in Tables 1 and 2 for ACs and PDEs, respectively. PDE4 isoforms are specific cAMP phosphodiesterases, and rolipram is a prototype among its inhibitors.25
Figure 1.
Gene expression of adenylate cyclase (AC) and phosphodiesterase (PDE) isoforms in bovine trabecular meshwork cells. The different AC (1–9) and cAMP-specific PDE isoforms (PDE3, 4, 5, and 8) were studied using total RNA and sequence-specific oligonucleotide primers. (A) Expression of AC isoforms 3, 4, 6, and 7 in bovine TM cells. (B) Expression of PDE4A, 4B, and 4D of the PDE4 family and PDE5 and 8. Expression of the other isoforms of ACs and PDEs was undetectable.
Influence of Forskolin and Rolipram on cAMP Levels
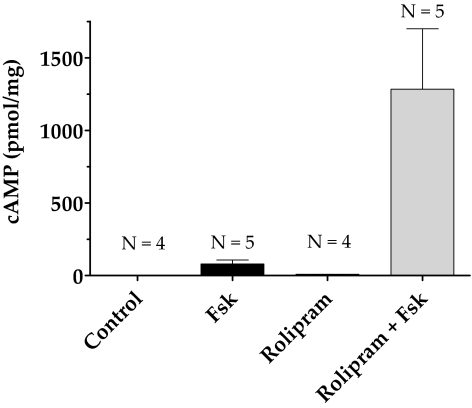
In our previous study, we showed that forskolin (10 μM), a direct activator of ACs, alone increased intracellular cAMP levels fourfold in bovine TM cells compared with untreated cells.20 As shown in Figure 2, Fsk (10 μM) cotreated with rolipram (50 μM), a selective PDE4 inhibitor, increased the cAMP level 10-fold compared with Fsk alone. The presence of rolipram alone led to a small but measurable increase over control. In the following experiments, cells were pretreated with rolipram (50 μM; 30 minutes) before exposure to Fsk (10 μM; 10 minutes) unless stated otherwise.
Figure 2.
Increase in intracellular cAMP levels with forskolin and rolipram. Serum-starved cells were treated with either rolipram (50 μΜ; 30 minutes; lane 3) or Fsk (10 μΜ; 10 minutes; lane 2) alone or pretreated with rolipram for 30 minutes, followed by Fsk for 10 minutes (lane 4). Treatment with Fsk alone increased cAMP levels to 80 ± 12 pmol/mg compared with control (1.67 ± 0.012 pmol/mg). Pretreatment with rolipram increased Fsk-induced cAMP levels to 1200 ± 185 pmol/mg (P < 0.05). Treatment with rolipram alone also led to a measurable increase in cAMP levels (10 ± 0.2 pmol/mg) compared with control. The results of three independent experiments are expressed as mean ± SEM.
Influence of Elevated Intracellular cAMP on Agonist-Induced Actomyosin Contraction
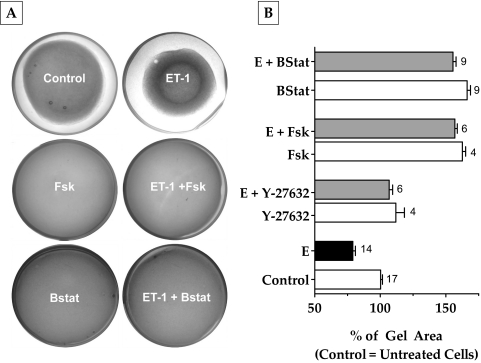
To understand the effects of cAMP on actomyosin contraction, we examined its influence on the extent of relaxation of collagen matrices containing bovine TM cells. Such gels, in the absence of cells, formed uniform thickness matrices of approximately 140 mm2 on polymerization. When cells were included during the preparation, there was a notable contraction of the gels to approximately 80 mm2 in 48 hours (Fig. 3A). The addition of ET-1 (100 nM) further contracted the gels by 20% compared with control (Fig. 3B). This effect of ET-1 was opposed by selective Rho kinase inhibitor Y-27632 (5 μM) by 25% and Fsk (10 μM) by 70%. This relaxation is more than that produced by Y-27632 (Fig. 3B). Treatment with blebbistatin (10 μM), a specific myosin II ATPase inhibitor, opposed (ET-1)–induced gel contraction to the same extent as Fsk (75%; Fig. 3B). Treatment with Y-27632, Fsk, and blebbistatin also prevented the basal level of contraction compared with control (12%, 60%, and 65%, respectively). These results confirm that the observed contraction and relaxation of the gels are mediated by actomyosin contraction of the embedded TM cells and that actomyosin contraction is opposed by elevated cAMP.
Figure 3.
Effect of elevated cAMP levels on collagen gel contraction. Cells grown embedded in collagen gels were treated with the indicated drug combinations for 48 hours. The area of the gels before the addition of drugs was approximately 140 mm2. (A, B) Treatment with ET-1 (100 nM) led to a 20% decrease in area compared with untreated cells. Addition of Y-27632 (5 μΜ) or Fsk (10 μΜ) + rolipram (50 μΜ) significantly opposed (ET-1)–induced gel contraction (Y-27632, 25%; Fsk, 70%; P < 0.0001). Blebbistatin (10 μΜ) also opposed (ET-1)–induced gel contraction by 75%, which is comparable to Fsk. These drugs opposed the basal level of gel contraction (B). The results of three independent experiments are expressed as mean ± SEM. E, endothelin-1; Bstat, blebbistatin, Fsk, forskolin.
Effect of Elevated Intracellular cAMP on RhoA Activation
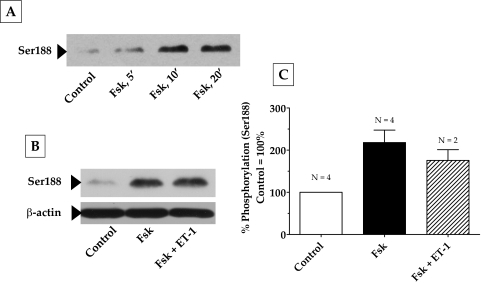
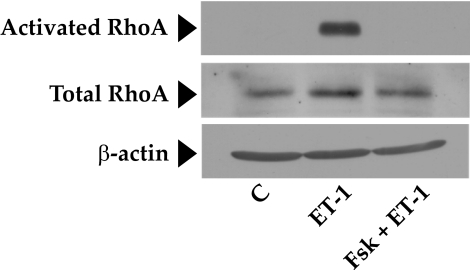
The RhoA-Rho kinase signaling pathway is the principal upstream mechanism for inducing actomyosin contraction and remodeling actin cytoskeleton in both smooth muscle cells (SMCs) and non-SMCs.26,27 This signaling pathway is impacted by a variety of kinases and phosphatases.26 To identify the mechanisms involved in the observed relaxation of the collagen gels in response to elevated cAMP, we first examined the putative crosstalk of the RhoA-Rho kinase axis with protein kinase A (PKA), an effector of cAMP. In several cell types, RhoA has been shown to be antagonized on phosphorylation of its Ser188 by PKA.28–30 Phosphorylation at this site is shown to increase the affinity of RhoA for its guanine dissociation inhibitor (GDI) so that RhoA activation is inhibited.28,29 As shown in Figure 4A, treatment with Fsk resulted in a time-dependent increase in the phosphorylation of RhoA at Ser188, with a maximum increase occurring at approximately 10 minutes and remaining stable for at least 20 minutes. Consistent with the phosphorylation of Ser188, we show that pretreatment of cells with forskolin led to a reduction in (ET-1)–induced RhoA activation (Fig. 5). However, phosphorylation at Ser188 in response to Fsk was unaffected by subsequent treatment with ET-1 (Figs. 4B, 4C). These results indicate that cAMP is an effective antagonist of RhoA because it not only inactivates RhoA but also prevents its further activation by an agonist.
Figure 4.
Phosphorylation of RhoA at Ser188 by elevated intracellular cAMP. Serum-starved cells were pretreated with Fsk + rolipram for 30 minutes followed by ET-1 for 10 minutes. (A) Fsk increased the phosphorylation of RhoA at Ser188 in a time-dependent manner, with a maximum increase occurring at 10 minutes, and remained constant until after 20 minutes. The increase in Ser188 phosphorylation by Fsk (217% compared with control 100%) was significant (P = 0.005) and unaffected by further treatment with ET-1 (B). (C) Bar graph of data from at least three independent experiments, similar to that in (B). Results are represented as mean ± SEM. ET-1, endothelin-1; Fsk, forskolin.
Figure 5.
Inhibition of RhoA activation by elevated intracellular cAMP. This figure shows that ET-1 induces a significant increase in active RhoA compared with control (middle lane). This increase was completely opposed by Fsk pretreatment (last lane). There was no change in the total levels of RhoA during the treatment period. β-Actin was used as a loading control. C, control; ET-1, endothelin-1.
Effect of Elevated Intracellular cAMP on MYPT1 and MLC Phosphorylation
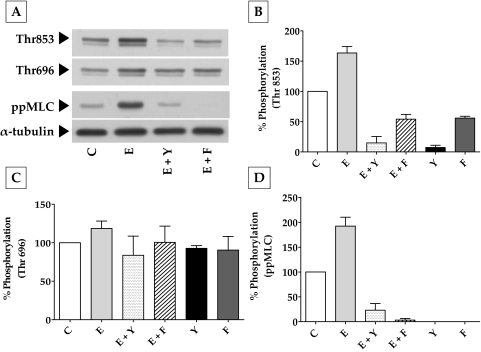
To further dissect these findings on RhoA and actomyosin contraction, we investigated the effect of elevated cAMP on (RhoA-Rho kinase)–mediated MLC phosphorylation. The focus on Rho kinase stems from the fact that it can phosphorylate MYPT1, the regulatory subunit of MLCP, at Thr696 and Thr853 and thereby inhibit the activity of its catalytic subunit PP1Cδ.31 This, in turn, prevents the phosphatase activity on MLC, thus leading to sustained actomyosin contraction.31 In Figure 6, we show that exposure to ET-1 increased the phosphorylation of MYPT1 at Thr853 by 63% compared with control (Figs. 6A, 6B). This was reduced by 150% and 120% on pretreatment with Y-27632 (5 μM) and Fsk (10 μM), respectively. As shown in Figure 6C, ET-1 did not influence phosphorylation at Thr696, and the phosphorylation levels were close to those of control, even in the presence of Y-27632 and Fsk. However, the changes in pMLC correlated with the changes in the phosphorylation at Thr853 (Fig. 6D). Treatment with Y-27632 and Fsk alone also led to a substantial decrease in the basal levels of MLC and MYPT1 phosphorylation at Thr853 with no apparent influence at Thr696. Taken together, these results (Figs. 3–6) clearly suggest that cAMP opposes actomyosin contraction partly by downregulating the RhoA-Rho kinase axis, culminating in the reduced phosphorylation of MYPT1 at Thr853 and of MLC.
Figure 6.
Effect of elevated intracellular cAMP on MYPT1 phosphorylation. (A) Typical Western blot showing the phosphorylation of MYPT1 at Thr853 and Thr696 and the phosphorylation of MLC in response to ET-1, Fsk, and Y-27632. (B) ET-1 (100 nM; 10 minutes) led to a significant (P < 0.0001) increase in the phosphorylation of MYPT1 at Thr853 (63% ± 4%) compared with the control (100%). This increase was opposed by Y-27632 (5 μM; 150% ± 5%) and Fsk (10 μΜ) + rolipram (50 μΜ; 120% ± 4%). These agents also reduced the basal level of Thr853 phosphorylation. (C) There was no significant change in the phosphorylation of Thr696 on treatment with ET-1, Y-27632, and Fsk. (D) Change in MLC phosphorylation was similar to the phosphorylation at Thr853. Endothelin-1 increased MLC phosphorylation (ppMLC) by 92% ± 9% over the control, which was opposed by both Y-27632 (165% ± 6.7%) and Fsk (190% ± 1.6%). The bar graphs show data from at least three independent experiments, and the results are expressed as mean ± SEM. C, control; E, endothelin-1; Y, Y-27632; Fsk, forskolin.
Effect of Elevated Intracellular cAMP on the Remodeling of Actin Cytoskeleton
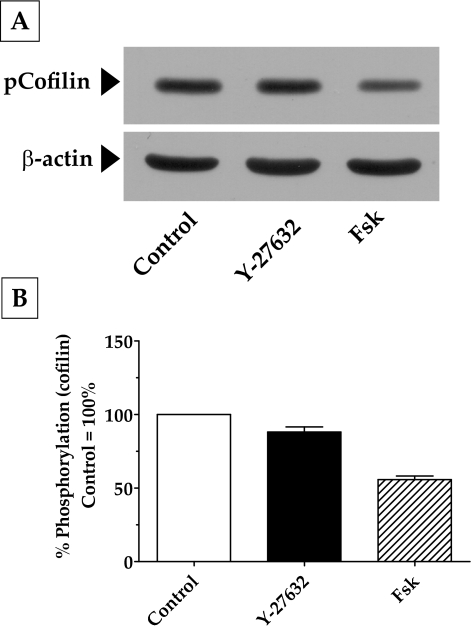
Apart from MYPT1, another downstream target of Rho kinase is a serine kinase, Lim kinase (LIMK-1 and LIMK-2). A well-known substrate for LIMK is cofilin, which is an actin-depolymerizing factor.32 Specifically, phosphorylation of LIMK-1 by Rho kinase has, in turn, been shown to phosphorylate cofilin at Ser3.32,33 This phosphorylation inhibits the activity of cofilin and contributes to the stabilization of F-actin. In our experiments, treatment with Fsk and Y-27632 led to a significant decrease in the phosphorylation of cofilin at Ser3 (Fig. 7). This finding is consistent with the decrease in Rho kinase activity in response to Fsk and Y-27632 that we noticed in the earlier experiments (Figs. 3, 6). Although significant (P < 0.05), as shown in Figure 7B, the extent of the reduction in Ser3 phosphorylation induced by Fsk (55%) was much greater than that induced by Y-27632 (15%), indicating the possibility that RhoA inhibition might not be the only pathway by which cAMP opposes actin polymerization.
Figure 7.
Effect of elevated intracellular cAMP on actin polymerization. (A) Treatment of cells with Fsk led to a significant decrease in cofilin phosphorylation at Ser3 (50%) compared with control (100%). The effect of Y-27632, although significant (15%; P < 0.05), was much less compared with that of Fsk. (B) Bar graph of results from three independent experiments similar to that in (A).
Effect of Elevated Intracellular cAMP on Cell Shape and Focal Adhesion
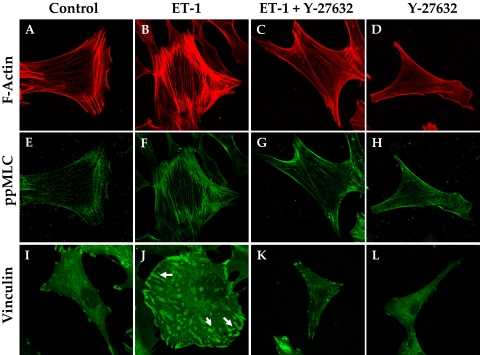
Consistent with the effect of Y-27632 on cofilin activity (Fig. 7), Rho kinase inhibitors are well known for inducing the dissolution of stress fibers, thus leading to relaxation.34 Loss of stress fibers, in turn, alters cellular morphology and the interaction of integrins with ECM ligands. In accordance with these reports, compared with untreated cells, treatment with ET-1 increased the intensity of staining for diphosphorylated MLC (pMLC), which colocalized with stress fibers (Figs. 8B, 8F vs. Figs. 8A, 8E). The intensity of immunostaining for vinculin, which is associated with the focal adhesion complex, was also increased by ET-1 compared to control (indicated by arrows in Fig. 8J vs. Fig. 8I). As shown in Figures 8C, 8G, and 8K, pretreatment with Y-27632 (5 μM, 1 hour) opposed the (ET-1)–induced increase in stress fibers, ppMLC, and focal adhesions. The effect of elevated cAMP was remarkably similar to that of Y-27632 (Fig. 9). Treatment with Fsk alone also resulted in a loss of stress fibers and reduced vinculin staining (Figs. 9D, 9L). Staining for ppMLC was diffuse (Fig. 9H). Pretreatment with Fsk (10 μM) completely reversed the (ET-1)–induced increase in stress fibers, pMLC, and focal adhesions (Figs. 9C, 9G, 9K vs. Figs. 9B, 9F, 9J). Again, consistent with the loss of stress fibers and focal adhesions in response to these inhibitors, treatment with Fsk produced apparent cell shrinkage (because of cell retraction and rounding) similar to that produced by Y-27632 when compared with untreated cells (Figs. 10B, 10C vs. Fig. 10A).
Figure 8.
Y-27632 opposes (ET-1)–induced increase in stress fibers and focal adhesions. Treatment of serum-starved cells with ET-1 (100 nM) increased the number of stress fibers compared with untreated cells (B vs. A) and an increase in the staining for phosphorylated MLC (F). There was an increase in the staining for vinculin in the presence of ET-1 (J, arrows). Y-27632 (5 μM) opposed both the basal and the (ET-1)–induced increase in stress fibers (C, D vs. B), pMLC (G, H vs. F) and focal adhesions (K, L vs. J). The images are representative of three independent experiments.
Figure 9.
Forskolin opposes (ET-1)–induced increase in stress fibers and focal adhesions. Treatment of serum-starved cells with ET-1 (100 nM) increased the staining for stress fibers compared with untreated cells (B vs. A) with a concomitant increase in the staining for MLC phosphorylation (F) and vinculin (J, arrows). Forskolin (10 μM) + rolipram (50 μM) opposed both the basal and the (ET-1)–induced increase in stress fibers (C, D vs. B), ppMLC (G, H vs. F), and focal adhesions (K, L vs. J). The images are representative of three independent experiments.
Figure 10.
Influence of elevated intracellular cAMP on cellular morphology. (A–C) DIC images of TM cells grown on coverslips. Untreated cells appeared flat (A), whereas treatment with Fsk (10 μM) + rolipram (50 μM) or Y-27632 (5 μM) for 1 hour led to a retraction of the cells, which assumed a stellate appearance (B, C).
Effect of Elevated Intracellular cAMP on Cell-Matrix Adhesion
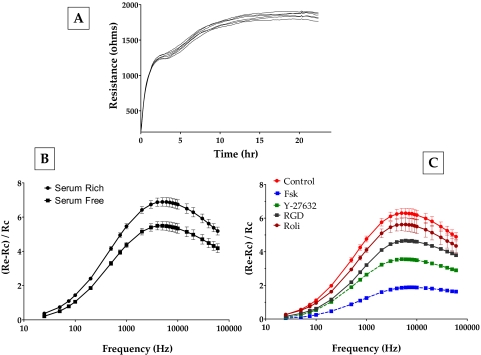
To observe these dynamics of the loss of cell-matrix adhesion, we used electric cell-substrate impedance sensing. This approach has been previously used to assess electrical cell-substrate resistance (ECSR) in fibroblasts.35,36 Figure 11A shows the evolution of ECSR after the bovine TM cells were seeded on gold electrodes. After an initial rapid phase of increase for 2 hours, the ECSR stabilized at a slightly higher value of approximately 1800 Ω (Fig. 11A). In the absence of cell-cell junctions involving the typical tight and adherens junctions in the TM,37 the measured resistance at >20 hours can be taken to represent resistance offered by cell-substrate interaction. In subsequent experiments, we tested for changes in ECSR as a marker of a dynamic response to changes in cell-matrix adhesion. Cells showing a steady ECSR were challenged with various agents; subsequently, resistance was measured at different frequencies to identify the sensitive frequency at which the change in impedance (and, hence, ECSR) would be the highest for bovine TM cells. Such profiles were normalized to bare electrode values and plotted to indicate the response to Fsk and Y-27632. As shown in Figure 11B, the addition of serum to serum-starved cells led to an increase in resistance. Serum is known to activate the RhoA signaling pathway (Ramachandran C, Srinivas SP, unpublished data, 2010) and was used as the control in subsequent experiments. It is evident from Figure 11C that Fsk induced a significant decrease in ECSR 1 hour after treatment (the decrease in ECSR starts at around 15 minutes). Y-27632 also led to a significant decrease, but one lower than that induced by Fsk (Fig. 11C). Treatment with rolipram alone led to a small but measurable decrease in the TER, consistent with the increase in cAMP levels induced by rolipram (Fig. 2). We also used a specific integrin-binding peptide (RGD peptide; 100 nM) to confirm that the measured changes in ECSR occurred as a result of a loss of cell-ECM adhesions. RGD-peptide led to a significant decrease in resistance within 1 hour of treatment (Fig. 11C). To ensure that the noted decrease in the resistance, especially with Fsk, was not caused by cytotoxicity, the cells were replaced with fresh medium after 1 hour of drug treatment. There was complete recovery in resistance within 24 hours (data not shown). Taken together, these experimental results not only confirm the immunofluorescence observations but also show clearly that the effects of cAMP mimic those of Y-27632.
Figure 11.
Effect of elevated intracellular cAMP on electrical cell-substrate resistance. To measure the changes in the resistance caused by ROCK inhibition, frequency scans were taken every 30 minutes to obtain resistance values across 23 frequencies (23–60 kHz) from each well. (A) Evolution of resistance after seeding TM cells. On inoculation, the resistance measured at 4 kHz increased within 3 hours. This was followed by a gradual increase in resistance, reaching a plateau around 24 hours. (B) The peak at approximately 7 kHz in the frequency scan represents the most sensitive measure of resistance for bovine TM cells. Addition of serum to serum-starved cells led to an increase in the resistance values (squares vs. circles). (C) The addition of forskolin + rolipram led to a significant decrease in resistance on 1 hour of treatment. Y-27632 led to a significant, but smaller, decrease in resistance compared with Fsk (C). Treatment with rolipram alone led to a measurable decrease in resistance. The presence of RGD peptide also led to a significant decrease in resistance. These data are from three independent experiments and are expressed as mean ± SEM.
Discussion
A number of previous investigations have indicated that agents such as epinephrine and its derivative dipivefrin are associated with a reduction in IOP by increasing the outflow facility across the TM.38,39 These agents directly activate β2-adrenergic receptors, which are known to be expressed in TM cells, and increase cAMP levels.38–41 In perfusion studies, Fsk has been noted to enhance outflow facility across the TM.9 Since decreased actomyosin contractility of TM cells elicits an increase in outflow facility, we previously tested the effect of elevated cAMP on actomyosin contraction in bovine TM cells and found that this second messenger is able to oppose RhoA activation and reduce MLC phosphorylation.20 In this study, we have further determined specific mechanisms by which cAMP opposes MLC phosphorylation and examined downstream effects of the consequential loss of actomyosin contraction. Our data demonstrate that elevated cAMP opposes actomyosin contraction largely by reducing the phosphorylation of MYPT1 at Thr853, similar to Rho kinase inhibitors. Furthermore, by relaxing actomyosin contractility, cAMP opposes cell-matrix adhesion, again, similar to Rho kinase inhibitors.
Influence of Elevated cAMP on Actomyosin Contraction
Based on our previous knowledge, we began testing the efficacy of elevated cAMP in reducing actomyosin contraction using a CGC assay and comparing the data with those for a commonly used Rho kinase inhibitor. The results show that elevated cAMP significantly opposed both basal and RhoA agonist-induced contraction. Forskolin and rolipram at 10 μM and 50 μM produced relaxation, which was more than that induced by Y-27632 (5 μM) and comparable to that induced by blebbistatin (10 μM). As a selective inhibitor of myosin II ATPase, blebbistatin has an IC50 of 5 μM and 2 μM for nonmuscle myosin IIA and IIB in cell-free tests,42 respectively, but we used the inhibitor previously at a concentration of 10 μM in endothelial cells to induce maximum inhibition.43 In the present study, 10 μM blebbistatin produced 100% relaxation of the (ET-1)–induced contraction of the collagen matrix. In addition to confirming that CGC assay is sensitive to changes in the actomyosin contraction of the embedded TM cells, our data show that elevated cAMP produces maximum relaxation that can be expected through the inhibition of actomyosin contraction.
To explore the mechanism of action of this cAMP effect, we analyzed its influence on the biochemical mechanisms that orchestrate actomyosin contraction. As in SMCs, pMLC brings about actomyosin contraction in non-SMCs. MLCK phosphorylates MLC at Ser19 and Thr18 in a Ca2+-dependent manner.26,44 In this study, we did not consider the possible direct effect of cAMP on MLCK because it has not been reported in cellular systems. The other alternative is the Ca2+-sensitization pathway involving MLCP, which on activation leads to MLC dephosphorylation. As shown in a variety of endothelial cells and SMCs, various kinases (PKC, PKA, ILK, ZIP kinase) and RhoA-Rho kinase signaling pathways are implicated in the regulation of the phosphatase subunit of MLCP, namely PP1Cδ.45 There are no known crosstalk mechanisms between PKA and PKC, ILK, and ZIP kinase in the context of actomyosin contraction. Given that the RhoA-Rho kinase-signaling pathway has emerged as an important regulator of MLCP activity, the present study is focused on understanding the crosstalk of MLCP with the cAMP-PKA axis.
As noted earlier, Rho kinase modulates MLCP through its myosin-binding subunit, MYPT1.46 Specifically, a number of studies have shown that Rho kinase can phosphorylate MYPT1 at Ser854, Thr853, and Thr696 with an associated increase in actomyosin contraction.47,48 On phosphorylation, these sites can bind to the substrate site on PP1Cδ and thereby block access to MLC for its dephosphorylation.49 This results in Ca2+-sensitization–induced sustained MLC phosphorylation and actomyosin contraction. We examined these mechanisms in bovine TM cells using ET-1 to mobilize the RhoA-Rho kinase axis. In accordance with previous reports, treatment with ET-1 led to RhoA activation and increased the phosphorylation of MYPT1 at Thr853 with a concomitant increase in pMLC.47 However, in our study, ET-1 had no effect on Thr696 phosphorylation, which could have been attributed to the high levels of Thr696 phosphorylation under resting conditions because of the spontaneous phosphorylation occurring at this site.50 Other studies have reported a further increase in Thr696 phosphorylation by agonists in hypercontractile tissues51 and under disease conditions (e.g., diabetes, hypertension).52,53
As discussed, we noticed that elevated cAMP completely blocks the (ET-1)–induced RhoA activation. This finding is consistent with our previous report.20 The inhibition could be attributed to the phosphorylation of RhoA at Ser188. This PKA-dependent phosphorylation has been shown to increase the binding of RhoA-GTP to its GDI and its subsequent extraction from the plasma membrane, thus halting the downstream activity of RhoA.28,29 Another potential mechanism involves direct phosphorylation of the Rho GDI by PKA, thereby increasing its affinity for RhoA54 and limiting RhoA activation. Even though RhoA inactivation in response to increased intracellular cAMP is certain, whether the aforementioned second mechanism is also operative in bovine TM cells must be examined further. However, there is some evidence that this mechanism might be in effect based on our data that the addition of ET-1 after treatment with Fsk did not significantly alter the phosphorylation levels of Ser188 (Fig. 4). This suggests that cAMP not only inactivates GTP-bound RhoA but might also sequester RhoA through the direct phosphorylation of Rho-GDI, thereby preventing its activation.
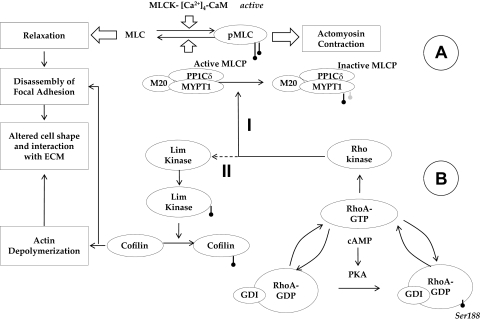
Since the major focus of the present study is on actomyosin contraction, we investigated the effects of elevated intracellular cAMP on signaling downstream of Rho kinase (summarized in Fig. 12). We observed that the inhibition of RhoA activation by elevated intracellular cAMP translates to reduced MYPT1 phosphorylation at Thr853, without any measurable effect on phosphorylation at Thr696. This is surprising because studies have demonstrated that elevated levels of intracellular cyclic nucleotides can phosphorylate MYPT1 at Ser695, which blocks the phosphorylation at Thr696 by Rho kinase, resulting in the activation of MLCP and consequential relaxation.55,56 However, treatment with Fsk did not decrease (ET-1)–induced, or the basal level of, Thr696 phosphorylation. Consistent with our finding, a previous study showed that, in intact cerebral artery, the phosphorylation of Ser695 did not influence Rho kinase-induced phosphorylation at Thr696.57
Figure 12.
Crosstalk between cAMP-PKA and RhoA-Rho kinase in the signaling of actomyosin contraction. (A) Overview of MLC phosphorylation: MLC kinase (MLCK) drives phosphorylation and MLC phosphatase (MLCP) induces the dephosphorylation of MLC. MLCP is a trimeric complex consisting of a catalytic subunit (PP1Cδ), a myosin-binding subunit (MYPT1), and a subunit of unknown function (M20). Phosphorylation of MYPT1 by Rho kinase at Thr853 inactivates PP1Cδ, leading to sustained actomyosin contraction. (B) Impact of elevated cAMP on actin cytoskeleton: Protein kinase A (PKA), an effector of cAMP, phosphorylates RhoA at Ser188, which increases the affinity of the small GTPase to its GDI. Thus, PKA blocks RhoA activation and thereby reduces the phosphorylation of MYPT1 (Mechanism I) and Lim kinase (Mechanism II). Through Mechanism I, actomyosin contraction is directly reduced. On the other hand, Mechanism II results in the activation of cofilin (by dephosphorylation), causing depolymerization of the actin cytoskeleton, which results in a reduction in stress fibers. In summary, through the inhibition of RhoA, cAMP induces the loss of actomyosin contraction. This loss, in turn, weakens the focal adhesions, which manifests as a change in cell morphology.
Influence of Elevated intracellular cAMP on Cell-Matrix Adhesion
It is well known that altered ECM plays a major role in the modulation of resistance to aqueous humor outflow across the TM.58 In fact, an increase in ECM deposition and changes in its composition are reported in glaucomatous TM.59,60 In addition to the direct effect of reducing the porosity of the TM, increased ECM and its altered composition can impact actomyosin contraction through integrins. The latter are membrane receptors linking the stress fibers with the ECM. Since integrin signaling is bidirectional (i.e., inside-out and outside-in),61 altered actomyosin contraction can be expected to elicit remodeling of the ECM. Accordingly, a recent study on TM has shown that sustained actomyosin contraction, associated with increased pMLC and stress fibers, increases focal adhesions and the accumulation of ECM proteins.62 Similarly, a number of studies have demonstrated a reduction in focal adhesion complexes, which interact with the cytoplasmic domain of integrins, in response to a decrease in actomyosin contraction.34,63 In the present study, we found that elevated intracellular cAMP reduced the staining for vinculin, indicating the loss of cell-matrix adhesion concomitant with the loss of stress fibers and ppMLC. This finding was further confirmed by measurements of impedance to current flow across the cell-substrate complex. Exposure of cells to Fsk led to a reversible decrease in ECSR at 7 kHz. This result is in accordance with a report that showed that an increase in paracellular space between TM cells led to an increase in the hydraulic conductivity of the cellular layer.64 The apparent shrinkage of cells, as noted in our experiments, would lead to an increase in the intercellular space resulting in a decrease in resistance. The reciprocal relation between actin cytoskeleton and the ECM is evident in our experiments with RGD-peptide. When RGD peptide was used to disengage the integrin-ECM interactions to reduce the cell-matrix adhesion, it led to a decrease in ECSR and a loss of stress fibers (data not shown). Consistent with our findings, Shen et al.65 provided evidence for the importance of cAMP in the regulation of actomyosin contraction and, therefore, cell-ECM interaction. In their study, overexpression of myocilin, an ECM protein thought to be involved in the pathogenesis of glaucoma,66 was shown to lead to a loss of cell-ECM adhesions and a decrease in the production of ECM proteins concomitant with a loss of stress fibers. These effects of myocilin were shown to be associated with an increase in cAMP-PKA activity and a decrease in RhoA activity.
Finally, we noted in all our data, with or without ET-1, that the effects of cAMP were similar to those induced by Y-27632. This finding was true for the specific dephosphorylation of MYPT1 at Thr853, loss of stress fibers, reduced staining for focal adhesions, and reduction in ECSR. In conclusion, this study shows that the major effect of elevated intracellular cAMP on MLCP activity and actomyosin contraction is mediated through the inhibition of RhoA.
Footnotes
Supported by National Institutes of Health Grant R21-EY019119 and by an Indiana University Faculty Research Grant (SPS).
Disclosure: C. Ramachandran, None; R.V. Patil, Alcon Research Ltd. (E); N.A. Sharif, Alcon Research Ltd. (E); S.P. Srinivas, None
References
- 1. Quigley HA, Broman AT. The number of people with glaucoma worldwide in 2010 and 2020. Br J Ophthalmol. 2006;90:262–267 [DOI] [PMC free article] [PubMed] [Google Scholar]
- 2. Mackenzie P, Cioffi G. How does lowering of intraocular pressure protect the optic nerve? Surv Ophthalmol. 2008;53(suppl 1):S39–S43 [DOI] [PubMed] [Google Scholar]
- 3. Tsai JC, Kanner EM. Current and emerging medical therapies for glaucoma. Expert Opin Emerg Drugs. 2005;10:109–118 [DOI] [PubMed] [Google Scholar]
- 4. Bill A, Phillips CI. Uveoscleral drainage of aqueous humour in human eyes. Exp Eye Res. 1971;12:275–281 [DOI] [PubMed] [Google Scholar]
- 5. van der Valk R, Webers CA, Schouten JS, Zeegers MP, Hendrikse F, Prins MH. Intraocular pressure-lowering effects of all commonly used glaucoma drugs: a meta-analysis of randomized clinical trials. Ophthalmology. 2005;112:1177–1185 [DOI] [PubMed] [Google Scholar]
- 6. Bill A. Uveoscleral drainage of aqueous humor: physiology and pharmacology. Prog Clin Biol Res. 1989;312:417–427 [PubMed] [Google Scholar]
- 7. Kaufman PL, Crawford K. Aqueous humor dynamics: how PGF2 alpha lowers intraocular pressure. Prog Clin Biol Res. 1989;312:387–416 [PubMed] [Google Scholar]
- 8. Maepea O, Bill A. Pressures in the juxtacanalicular tissue and Schlemm's canal in monkeys. Exp Eye Res. 1992;54:879–883 [DOI] [PubMed] [Google Scholar]
- 9. Bartels SP, Lee SR, Neufeld AH. Forskolin stimulates cyclic AMP synthesis, lowers intraocular pressure and increases outflow facility in rabbits. Curr Eye Res. 1982;2:673–681 [DOI] [PubMed] [Google Scholar]
- 10. Rao PV, Deng P, Sasaki Y, Epstein DL. Regulation of myosin light chain phosphorylation in the trabecular meshwork: role in aqueous humour outflow facility. Exp Eye Res. 2005;80:197–206 [DOI] [PubMed] [Google Scholar]
- 11. Tian B, Gabelt BT, Geiger B, Kaufman PL. The role of the actomyosin system in regulating trabecular fluid outflow. Exp Eye Res. 2009;88:713–717 [DOI] [PMC free article] [PubMed] [Google Scholar]
- 12. Zhang M, Maddala R, Rao PV. Novel molecular insights into RhoA GTPase-induced resistance to aqueous humor outflow through the trabecular meshwork. Am J Physiol Cell Physiol. 2008;295:C1057–C1070 [DOI] [PMC free article] [PubMed] [Google Scholar]
- 13. Honjo M, Tanihara H, Inatani M, et al. Effects of rho-associated protein kinase inhibitor Y-27632 on intraocular pressure and outflow facility. Invest Ophthalmol Vis Sci. 2001;42:137–144 [PubMed] [Google Scholar]
- 14. Tokushige H, Inatani M, Nemoto S, et al. Effects of topical administration of y-39983, a selective rho-associated protein kinase inhibitor, on ocular tissues in rabbits and monkeys. Invest Ophthalmol Vis Sci. 2007;48:3216–3222 [DOI] [PubMed] [Google Scholar]
- 15. Tian B, Kaufman PL. Effects of the Rho kinase inhibitor Y-27632 and the phosphatase inhibitor calyculin A on outflow facility in monkeys. Exp Eye Res. 2005;80:215–225 [DOI] [PubMed] [Google Scholar]
- 16. Song J, Deng PF, Stinnett SS, Epstein DL, Rao PV. Effects of cholesterol-lowering statins on the aqueous humor outflow pathway. Invest Ophthalmol Vis Sci. 2005;46:2424–2432 [DOI] [PubMed] [Google Scholar]
- 17. Gilabert R, Gasull X, Pales J, Belmonte C, Bergamini MV, Gual A. Facility changes mediated by cAMP in the bovine anterior segment in vitro. Vision Res. 1997;37:9–15 [DOI] [PubMed] [Google Scholar]
- 18. Kaufman PL. Adenosine 3′,5′-cyclic-monophosphate and outflow facility in monkey eyes with intact and retrodisplaced ciliary muscle. Exp Eye Res. 1987;44:415–423 [DOI] [PubMed] [Google Scholar]
- 19. Neufeld AH, Sears ML. Adenosine 3′,5′-monophosphate analogue increases the outflow facility of the primate eye. Invest Ophthalmol. 1975;14:688–689 [PubMed] [Google Scholar]
- 20. Ramachandran C, Satpathy M, Mehta D, Srinivas SP. Forskolin induces myosin light chain dephosphorylation in bovine trabecular meshwork cells. Curr Eye Res. 2008;33:169–176 [DOI] [PubMed] [Google Scholar]
- 21. Nakamura Y, Sagara T, Seki K, Hirano S, Nishida T. Permissive effect of fibronectin on collagen gel contraction mediated by bovine trabecular meshwork cells. Invest Ophthalmol Vis Sci. 2003;44:4331–4336 [DOI] [PubMed] [Google Scholar]
- 22. Koga T, Koga T, Awai M, Tsutsui J, Yue BY, Tanihara H. Rho-associated protein kinase inhibitor, Y-27632, induces alterations in adhesion, contraction and motility in cultured human trabecular meshwork cells. Exp Eye Res. 2006;82:362–370 [DOI] [PubMed] [Google Scholar]
- 23. Zhang X, Wang N, Schroeder A, Erickson KA. Expression of adenylate cyclase subtypes II and IV in the human outflow pathway. Invest Ophthalmol Vis Sci. 2000;41:998–1005 [PubMed] [Google Scholar]
- 24. Zhou L, Thompson WJ, Potter DE. Multiple cyclic nucleotide phosphodiesterases in human trabecular meshwork cells. Invest Ophthalmol Vis Sci. 1999;40:1745–1752 [PubMed] [Google Scholar]
- 25. Dyke HJ, Montana JG. Update on the therapeutic potential of PDE4 inhibitors. Expert Opin Investig Drugs. 2002;11:1–13 [DOI] [PubMed] [Google Scholar]
- 26. Somlyo AP, Somlyo AV. Ca2+ sensitivity of smooth muscle and nonmuscle myosin II: modulated by G proteins, kinases, and myosin phosphatase. Physiol Rev. 2003;83:1325–1358 [DOI] [PubMed] [Google Scholar]
- 27. Srinivas SP, Satpathy M, Guo Y, Anandan V. Histamine-induced phosphorylation of the regulatory light chain of myosin II disrupts the barrier integrity of corneal endothelial cells. Invest Ophthalmol Vis Sci. 2006;47:4011–4018 [DOI] [PubMed] [Google Scholar]
- 28. Lang P, Gesbert F, Delespine-Carmagnat M, Stancou R, Pouchelet M, Bertoglio J. Protein kinase A phosphorylation of RhoA mediates the morphological and functional effects of cyclic AMP in cytotoxic lymphocytes. EMBO J. 1996;15:510–519 [PMC free article] [PubMed] [Google Scholar]
- 29. Qiao J, Huang F, Lum H. PKA inhibits RhoA activation: a protection mechanism against endothelial barrier dysfunction. Am J Physiol Lung Cell Mol Physiol. 2003;284:L972–L980 [DOI] [PubMed] [Google Scholar]
- 30. Ellerbroek SM, Wennerberg K, Burridge K. Serine phosphorylation negatively regulates RhoA in vivo. J Biol Chem. 2003;278:19023–19031 [DOI] [PubMed] [Google Scholar]
- 31. Hartshorne DJ. Myosin phosphatase: subunits and interactions. Acta Physiol Scand. 1998;164:483–493 [DOI] [PubMed] [Google Scholar]
- 32. Bamburg JR. Proteins of the ADF/cofilin family: essential regulators of actin dynamics. Annu Rev Cell Dev Biol. 1999;15:185–230 [DOI] [PubMed] [Google Scholar]
- 33. Sumi TMK, Nakamura T. Specific activation of LIM kinase 2 via phosphorylation of threonine 505 by ROCK, a Rho-dependent protein kinase. J Biol Chem. 2001;276:670–676 [DOI] [PubMed] [Google Scholar]
- 34. Koga T, Awai M, Tsutsui J, Yue BY, Tanihara H. Rho-associated protein kinase inhibitor, Y-27632, induces alterations in adhesion, contraction and motility in cultured human trabecular meshwork cells. Exp Eye Res. 2006;82:362–370 [DOI] [PubMed] [Google Scholar]
- 35. Atienza JM, Zhu J, Wang X, Xu X, Abassi Y. Dynamic monitoring of cell adhesion and spreading on microelectronic sensor arrays. J Biomol Screen. 2005;10:795–805 [DOI] [PubMed] [Google Scholar]
- 36. Nguyen DD, Huang X, Greve DW, Domach MM. Fibroblast growth and H-7 protein kinase inhibitor response monitored in microimpedance sensor arrays. Biotechnol Bioeng. 2004;87:138–144 [DOI] [PubMed] [Google Scholar]
- 37. Grierson I, Lee WR. Junctions between the cells of the trabecular meshwork. Albrecht von Graefes Archiv fur klinische und experimentelle Ophthalmologie. 1974;192:89–104 [DOI] [PubMed] [Google Scholar]
- 38. Polansky JR. Beta-adrenergic therapy for glaucoma. Int Ophthalmol Clin. 1990;30:219–229 [DOI] [PubMed] [Google Scholar]
- 39. Kaufman PL, Barany EH. Adrenergic drug effects on aqueous outflow facility following ciliary muscle retrodisplacement in the cynomolgus monkey. Invest Ophthalmol Vis Sci. 1981;20:644–651 [PubMed] [Google Scholar]
- 40. Alvarado JA, Franse-Carman L, McHolm G, Murphy C. Epinephrine effects on major cell types of the aqueous outflow pathway: in vitro studies/clinical implications. Trans Am Ophthalmol Soc. 1990:267–282; discussion 283–288 [PMC free article] [PubMed] [Google Scholar]
- 41. Friedman Z, Bloom E, Polansky JR. Adrenergic drug effects on cyclic AMP in cultured human trabecular meshwork cells. Ophthal Res. 1999;31:53–58 [DOI] [PubMed] [Google Scholar]
- 42. Limouze J, Straight AF, Mitchison T, Sellers JR. Specificity of blebbistatin, an inhibitor of myosin II. J Muscle Res Cell Motil. 2004;25:337–341 [DOI] [PubMed] [Google Scholar]
- 43. Ponsaerts R, D'Hondt C, Bultynck G, Srinivas SP, Vereecke J, Himpens B. The myosin II ATPase inhibitor blebbistatin prevents thrombin-induced inhibition of intercellular calcium wave propagation in corneal endothelial cells. Invest Ophthalmol Vis Sci. 2008;49:4816–4827 [DOI] [PubMed] [Google Scholar]
- 44. Somlyo AP, Somlyo AV. Signal transduction and regulation in smooth muscle. Nature. 1994;372:231–236 [DOI] [PubMed] [Google Scholar]
- 45. Hirano K, Derkach DN, Hirano M, Nishimura J, Kanaide H. Protein kinase network in the regulation of phosphorylation and dephosphorylation of smooth muscle myosin light chain. Mol Cell Biochem. 2003;248:105–114 [DOI] [PubMed] [Google Scholar]
- 46. Hartshorne DJ, Ito M, Erdodi F. Myosin light chain phosphatase: subunit composition, interactions and regulation. J Muscle Res Cell Motil. 1998;19:325–341 [DOI] [PubMed] [Google Scholar]
- 47. Muranyi A, Derkach D, Erdodi F, Kiss A, Ito M, Hartshorne DJ. Phosphorylation of Thr695 and Thr850 on the myosin phosphatase target subunit: inhibitory effects and occurrence in A7r5 cells. FEBS Lett. 2005;579:6611–6615 [DOI] [PubMed] [Google Scholar]
- 48. Fukiage C, Mizutani K, Kawamoto Y, Azuma M, Shearer TR. Involvement of phosphorylation of myosin phosphatase by ROCK in trabecular meshwork and ciliary muscle contraction. Biochem Biophys Res Commun. 2001;288:296–300 [DOI] [PubMed] [Google Scholar]
- 49. Khromov A, Choudhury N, Stevenson AS, Somlyo AV, Eto M. Phosphorylation-dependent autoinhibition of myosin light chain phosphatase accounts for Ca2+ sensitization force of smooth muscle contraction. J Biol Chem. 2009;284:21569–21579 [DOI] [PMC free article] [PubMed] [Google Scholar]
- 50. Kitazawa T, Eto M, Woodsome TP, Khalequzzaman M. Phosphorylation of the myosin phosphatase targeting subunit and CPI-17 during Ca2+ sensitization in rabbit smooth muscle. J Physiol. 2003;546:879–889 [DOI] [PMC free article] [PubMed] [Google Scholar]
- 51. Seko T, Ito M, Kureishi Y, et al. Activation of RhoA and inhibition of myosin phosphatase as important components in hypertension in vascular smooth muscle. Circ Res. 2003;92:411–418 [DOI] [PubMed] [Google Scholar]
- 52. Hilgers RH, Todd J, Jr, Webb RC. Increased PDZ-RhoGEF/RhoA/Rho kinase signaling in small mesenteric arteries of angiotensin II-induced hypertensive rats. J Hypertens. 2007;25:1687–1697 [DOI] [PubMed] [Google Scholar]
- 53. Sandu OA, Ito M, Begum N. Selected contribution: insulin utilizes NO/cGMP pathway to activate myosin phosphatase via Rho inhibition in vascular smooth muscle. J Appl Physiol. 2001;91:1475–1482 [DOI] [PubMed] [Google Scholar]
- 54. Qiao J, Holian O, Lee BS, Huang F, Zhang J, Lum H. Phosphorylation of GTP dissociation inhibitor by PKA negatively regulates RhoA. Am J Physiol Cell Physiol. 2008;295:C1161–C1168 [DOI] [PMC free article] [PubMed] [Google Scholar]
- 55. Wooldridge AA, MacDonald JA, Erdodi F, et al. Smooth muscle phosphatase is regulated in vivo by exclusion of phosphorylation of threonine 696 of MYPT1 by phosphorylation of Serine 695 in response to cyclic nucleotides. J Biol Chem. 2004;279:34496–34504 [DOI] [PubMed] [Google Scholar]
- 56. Sriwai W, Zhou H, Murthy KS. G(q)-dependent signalling by the lysophosphatidic acid receptor LPA(3) in gastric smooth muscle: reciprocal regulation of MYPT1 phosphorylation by Rho kinase and cAMP-independent PKA. Biochem J. 2008;411:543–551 [DOI] [PMC free article] [PubMed] [Google Scholar]
- 57. Neppl RL, Lubomirov LT, Momotani K, Pfitzer G, Eto M, Somlyo AV. Thromboxane A2-induced bi-directional regulation of cerebral arterial tone. J Biol Chem. 2009;284:6348–6360 [DOI] [PMC free article] [PubMed] [Google Scholar]
- 58. Acott TS, Kelley MJ. Extracellular matrix in the trabecular meshwork. Exp Eye Res. 2008;86:543–561 [DOI] [PMC free article] [PubMed] [Google Scholar]
- 59. Lutjen-Drecoll E, Rittig M, Rauterberg J, Jander R, Mollenhauer J. Immunomicroscopical study of type VI collagen in the trabecular meshwork of normal and glaucomatous eyes. Exp Eye Res. 1989;48:139–147 [DOI] [PubMed] [Google Scholar]
- 60. Lutjen-Drecoll E, Shimizu T, Rohrbach M, Rohen JW. Quantitative analysis of ‘plaque material’ in the inner- and outer wall of Schlemm's canal in normal- and glaucomatous eyes. Exp Eye Res. 1986;42:443–455 [DOI] [PubMed] [Google Scholar]
- 61. Schoenwaelder SM, Burridge K. Bidirectional signaling between the cytoskeleton and integrins. Curr Opin Cell Biol. 1999;11:274–286 [DOI] [PubMed] [Google Scholar]
- 62. Pattabiraman PP, Rao PV. Mechanistic basis of Rho GTPase-induced extracellular matrix synthesis in trabecular meshwork cells. Am J Physiol Cell Physiol. 298:C749–C763 [DOI] [PMC free article] [PubMed] [Google Scholar]
- 63. Rao PV, Deng PF, Kumar J, Epstein DL. Modulation of aqueous humor outflow facility by the Rho kinase-specific inhibitor Y-27632. Invest Ophthalmol Vis Sci. 2001;42:1029–1037 [PubMed] [Google Scholar]
- 64. Alvarado JA, Murphy CG, Franse-Carman L, Chen J, Underwood JL. Effect of beta-adrenergic agonists on paracellular width and fluid flow across outflow pathway cells. Invest Ophthalmol Vis Sci. 1998;39:1813–1822 [PubMed] [Google Scholar]
- 65. Shen X, Koga T, Park BC, SundarRaj N, Yue BY. Rho GTPase and cAMP/protein kinase A signaling mediates myocilin-induced alterations in cultured human trabecular meshwork cells. J Biol Chem. 2008;283:603–612 [DOI] [PMC free article] [PubMed] [Google Scholar]
- 66. Resch ZT, Fautsch MP. Glaucoma-associated myocilin: a better understanding but much more to learn. Exp Eye Res. 2009;88:704–712 [DOI] [PMC free article] [PubMed] [Google Scholar]


