This work characterized fundamental physiologic parameters of aqueous humor drainage in the mouse eye. It demonstrated that the mouse eye is a good model for human glaucoma.
Abstract
Purpose.
Mice are commonly used in glaucoma research, but relatively little is known about aqueous outflow dynamics in the species. To facilitate future use of the mouse as a model of aqueous humor outflow, several fundamental physiological parameters were measured in the mouse eye.
Methods.
Eyes from adult mice of either sex (C57BL/6 background) were enucleated, cannulated with a 33-gauge needle, and perfused at constant pressure while inflow was continuously measured.
Results.
At 8 mm Hg, total outflow facility (Ctotal) was 0.022 ± 0.005 μL/min/mm Hg (all values mean ± SD; n = 21). The flow–pressure relationship was linear up to 35 mm Hg. The conventional outflow facility (Cconv) was 0.0066 ± 0.0009 μL/min/mm Hg, and the unconventional outflow (Fu) was 0.114 ± 0.019 μL/min, both measured at room temperature. At 8 mm Hg, 66% of the outflow was via the unconventional pathway. In a more than 2-hour-long perfusion at 8 mm Hg, the rate of facility change was 2.4% ± 5.4% (n = 11) of starting facility per hour. The ocular compliance (0.086 ± 0.017 μL/mm Hg; n = 5) was comparable to the compliance of the perfusion system (0.100 ± 0.004 μL/mm Hg).
Conclusions.
Mouse eyes are similar to human eyes, in that they have no detectable washout rate and a linear pressure–flow relationship over a broad range of intraocular pressures. Because of the absence of washout and the apparent presence of a true Schlemm's canal, the mouse is a useful model for studying the physiology of the inner wall of Schlemm's canal and the conventional outflow tissues.
Glaucoma is the second most common cause of blindness worldwide, and is frequently associated with increased intraocular pressure (IOP) due to impaired aqueous humor drainage. Because of their low cost and the opportunities for genetic manipulation, mice have been widely used for several years in glaucoma research. Most work in mice has involved gaining a better understanding of the pathophysiology of retinal ganglion cell dysfunction in glaucoma; fewer studies to date have examined the pathophysiology of ocular hypertension, per se, in the mouse. The lack of such studies is undoubtedly due, at least in part, to the mouse eye's very small size (∼3 mm in diameter), small anterior chamber volume (<5 μL1), and shallow angle, all of which conspire to make studying aqueous humor drainage in the mouse technically challenging.
Some work has been performed on the basic physiology of mouse aqueous humor drainage, although it is still not completely understood. Zhang et al.,2 using cannulation and two-level outflow facility determination, were the first to characterize aqueous humor dynamics in mouse eyes. Subsequently, Aihara et al.,3 Zhang et al.4 and Millar et al. (IOVS 2008;49:ARVO E-Abstract 354) also perfused mouse eyes by using a two-level approach, with either pressure or flow control. The two-level approach is the gold standard for in vivo facility measurements, but it is difficult to perform certain manipulations in vivo (e.g., very long-term perfusions and looking at a wide range of pressures).
Our goal in this work was to measure several fundamental physiological parameters related to aqueous humor dynamics in the mouse eye. These parameters are well-established in other species and include the relationship between IOP and aqueous outflow resistance, ocular compliance, and washout rate.
Methods
Mouse Eye Perfusion
All experiments were performed in compliance with the ARVO Statement for the Use of Animals in Ophthalmic and Vision Research. Most perfusions were performed in adult mice (age, 10–20 weeks) of either sex (C57BL/6 background), although eyes from four 6-week-old and five 33-week-old mice were also perfused. The mice were killed by surgically dislocating the neck, and the eyes were enucleated within 10 minutes of death and kept in Dulbecco's modified Eagle's medium (ATCC-LGC Standards, Teddington, UK) at room temperature until perfusion. The elapsed time from enucleation to perfusion was 1 to 4 hours. Enucleated eyes had an attached ring of muscle that was carefully draped over and glued onto a single well within a 96-well plate (Stripwell; Corning, Poole, UK) filled with moist gauze to form a flat platform (Supplementary Fig. S1, http://www.iovs.org/lookup/suppl/doi:10.1167/iovs.10-6019/-/DCSupplemental). A 33-gauge bevelled tip needle (tip outer diameter, 210 μm; inner diameter, 115 μm; length, 10 mm; stainless steel tip material; Nanofil; World Precision Instruments, Stevenage, UK) was used to cannulate the eye. The cannulation needle was mounted on a micromanipulator, and was connected to a glass syringe (50 μL; Hamilton, Logan, UT) and a pressure transducer (model 142PC01G; Honeywell, Fort Washington, PA) via pressure tubing (inner diameter, 0.020 in., outer diameter 1/16 in.; PEEK; Sigma-Aldrich, Poole, UK) and a T-junction (Supplementary Fig. S1, http://www.iovs.org/lookup/suppl/doi:10.1167/iovs.10-6019/-/DCSupplemental).
The perfusion system was a modified version of that described previously.5 Briefly, it consisted of a computer-controlled syringe pump that delivered a variable flow rate (Q) to the anterior chamber so as to maintain a desired IOP, as monitored by the pressure transducer connected to a computer control system (Labview software; National Instruments, Newbury, UK). The syringe pump (model 33; Harvard Apparatus, Holliston, MA) had a specially machined lead screw (40 threads/in.), which allowed higher accuracy at lower flow rates with less oscillation.
Eyes were perfused with Dulbecco's phosphate-buffered saline (PBS; Invitrogen, Renfrew, UK) in one of three regimens: (1) at a constant pressure of 8 mm Hg for 2 to 3 hours; (2) at constant pressures of 8, 15, or 4 mm Hg for at least 20 minutes at each pressure level; and (3) at increasing pressures of 8, 15, 22, 30, 35, 40, or 45 mm Hg, then back to 15 mm Hg. In regimen 3, the eye was perfused for at least 10 minutes at each pressure level. Note that in perfusions performed on enucleated eyes, episcleral venous pressure should be added to the perfusion pressure to obtain the corresponding in vivo pressure (e.g., 8-mm Hg perfusion pressure is approximately equivalent to 13–18 mm Hg in vivo (Millar JC, et al. IOVS 2008;49:ARVO E-Abstract 354).3,6 Flow and pressure were measured at 10 Hz and electronically recorded every 10 seconds. Total outflow facility (Ctotal) was calculated as Ctotal = total inflow rate (F)/intraocular pressure (IOP), where we assume that at equilibrium, the total inflow rate equals the total outflow rate.
Washout Rate
For each facility trace at 8 mm Hg, a starting facility (C0) was determined as the first stable total facility reading after cannulation. A linear regression analysis was performed on the facility trace to determine the slope (m). Washout rate was defined as m divided by C0 (i.e., the percentage change in total facility per hour). To exclude the possibility of slow particulate obstruction of the outflow pathways, in some experiments we prefiltered the perfusion medium through a 0.45-μm and then a 0.22-μm syringe filter (Sartorius Stedim Biotech, Göttingen, Germany), just before perfusion.
Characterization of the Perfusion System
For us to have full confidence in the perfusion results, it was necessary to characterize several physical perimeters of the perfusion system. The first of these was the resistance of the perfusion needle. Needle resistance was measured by pumping PBS solution through the cannulation needle at flow rates of 0.1, 0.2, and 0.4 μL/min, with the needle tip submerged in PBS solution, and recording the corresponding pressures. Needle resistance was the slope of the resulting pressure–flow rate graph.
Another important parameter was the compliance of the perfusion system (i.e., the capacity of the system to store fluid as the pressure changes). This was measured by directly pumping small known volumes of PBS into the system with the outflow needle blocked and recording the resulting pressure changes. The system compliance was the slope of a volume versus pressure plot.
Ocular Compliance
We also measured the compliance of mouse eyes, as follows. A series of injections (1 μL of PBS each) was delivered into mouse eyes while IOP was monitored and sampled at a rate of once every second. Compliance was calculated as the volume of the injected bolus divided by the instantaneous increase in IOP due to the injection. The compliance measured in this way is the sum of the ocular compliance plus system compliance, and thus ocular compliance was computed as total compliance minus the system compliance, measured as described above.
Histology
Selected eyes were fixed at constant pressure by infusion of 4% paraformaldehyde, stored in paraformaldehyde, and then processed for paraffin embedding, sectioning, and hematoxylin and eosin staining.
Results
Characterization of the Perfusion System and Ocular Compliance
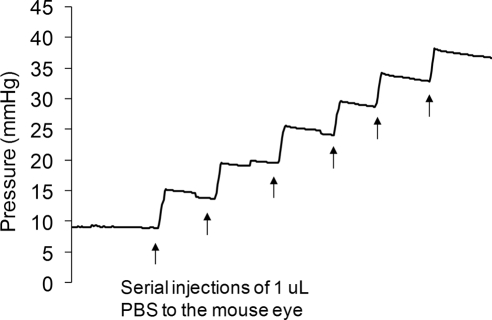
Needle resistance was measured both before and after the perfusion of mouse eyes, giving a value of 0.78 ± 0.05 mm Hg min/μL (all values mean ± SD, n = 3). This resistance was negligible compared with the outflow resistance of a mouse eye and could therefore be ignored during interpretation of the perfusion results. The compliance of the perfusion system was measured to be 0.100 ± 0.004 μL/mm Hg. The ocular compliance was measured to be 0.086 ± 0.017 μL/mm Hg (n = 5 eyes, Fig. 1). Note that the ocular compliance was comparable to the overall system compliance.
Figure 1.
IOP profile resulting from injection of 1 μL PBS boluses into a single mouse eye. The pressure jump arising from each injection can be seen, followed by a slow pressure decrease as fluid drains from the eye. Total compliance is calculated as the injected volume (1 μL), divided by the resulting pressure change (5–6 mm Hg). Note that the compliance measured in this manner includes the compliance of both the eye and of the perfusion system.
Mouse Eye Perfusions
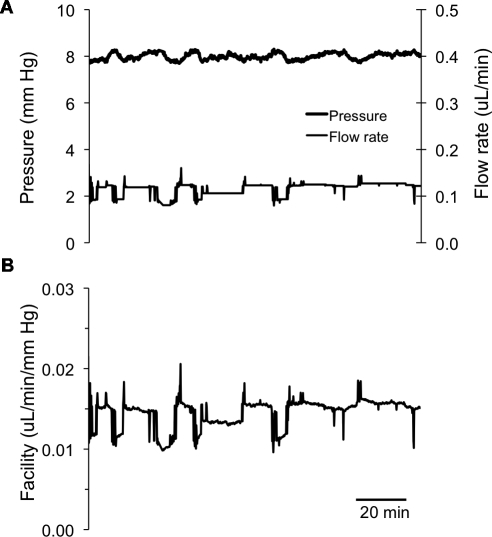
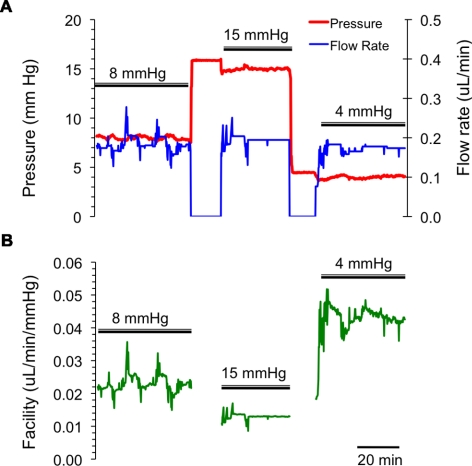
At 8 mm Hg (regimen 1), the eyes had a stable baseline outflow facility of Ctotal = 0.022 ± 0.005 μL/min/mm Hg (mean ± SD, n = 21; Fig. 2). At other perfusion pressures, total outflow facilities were 0.034 ± 0.006 μL/mm Hg/min at 4 mm Hg (n = 8) and 0.014 ± 0.004 μL/mm Hg/min at 15 mm Hg (n = 13). Although we did not look at a wide range of mouse ages, we did not see any clear relationship between total outflow facility and mouse age. Figure 3 is an example of the results from a perfusion experiment at three different pressure levels (regimen 2).
Figure 2.
A typical example of a mouse eye perfusion at a nominal constant target pressure of 8 mm Hg for 2 to 3 hours. (A) The measured flow rates and pressures; (B) the corresponding total outflow facility trace. The perfusion flow rate was automatically adjusted to maintain a constant target pressure of 8 mm Hg. Small deviations away from the 8 mm Hg target pressure can be observed, but these are expected to be physiologically insignificant.
Figure 3.
A typical example of a mouse eye perfusion at constant pressures of 8, 15, and 4 mm Hg for 20 to 30 minutes at each pressure level. (A) The measured flow rates (blue) and pressures (red); (B) the corresponding outflow facility trace (green). Intervals where double bars are absent indicate periods (∼5 minutes) when the syringe pump was switched off and the eye was pressurized by an elevated reservoir so as to rapidly stabilize the IOP at its new value. During these intervals, facility was not computed.
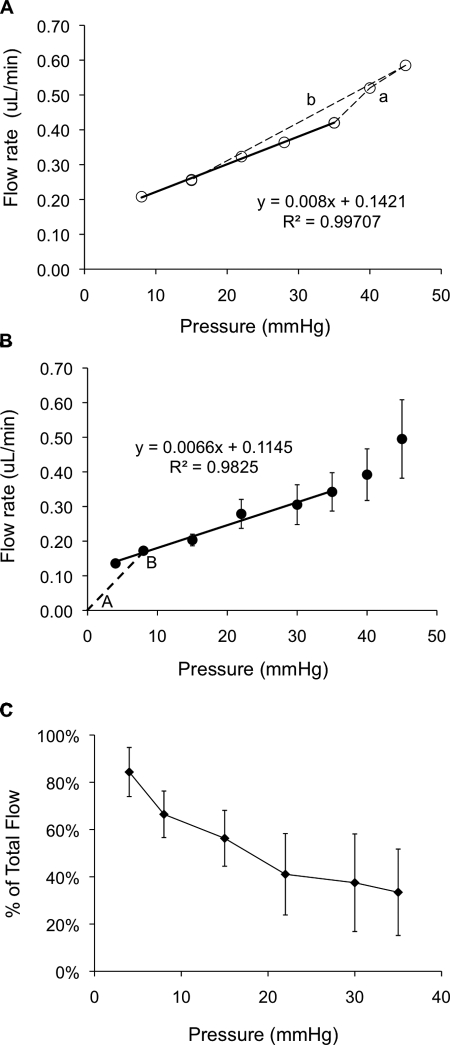
A typical flow–pressure curve for a single mouse eye is shown in Figure 4A, demonstrating a linear relationship between pressure and flow up to 35 mm Hg, similar to that observed in human eyes by Brubaker.7 At pressures greater than 35 mm Hg, flow rate increased more rapidly as pressure was increased, implying an increasing total facility at higher pressures, the opposite of the situation in human eyes.7 It is also noteworthy that when IOP was returned to 15 mm Hg at the end of the experiment, the measured flow rate agreed almost perfectly with that measured earlier in the perfusion at 15 mm Hg, demonstrating that the IOP elevation during the perfusion did not damage or otherwise irreversibly alter the outflow pathway tissues.
Figure 4.
(A) Relation between the flow rate and IOP in a single mouse eye perfusion. The mouse eye was perfused at pressures of 8, 15, 22, 28, 35, 40, 45 mm Hg, and then back to 15 mm Hg. The flow rate–pressure relationship was approximately linear up to 35 mm Hg, after which it curved upward (dashed line a). However, the flow rate reduces to the initial level when the pressure was again lowered to 15 mm Hg (dashed line b). The regression equation is the fit to the points connected by the solid line. (B) Relation between the mean flow rate and IOP averaged over all perfused eyes. The slope of the regression line (solid line) is the conventional outflow facility (Cconv) which is 0.0066 ± 0.0009 μL/min/mm Hg. The slope of AB (dashed line) is the total outflow facility (Ctotal) at 8 mm Hg pressure. The intercept of the regression line is the unconventional flow rate (Fu), which is 0.114 μL/min. Numbers of replicates: n = 8 (4 mm Hg), 21 (8 mm Hg), 13 (15 mm Hg), 4 (22 mm Hg), 3 (30 mm Hg), 4 (35 mm Hg), 4 (40 mm Hg), and 3 (45 mm Hg). (C) Percentage of unconventional outflow at different pressures in the enucleated mouse eyes. The percentage of unconventional outflow is highest at low IOP (e.g., 84% at 4 mm Hg). Each point represents the mean value at one pressure; error bars are one SE of the means.
When data from all mice were combined, a similar flow–pressure response was observed (Fig. 4B). The slope of the regression line in Figure 4B is the conventional (pressure-dependent) outflow facility (Cconv) which was 0.0066 ± 0.0009 μL/min/mm Hg which would be the same as measured by two-level perfusion. This result is significantly different from the total outflow facility (at 8 mm Hg) which is the slope of the line A–B in Figure 4B and is equal to Ctotal = 0.022 ± 0.005 μL/min/mm Hg. The intercept of the regression line is the unconventional (pressure-independent) flow rate, Fu = 0.114 ± 0.019 μL/min. From the data in Figure 4B, it is possible to compute the percentage of outflow that is pressure independent (Fu/F). It can be observed (Fig. 4C) that this percentage is maximum at low pressures and then declines at higher pressures. At 8 mm Hg (corresponding to approximately ∼15 mm Hg in vivo), 66% of outflow is pressure independent. These values are comparable to published data.3
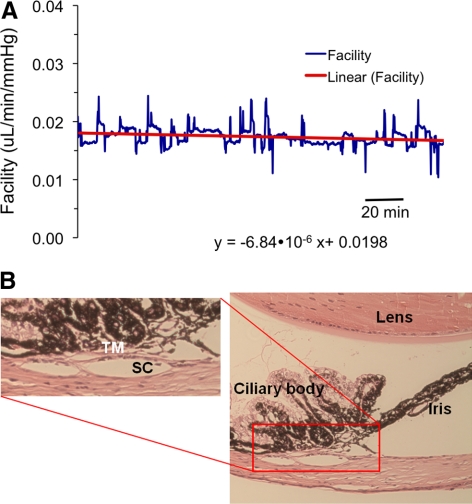
Over a 2- to 3-hour perfusion at 8 mm Hg, the rate of facility change was 2.4% ± 5.4% of starting facility per hour (n = 11, Fig. 5A), not significantly different from 0, implying that (similar to human eyes8) there was no detectable washout in the mouse eye. These results did not depend on whether the perfusate was prefiltered. Histologic examination showed that, after extended perfusions, there were no evident morphologic changes in the aqueous outflow tissues (Fig. 5B).
Figure 5.
(A) There is little change in the total outflow facility in the mouse eye during 2 to 3 hours of constant pressure perfusion at 8 mm Hg. (B) After the experiment, the mouse eye was wax embedded, sectioned (5-μm sections), and stained with hematoxylin and eosin. The aqueous humor outflow tissues were intact and there was no separation between the trabecular meshwork/juxtacanalicular tissue and the inner wall of Schlemm's canal. The histology is representative of four eyes examined that had been perfused for a long duration.
During examination of the histologic cross sections of the mouse eye (typically 20 sections per eye in approximately 10 eyes), we consistently observed a Schlemm's canal-like lumen adjacent to the trabecular meshwork. It is notable that we did not observe sections that lacked a lumen, suggesting a structure more consistent with a continuous Schlemm's canal, as opposed to a discontinuous angular aqueous plexus.
Discussion
In this work, we characterize fundamental physiologic parameters describing aqueous humor drainage in the mouse eye. Interestingly, we found the mouse eyes to be similar to human eyes, in that they had no detectable washout rate and a linear pressure-flow relationship over a broad range of IOPs. Together with previous evidence that mouse eyes display similarities to human eyes in trabecular meshwork and Schlemm's canal morphology and in their protein expression profile,9 the absence of washout as shown here further confirms that the mouse is a useful model for studying the physiology of the inner wall of Schlemm's canal and the conventional outflow tissues.
Mouse Eye Facility at Spontaneous IOP
At IOP lower than 35 mm Hg, we measured the pressure-dependent (conventional) outflow facility to be Cconv = 0.0066 μL/mm Hg/min and the unconventional outflow rate to be Fu = 0.114 μL/min. These values are similar to published data obtained in vivo (Millar JC, et al. IOVS 2008;49:ARVO E-Abstract 354),2–4,10 (e.g., conventional outflow facilities in the range of 0.005 to 0.0146 μL/min/mm Hg and Fu in the range of 0.113 to 0.148 μL/min have been reported). This result suggests that the use of enucleated (postmortem) eyes did not appreciably alter aqueous drainage behavior.
One difference between our studies and previous work is that our perfusions were performed at room temperature, rather than body temperature. VanBuskirk and Grant11 considered the effect of temperature on aqueous outflow in perfused human eyes and concluded that, so long as changes in the viscosity of the perfusion fluid with temperature were accounted for, outflow facility was approximately constant between 22°C and 37°C. If we assume that a similar conclusion holds for the mouse eye, then we can estimate the facility at 37°C from our data. The correction factor is the ratio of PBS viscosities between room temperature (on average, ∼22°C) and body temperature, namely 1.38,12 giving a conventional outflow facility of Cconv = 0.0091 μL/mm Hg/min and an unconventional outflow rate of Fu = 0.157 μL/min. These values are consistent with previous measurements.
In interpreting our results, we found it useful to return to the Goldmann equation13:
where F is total outflow rate, Fu is the pressure-independent (unconventional) outflow rate, EVP is episcleral venous pressure, and Cconv is the conventional outflow facility. When perfusing enucleated eyes, we and others have frequently computed “the facility,” defined as the ratio of flow, F, to IOP, which we have referred to as the total facility, Ctotal, in this work. Equation 1 shows that when unconventional outflow, Fu, is negligible and EVP is 0 (as is the case in an enucleated eye), then Cconv and Ctotal are the same. However, this is clearly not the case for the mouse eye, where Fu is non-negligible so that Cconv ≠ Ctotal, even for an enucleated eye. This conclusion is expressed graphically in Figure 4B, where Cconv and Fu are the slope and intercept of the regression line (solid line) respectively, and Ctotal is the slope of the dashed line AB.
The absence of EVP in enucleated mouse eyes is different from the situation in vivo; however, our analysis of the flow–pressure data accounts for this difference and allows us to extrapolate our findings to the in vivo situation. Specifically, in an enucleated eye, the pressure difference (IOP − EVP) driving pressure-dependent aqueous drainage is simply IOP, and we can thus interpret the horizontal axis of Figure 4B as IOP − EVP. The slope and intercept of this figure must therefore be Cconv and Fu, respectively, as expressed in equation 1. The fact that our derived values were similar to those determined in the living eye by two-level perfusion indicates that pressure-independent outflow must not have been grossly affected by the eye being enucleated, where EVP is 0 and blood flow to the eye is absent.
Our data showed that at high pressures (above 35 mm Hg), the flow rose sharply with pressure (Fig. 4) (i.e., total and conventional outflow facility both increased at high IOP). This finding is opposite to the situation in human eyes, where facility decreases at high IOP. We thought initially that this behavior in the mouse eye may have been due to high IOP damaging outflow structures, but the reversibility of the effect when IOP was lowered and the normal gross histology of the outflow tract in high-pressure perfused eyes do not support this. This is an interesting observation that requires further study.
Washout
An important finding of this study was that there is no detectable washout in the mouse eye. All other species studied to date, except for human, show a time-dependent facility increase (washout) that has been thought to correlate with inner wall separation from the juxtacanalicular tissue (JCT) and modulation of flow resistance by the funneling effect.5 For example, bovine and monkey eyes both show washout rates of approximately 20% per hour during first 2 hours of perfusion with buffered saline solutions.14–17 In the mouse eye, over the course of a 2- to 3-hour perfusion at a constant pressure of 8 mm Hg, we observed less than a 3% facility increase. This finding may be due in part to the high unconventional outflow in the mouse eye, which would suggest that only a fraction of the infused perfusion fluid exits the eye through the trabecular meshwork, thus reducing the effects on the meshwork and inner wall. Alternatively, it may be that mouse eyes do wash out, but at a rate that is so small to be undetectable with present capabilities, or simply that the mouse eye does not wash out.
Mouse Eye Perfusion Techniques
Because of the small fluid volumes and flow rates required, the mouse eye presents many technical challenges during facility measurement. We therefore took specific steps to optimize the performance of the perfusion system, including the use of a modified syringe pump (with a custom machined lead screw) to accurately deliver small infusion rates; the use of a cannulation needle with a resistance that was negligible compared with that of a mouse eye; and stiff tubing to reduce system compliance so that the system compliance was comparable to the ocular compliance. This latter point is important: our original experiments were performed in a system with tubing similar to that used in perfusion systems for human eyes. The resulting system compliance was very large compared with that of the mouse eye, and gave erroneous results due to the long times needed to reach equilibrium. This effect can be particularly marked in multilevel perfusions in which specified flow rates are infused into the eye, and the resulting IOP is measured, as opposed to the situation in which specified IOPs are imposed and the resulting inflow rate is measured.
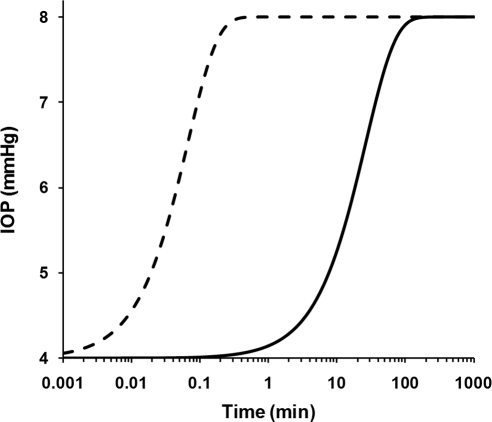
To estimate the time needed to reach equilibrium and to achieve stable facility measurements, we mathematically modeled the time-dependent changes in IOP and conventional outflow rate for constant pressure and constant flow rate perfusions. Our analysis (see Appendix) revealed that for perfusions in which IOP was set by an elevated reservoir (constant pressure perfusions), pressure equilibration was achieved within a matter of seconds (Fig. 6, dashed curve), using parameters typical of the mouse eye and our perfusion system. In contrast, using the same parameters, perfusions in which IOP was set by infusing a known flow rate into the eye (constant flow rate perfusions) required nearly 1 hour to achieve stable equilibrium (Fig. 6, solid curve). The time difference between these two cases is attributable to the system and eye compliances, and the time needed to fill these compartments to the steady state pressure. This analysis predicts that constant flow rate perfusion of the mouse eye is susceptible to considerable error in facility estimation, unless careful attention is paid to ensure that the perfusion reaches steady state.
Figure 6.
Predicted pressure response of a mouse eye when IOP is changed from 4 to 8 mm Hg for constant pressure (dashed curve; solution to equation 8) and constant flow rate (solid curve; solution to equation 11) perfusions. The time required to reach steady state is on the order of seconds for constant pressure perfusion, but nearly an hour for constant flow rate perfusion (note the logarithmic axis). Results would be similar for both enucleated and in vivo eyes. The parameter values used to produce these curves are: βe = 0.086 μL/mm Hg, βt = 0.100 μL/mm Hg, Re = 141 mm Hg/μL/min, Rn = 0.77 mm Hg/μL/min, and Fu = 0.099 μL/min. The initial pressure at t = 0 was set to 4 mm Hg with a final pressure of 8 mm Hg, such that Pn = 8 mm Hg in equation 8 for the constant pressure perfusion case. For the constant flow rate perfusion, the pump flow rate (F0) was chosen to give the same final steady state value of Pe as obtained in the constant pressure case (F0 = Pe/Re + Fu), with the initial condition that dPe/dt = 0 at t = 0.
Limitations of the Present Method
This work is subject to several limitations, the major one being the use of enucleated (ex vivo) eyes. Perfusion of enucleated eyes is well established in many other species, and in fresh human eyes has been shown to yield facility values similar to those measured in vivo by tonography.8 We therefore expect that this approach will be valid in mouse eyes as well, so long as the eyes are freshly obtained and not damaged during enucleation. Another limitation was that we could not completely avoid anterior chamber deepening. However, in some eyes, the needle tip contacted the iris and even created an iridotomy allowing communication between the posterior and anterior chambers. In such eyes, we did not observe any effect on facility. This apparent lack of an effect of anterior chamber deepening on facility in mice may be due to the relatively large lens in the mouse eye, which supports the iris and likely prevents significant posterior iris displacement compared with eyes of other species.
In summary, we believe that the mouse has significant potential for future studies of the physiology and pharmacology of aqueous humor drainage, so long as careful attention is paid to the challenges of ocular perfusion in such tiny eyes. The low cost and ability to undertake genetic manipulations in the mouse are already well recognized. In addition, our studies indicate that the mouse has a true Schlemm's canal, or at least has a collecting duct that is more similar to Schlemm's canal than do common nonprimate animal models. This conclusion suggests that the mouse has significant potential for further studies of the inner wall of Schlemm's canal and its role in ocular hypertension. Further, the apparent absence of washout is very interesting and should be further investigated. It suggests that the mouse is a superior model for studying, for example, the relationship between the trabecular meshwork and inner wall of Schlemm's canal.
A recent perfusion study18 reported that unconventional outflow represents 20.5% of total outflow in BALB/cJ mice. This is 3-fold smaller than the 66% unconventional outflow in C57BL/6 mice reported here and smaller than the ∼80% unconventional outflow reported by other groups.3,4,10 The nature of these differences is uncertain, but may reflect strain-dependent differences in uveoscleral outflow or scleral permeability or methodological differences associated with enucleation (e.g., removal of extraocular tissues, evaporation of medium from the ocular surface, or elimination of EVP). Because of the importance of uveoscleral outflow and its potentially large role in the mouse eye, these differences in unconventional outflow between strains warrant further investigation.
Appendix
We present the mathematical basis for estimating the time to reach steady state for constant pressure and constant flow rate perfusion. Consider an enucleated eye that is cannulated with a rigid needle. Let the pressure and volume of the contents of the eye be represented as Pe (with respect to atmosphere) and Ve, respectively. Because the eye is filled with an incompressible fluid, conservation of mass requires that
 |
where t is time and Fin and Fout are the inflow and outflow rates for the eye, respectively. Because the eye is enucleated, there is no aqueous humor production and Fin is provided entirely by flow through the needle. Allowing the eye to be modeled as an elastic shell with a constant compliance, βe leads to
where Veo is the volume of the enucleated eye at 0 IOP. When the EVP is 0, as is the case in an enucleated eye, the Goldmann equation can be written as
 |
where Fu is pressure-independent (unconventional) outflow and Re is the conventional (pressure-dependent) outflow resistance, both of which are assumed to be constant. Note that Re = 1/Cconv, as defined in Figure 4B.
Combining equations 2, 3, and 4 yields a first-order differential equation describing the time-dependent IOP in terms of ocular parameters and Fin:
 |
The behavior of Fin, however, depends on whether the perfusion is configured to be constant pressure or constant flow rate. Importantly, because of system compliance, Fin is not trivially determined, even in the case of constant flow rate perfusion. Next, we describe the formulation for Fin for the constant pressure and constant flow rate perfusion cases.
Constant-Pressure Perfusion
Constant-pressure perfusion can be performed by cannulating the eye with a needle connected to a constant-height perfusion reservoir or by using more sophisticated pressure control systems (e.g., syringe pumps with feedback5). Because each control system has its own intrinsic response time, we consider here the optimal case of a constant-height perfusion reservoir.
Upstream of the eye, the perfusion system consists of a rigid cannulation needle with resistance Rn and tubing with compliance βt connected to the reservoir. We assume that the resistance of the tubing is negligible compared to the needle, such that the filling time of the tubing is very short and that Pn, the pressure upstream of the needle, is a constant determined by the height of the reservoir. The pressure drop across the needle is therefore Pn − Pe, and the flow rate through the needle is equal to Fin:
 |
Combining equations 5 and 6 yields the governing equation describing the time response of Pe for constant-pressure perfusion,
 |
Because Re ≫ Rn, equation 7 can be approximated as
 |
where it is apparent that the characteristic time constant for Pe to reach steady state is equal to Rnβe. Equation 8 was solved numerically for relevant parameter values (NDSolve function in Mathematica; Wolfram, Champaign, IL) to produce the dashed curve in Figure 6.
Constant Flow Rate Perfusion
Consider a flow source (e.g., syringe pump) that delivers a constant flow rate Fo to the upstream end of the compliant tubing. If the resistance of the tubing is much lower than the needle resistance, then the pressure is approximately uniform throughout the tubing, with a value equal to Pn. However, in this case, Pn is no longer a constant, but is dictated by the tubing compliance βt according to
where Vt is the volume of the tubing and Vto is the tubing volume at Pn = 0. Because the contents of the tubing are incompressible, we may write
 |
where Fin is the flow rate into the eye through the needle as described by equation 6. Combining equations 5, 6, 9, and 10 yields:
 |
The numerical solution of equation 11, using parameters relevant for the mouse eye and our perfusion system is shown by the solid curve in Figure 6.
Footnotes
Supported by a Royal Society Wolfson Foundation Research Excellence Award (CRE), National Institutes of Health Grants R01 EY17007 (WDS, CRE) and EY019696 (DRO, WDS, CRE), American Health Assistance Foundation (DRO), and Research to Prevent Blindness (WDS).
Disclosure: Y. Lei, None; D.R. Overby, None; A. Boussommier-Calleja, None; W.D. Stamer, None; C.R. Ethier, None
References
- 1. Remtulla S, Hallett PE. A schematic eye for the mouse, and comparisons with the rat. Vision Res. 1985;25:21–31 [DOI] [PubMed] [Google Scholar]
- 2. Zhang D, Vetrivel L, Verkman AS. Aquaporin deletion in mice reduces intraocular pressure and aqueous fluid production. J Gen Physiol. 2002;119:561–569 [DOI] [PMC free article] [PubMed] [Google Scholar]
- 3. Aihara M, Lindsey JD, Weinreb RN. Aqueous humor dynamics in mice. Invest Ophthalmol Vis Sci. 2003;44:5168–5173 [DOI] [PubMed] [Google Scholar]
- 4. Zhang Y, Davidson BR, Stamer WD, Barton JK, Marmorstein LY, Marmorstein AD. Enhanced inflow and outflow rates despite lower IOP in bestrophin-2-deficient mice. Invest Ophthalmol Vis Sci. 2009;50:765–770 [DOI] [PMC free article] [PubMed] [Google Scholar]
- 5. Overby D, Gong H, Qiu G, Freddo TF, Johnson M. The mechanism of increasing outflow facility during washout in the bovine eye. Invest Ophthalmol Vis Sci. 2002;43:3455–3464 [PubMed] [Google Scholar]
- 6. Aihara M, Lindsey JD, Weinreb RN. Episcleral venous pressure of mouse eye and effect of body position. Curr Eye Res. 2003;27:355–362 [DOI] [PubMed] [Google Scholar]
- 7. Brubaker RF. The effect of intraocular pressure on conventional outflow resistance in the enucleated human eye. Invest Ophthalmol. 1975;14:286–292 [PubMed] [Google Scholar]
- 8. Erickson-Lamy K, Rohen JW, Grant WM. Outflow facility studies in the perfused human ocular anterior segment. Exp Eye Res. 1991;52:723–731 [DOI] [PubMed] [Google Scholar]
- 9. Tamm ER, Russell P, Piatigorsky J. Development of characterization of a immortal and differentiated murine trabecular meshwork cell line. Invest Ophthalmol Vis Sci. 1999;40:1392–1403 [PubMed] [Google Scholar]
- 10. Crowston JG, Aihara M, Lindsey JD, Weinreb RN. Effect of latanoprost on outflow facility in the mouse. Invest Ophthalmol Vis Sci. 2004;45:2240–2245 [DOI] [PubMed] [Google Scholar]
- 11. VanBuskirk EM, Grant WM. Influence of temperature and the question of involvement of cellular metabolism in aqueous outflow. Am J Ophthalmol. 1974;77:565–572 [DOI] [PubMed] [Google Scholar]
- 12. Weast R. CRC Handbook of Chemistry and Physics. 57th ed. Boca Raaton, FL: CRC Press; 1976 [Google Scholar]
- 13. Bill A. Some thoughts on the pressure dependence of uveoscleral flow. J Glaucoma. 2003;12:88–89, author reply 93–84 [DOI] [PubMed] [Google Scholar]
- 14. Johnson M, Chen A, Epstein DL, Kamm RD. The pressure and volume dependence of the rate of wash-out in the bovine eye. Curr Eye Res. 1991;10:373–375 [DOI] [PubMed] [Google Scholar]
- 15. Sit AJ, Gong H, Ritter N, Freddo TF, Kamm R, Johnson M. The role of soluble proteins in generating aqueous outflow resistance in the bovine and human eye. Exp Eye Res. 1997;64:813–821 [DOI] [PubMed] [Google Scholar]
- 16. Erickson-Lamy K, Schroeder AM, Bassett-Chu S, Epstein DL. Absence of time-dependent facility increase (“washout”) in the perfused enucleated human eye. Invest Ophthalmol Vis Sci. 1990;31:2384–2388 [PubMed] [Google Scholar]
- 17. Scott PA, Overby DR, Freddo TF, Gong H. Comparative studies between species that do and do not exhibit the washout effect. Exp Eye Res. 2007;84:435–443 [DOI] [PMC free article] [PubMed] [Google Scholar]
- 18. Millar JC, Clark AF, Pang IH. Assessment of aqueous humor dynamics in the mouse by a novel method of constant-flow infusion. Invest Ophthalmol Vis Sci. Published online September 22, 2010. doi:10.1167/iovs.10–6069 [DOI] [PubMed] [Google Scholar]


