The authors evaluated the influence of disease severity and optic disc size on the diagnostic accuracies of different scanning protocols of RTVue SDOCT for glaucoma and found a significant influence of disease severity on all the scanning protocols.
Abstract
Purpose.
To evaluate the effect of disease severity and optic disc size on the diagnostic accuracies of optic nerve head (ONH), retinal nerve fiber layer (RNFL), and macular parameters with RTVue (Optovue, Fremont, CA) spectral domain optical coherence tomography (SDOCT) in glaucoma.
Methods.
110 eyes of 62 normal subjects and 193 eyes of 136 glaucoma patients from the Diagnostic Innovations in Glaucoma Study underwent ONH, RNFL, and macular imaging with RTVue. Severity of glaucoma was based on visual field index (VFI) values from standard automated perimetry. Optic disc size was based on disc area measurement using the Heidelberg Retina Tomograph II (Heidelberg Engineering, Dossenheim, Germany). Influence of disease severity and disc size on the diagnostic accuracy of RTVue was evaluated by receiver operating characteristic (ROC) and logistic regression models.
Results.
Areas under ROC curve (AUC) of all scanning areas increased (P < 0.05) as disease severity increased. For a VFI value of 99%, indicating early damage, AUCs for rim area, average RNFL thickness, and ganglion cell complex–root mean square were 0.693, 0.799, and 0.779, respectively. For a VFI of 70%, indicating severe damage, corresponding AUCs were 0.828, 0.985, and 0.992, respectively. Optic disc size did not influence the AUCs of any of the SDOCT scanning protocols of RTVue (P > 0.05). Sensitivity of the rim area increased and specificity decreased in large optic discs.
Conclusions.
Diagnostic accuracies of RTVue scanning protocols for glaucoma were significantly influenced by disease severity. Sensitivity of the rim area increased in large optic discs at the expense of specificity.
Many diagnostic tests are available to assist clinicians in detecting signs of structural damage in glaucoma. Understanding the influence of covariates, such as disease severity, on the performance of these tests is of fundamental importance to evaluate their applicability under different clinical scenarios. For example, ancillary tests are usually used to assist in detecting early disease in clinical practice. The performance of the test in this situation is likely to differ from that expected when the test is used for screening of cases with more advanced disease.
Previous studies have shown that imaging devices generally perform better for detection of structural glaucomatous damage in eyes with more severe disease.1–8 Disease severity may also affect differently the performance of various parameters. For example, it is possible that a particular parameter may be more sensitive in early stages of the disease, whereas another may be more sensitive in moderate or advanced stages. Optic disc size is another variable that also seems to affect the diagnostic performance of imaging devices in glaucoma. However, the effect of optic disc size is dependent on the method of imaging used.1–8
Spectral domain optical coherence tomography (SDOCT), a new tool for glaucoma imaging, enables scanning the optic nerve head (ONH), retinal nerve fiber layer (RNFL), and macula with higher resolution and faster scan rate than previous versions of this technology.9,10 RTVue (Optovue, Fremont, CA) is an SDOCT device that has a scan rate of 26,000 A scans per second with an axial resolution of 5 μm. Although a few studies have evaluated the diagnostic accuracy of SDOCT for glaucoma detection,11,12 to our knowledge, the effect of disease severity and optic disc size on the diagnostic accuracy of the RTVue has not yet been reported.
The aim of this study was to evaluate the effect of disease severity and optic disc size on the diagnostic accuracies of different examination protocols of RTVue SDOCT in glaucoma.
Methods
This was an observational, cross-sectional study enrolling participants included in a prospective, longitudinal study (Diagnostic Innovations in Glaucoma Study [DIGS]), designed to evaluate optic nerve structure and visual function in glaucoma conducted at the Hamilton Glaucoma Center, University of California, San Diego. Participants in DIGS include normal subjects, patients with glaucoma, and subjects with suspected glaucoma, who are longitudinally evaluated clinically and with several functional and imaging tests. Informed consent was obtained from each participant, and the University of California San Diego Human Subjects Committee approved all methodology. All methods adhered to the tenets of the Declaration of Helsinki for research involving human subjects.
All the participants underwent a comprehensive ophthalmic examination including review of medical history, visual acuity testing, slit-lamp biomicroscopy, intraocular pressure (IOP) measurement using Goldmann applanation tonometry, gonioscopy, dilated fundoscopic examination using a 78 D lens, stereoscopic optic disc photography, and automated perimetry (24-2 Swedish Interactive Threshold Algorithm; Carl Zeiss Meditec, Dublin, CA).
Inclusion criteria were a best corrected visual acuity of 20/40 or better, spherical refraction within ± 5.0 D, and cylinder correction within ± 3.0 D and open angles on gonioscopy. Eyes with coexisting retinal disease, uveitis, or nonglaucomatous optic neuropathy were excluded.
Eyes were classified as glaucomatous if they had repeatable (at least two consecutive) abnormal visual field test results, defined as a pattern SD (PSD) outside the 95% confidence limits and/or a glaucoma hemifield test (GHT) result outside normal limits, regardless of the appearance of the optic disc. Normal subjects were recruited from the general population through advertisement, as well as from the staff and employees of the University of California San Diego. Normal control eyes had normal findings on clinical examination, including IOP of 21 mm Hg or less with no history of increased IOP and a normal visual field result. A normal visual field was defined as a mean deviation (MD) and PSD within the 95% confidence limits, and a GHT result within normal limits. Visual fields were reviewed by the Visual Field Assessment CenTer (VisFACT) visual field reading center to identify the presence of artifacts such as lid and rim artifacts, fatigue effects, inattention, or inappropriate fixation. A reliable visual field had to have <33% of false negatives, false positives, and loss of fixation. Visual fields were also reviewed for the presence of abnormalities that could indicate diseases other than glaucoma, such as homonymous hemianopia. Inclusion was based on eyes, and when both eyes of participants satisfied the inclusion criteria, both were included. Appropriate statistical methods were used to adjust for the correlation of measurements from both eyes of the same individual (see below).
Instrumentation
SDOCT examination was performed with the RTVue (software version 4.0.5.39). RTVue uses a scanning laser diode with a wavelength of 840 ± 10 nm to provide images of ocular microstructures. The protocols used for imaging with RTVue in this study were ONH (previously known as nerve head map) and GCC (ganglion cell complex). All patients had both protocols performed on the same day. The examination protocols and the parameters obtained with RTVue have been described previously.13
The ONH protocol consists of 12 radial scans 3.4 mm in length (452 A scans each) and 6 concentric ring scans ranging from 2.5 to 4.0 mm in diameter (587 to 775 A scans each), all centered on the optic disc. All the images were reprocessed with three-dimensional/video baseline. ONH parameters measured by the software included optic disc area, optic cup area, neuroretinal rim area, nerve head volume, cup volume, rim volume, cup-disc area ratio, horizontal cup-disc ratio, and vertical cup-disc ratio. The ONH protocol also generates a polar RNFL thickness map, measured along a circle 3.45 mm in diameter centered on the optic disc. It gives the average RNFL thickness in the temporal, superior, nasal, and inferior quadrants as well as the overall average along the entire measurement circle.
The GCC protocol was used to obtain macular measurements. This protocol consists of one horizontal line scan 7 mm in length (467 A scans) followed by 15 vertical line scans 7 mm in length (each 400 A scans) and at a 0.5 mm interval centered 1 mm temporal to the fovea. The parameters generated by the GCC analysis are the average inner retinal thickness, superior inner retinal thickness, inferior inner retinal thickness, average superior minus inferior inner retinal thickness, and superior minus inferior inner retinal thickness SD. In addition to these, the GCC protocol also provides three other parameters called GLV (global loss volume), FLV (focal loss volume), and RMS (root mean square). GLV measures the average amount of GCC loss over the entire GCC map. It is calculated from the fractional deviation map, which is the map showing the percentage of GCC thickness decrease at each pixel location compared with the expected or normal value at each pixel determined by the instrument's built-in normative database. FLV measures the average amount of focal loss over the entire GCC map. FLV detects focal loss using a pattern deviation map to correct for the overall absolute changes, much like the corrected pattern SD in the visual fields. For calculation of FLV, a pattern map, which is a normalized map calculated by dividing the GCC thickness values at each location by the average GCC thickness value from the entire map (for an individual), is estimated. The difference between this pattern map for an individual and the average pattern map of the normative database gives the pattern deviation map. RMS or the pattern coefficient of variation provides a summary of how well the fractional and pattern deviation maps of an individual fit the normal pattern. The worse the fit, the higher the value.
For the present study, we reported the influence of disease severity and optic disc size on the diagnostic accuracies of neuroretinal rim area, average RNFL thickness, and macula parameter RMS. These parameters were chosen because they represent global measures of structural damage and had the best overall diagnostic performance in a recent study comparing the different parameters of the instrument.13
Only good quality images, as defined by a signal strength index of ≥30, were used for analysis. Only images acquired within one year of visual field testing were included for the analysis.
The severity of visual field damage was assessed using the visual field index (VFI). Details of the calculation of the VFI have been described elsewhere.14 In brief, the VFI represents the percentage of normal age-corrected visual function, and it is intended for use in calculating rates of progression and staging glaucomatous functional damage. Evaluation of rates of functional loss in glaucoma eyes with the VFI has been suggested to be less susceptible than the mean deviation to the effects of cataract or diffuse media opacities.14 The VFI can range from 100% (normal visual field) to 0% (perimetrically blind field).
Optic disc areas of all the participants were obtained using the Heidelberg Retina Tomograph II (HRT; Heidelberg Engineering, Dossenheim, Germany).15 The method of disc area measurement with the HRT has been described previously.16 Three scans centered on the optic disc were automatically obtained for each study eye, and a mean topography was created. Magnification errors were corrected by using patients' corneal curvature measurements. The optic disc margin was outlined on the mean topography image by trained technicians while viewing simultaneous stereoscopic photographs of the optic disc. All images included in the analysis were reviewed for adequate centration, focus, and illumination; all mean topography images had a SD of <50 μm. The scans were obtained with HRT software version 1.5.9.0 or earlier but were analyzed with the software version 3.0.
Statistical Analysis
Descriptive statistics included mean and SD for normally distributed variables and median, first quartile, and third quartile values for non-normally distributed variables (determined using the Shapiro-Wilk normality test). The receiver operating characteristic (ROC) regression modeling technique was used to evaluate and compare the influence of disease severity and optic disc size on the diagnostic accuracies of the ONH, RNFL, and macular parameters with RTVue in glaucoma. This modeling approach was described by Medeiros et al.17 for evaluation of the influence of covariates on the performance of diagnostic tests in glaucoma. This methodology allows the evaluation of the influence of covariates on the diagnostic performance of the test, so that ROC curves for specific values of the covariate of interest can be obtained. Also, it allows adjustment for the possible confounding effects of other covariates.
Details of the modeling procedure have been described previously.18–22 In brief, the ROCX, XD (q) is the probability that a diseased individual with disease-specific covariates XD (that is, covariates specific to diseased subjects, such as disease severity) and common covariates X (covariates common to both diseased and healthy subjects, such as optic disc size) has test results YD that are greater than or equal to the qth quantile of the distribution of test results from nondiseased individuals. That is, when the specificity of the test is 1 − q, the sensitivity is ROCX, XD (q). The general ROC regression model can be written as
where the coefficients α1 and α2 are the intercept and slope of the ROC curve, respectively, and Φ is the normal cumulative distribution function (cdf) and Φ−1(q) is the inverse normal cdf of the false positive rate. If the coefficient for a specific variable X (say, β) is greater than zero, then the discrimination between diseased and nondiseased subjects increases with increasing values of this covariate. Similarly, if the coefficient for the disease-specific covariate XD (say, βD) is greater than zero, then diseased subjects with larger values of this covariate are more distinct from nondiseased subjects than are diseased subjects with smaller values of XD. In the present study, the following ROC regression model was fitted to assess the influence of the disease severity and optic disc size on the diagnostic performance of the ONH, RNFL, and macular parameters of the RTVue:
where severity is a continuous variable as determined by the VFI, and disc size is a continuous variable as determined by the HRT disc area. An interaction term between disc size and severity was included to assess whether the effect of disease severity was similar or different across different disc sizes. The effects of age, race, and optic disc area on the RTVue parameters are still unknown but have been reported with other imaging instruments.1–8,23–26 Therefore, to avoid any potential bias due to group selection, all ROC analyses were adjusted for differences between glaucoma and control eyes for these variables. The model adjusts for the differences in variables between normal and glaucoma groups by fitting a linear regression of the marker distribution on the adjustment variables among controls. Standardized residuals based on this fitted linear model are used in place of the marker values for cases and controls.
Parameters were estimated using probit regression. To obtain confidence intervals (CIs) for regression parameters and areas under ROC curve (AUCs), a bootstrap resampling procedure was used (n = 1000 resamples).27 Because measurements from both eyes of the same subject are likely to be correlated, the standard statistical methods for parameter estimation lead to underestimation of standard errors.28 Therefore, the cluster of data for the study subject was considered as the unit of resampling when calculating standard errors.21,27 To evaluate the goodness of fit of the model, glaucomatous eyes were categorized into 3 groups (tertiles) based on VFI, and empiric AUCs of ONH, RNFL, and macular parameters in each of the three groups were compared with the AUCs derived from the model.
The effect of covariates was also evaluated on the sensitivities and specificities of ONH, RNFL and macular measurements using logistic marginal regression models.6,29 Statistical analyses were performed using commercial software (Stata ver. 10.0; StataCorp, College Station, TX).
Results
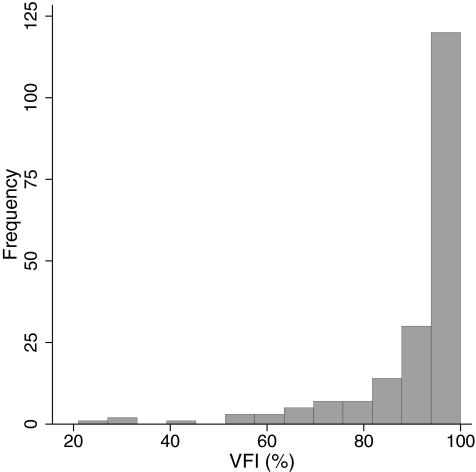
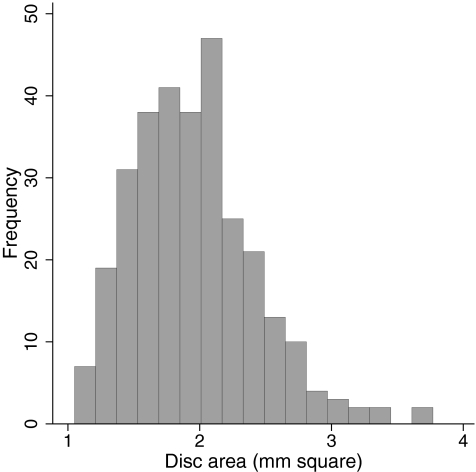
The study included 110 eyes of 62 normal subjects and 193 eyes of 136 glaucoma patients. Age, race distribution, and visual field parameters of the two groups of participants are shown in Table 1. Patients in the glaucoma group were significantly older than the subjects in the normal group. In addition, there were more African descent participants in the glaucoma group. Optic disc area was greater in the glaucoma group compared with the normal subject group. The distribution of the disease severity based on VFI in the glaucomatous eyes is shown in Figure 1. The distribution of optic disc size in the entire cohort is shown in Figure 2.
Table 1.
Demographic and Clinical Features of the Study Participants
| Normal Group (110 Eyes of 62 Subjects) | Glaucoma Group (193 Eyes of 136 Patients) | P | |
|---|---|---|---|
| Age, y* | 56.2 ± 16.2 | 69.6 ± 11.2 | <0.001 |
| Race (African descent) | 6 eyes of 4 subjects (6.5%) | 72 eyes of 45 patients (33.1%) | <0.001 |
| MD, dB† | 0.35 (−0.17, 0.86) | −2.52 (−4.68, −1.34) | <0.001 |
| PSD, dB† | 1.47 (1.27, 1.64) | 2.84 (2.12, 5.71) | <0.001 |
| VFI, %† | 100 (99, 100) | 95 (89, 98) | <0.001 |
| Disc area, mm2† | 1.71 (1.51, 1.95) | 2.06 (1.73, 2.34) | <0.001 |
Values in bold indicate the coefficients that are statistically significant.
Mean ± standard deviation.
Median (first and third quartile values).
Figure 1.
Distribution of disease severity, as assessed by the VFI in the glaucoma group.
Figure 2.
Distribution of optic disc size, as assessed by HRT disc area, in the entire cohort.
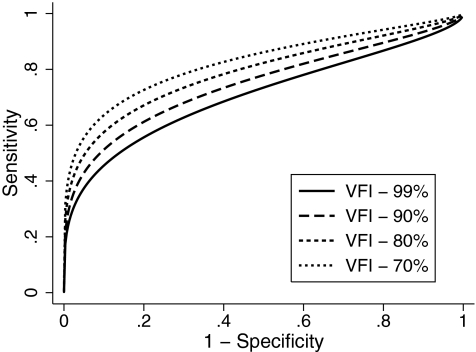
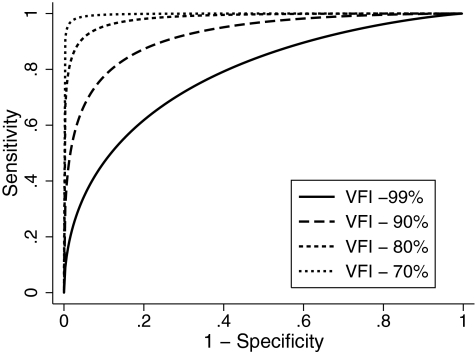
Table 2 shows the estimates of the coefficients of the ROC regression model for the ONH rim area. The results indicated that the diagnostic performance of rim area increased as the VFI decreased (i.e., disease severity increased) as evidenced by the statistically significant negative coefficient associated with disease severity (−0.02; P = 0.05). The nonsignificant coefficient associated with disc size (0.24; P = 0.50) indicated that disc size did not influence the diagnostic accuracy of rim area. The coefficient associated with the interaction term between severity and disc size was also nonsignificant, indicating that the effect of disease severity was similar across different disc sizes. The AUCs (with 95% CI) calculated at arbitrary VFI values of 99%, 90%, 80%, and 70% according to the ROC regression model were 0.693 (0.688–0.698), 0.741 (0.737–0.745), 0.788 (0.784–0.791), and 0.828 (0.825–0.832), respectively (Fig. 3). Sensitivities at 95% specificity at corresponding values of VFI were 36.5% (35.8–37.1), 42.5% (41.9–43.1), 49.5% (48.9–50.1), and 56.4% (55.7–57.1), respectively.
Table 2.
Results of the ROC Regression Model for Optic Nerve Head Rim Area Incorporating Disease Severity and Disc Size as Covariates
| Parameter | Coefficient | Estimate | 95% CI | P |
|---|---|---|---|---|
| Intercept | α1 | 0.69 | 0.20 to 1.13 | 0.005 |
| Φ−1 (q) | α2 | 0.58 | 0.40 to 0.75 | <0.001 |
| Severity | β1 | −0.02 | −0.04 to −0.0003 | 0.05 |
| Disc size | β2 | 0.24 | −0.38 to 0.89 | 0.50 |
| Severity × disc size | β3 | −0.01 | −0.06 to 0.04 | 0.65 |
Values in bold indicate the coefficients that are statistically significant.
Figure 3.
Receiver operating characteristic curves for optic nerve head rim area for arbitrary values of VFI according to the regression model.
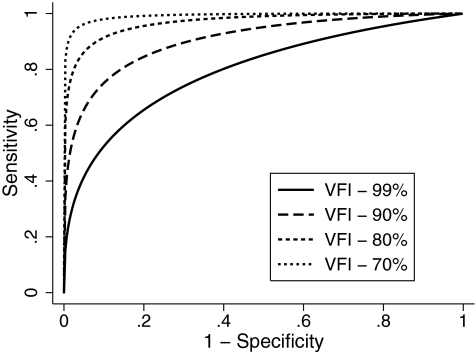
Table 3 shows the estimates of the coefficients of the ROC regression model for the average RNFL thickness parameter. The results indicated that the diagnostic performance of average RNFL thickness increased as the VFI decreased as evidenced by the statistically significant negative coefficient associated with disease severity (−0.07; P = 0.01). The nonsignificant coefficient associated with disc size indicated that disc size did not influence the diagnostic accuracy of this parameter (0.24; P = 0.46). The AUCs calculated at arbitrary VFI values of 99%, 90%, 80%, and 70% according to the ROC regression model were 0.799 (0.796–0.802), 0.904 (0.902–0.907), 0.961 (0.960–0.963), and 0.985 (0.984–0.986), respectively (Fig. 4). Sensitivities at 95% specificity at corresponding values of VFI were 42.4% (41.9–43.0), 65.6% (65.0–66.2), 84.0% (83.4–84.5), and 93.2% (92.8–93.6), respectively.
Table 3.
Results of the Receiver Operating Characteristic Regression Model for Average Retinal Nerve Fiber Layer Thickness Incorporating Disease Severity and Disc Size as Covariates
| Parameter | Coefficient | Estimate | 95% CI | P |
|---|---|---|---|---|
| Intercept | α1 | 1.38 | 0.93 to 1.10 | <0.001 |
| Φ−1 (q) | α2 | 0.77 | 0.51 to 1.13 | <0.001 |
| Severity | β3 | −0.07 | −0.15 to −0.04 | 0.01 |
| Disc size | β1 | 0.24 | −0.29 to 0.92 | 0.46 |
| Severity × disc size | β3 | 0.01 | −0.05 to 0.16 | 0.78 |
Values in bold indicate the coefficients that are statistically significant.
Figure 4.
Receiver operating characteristic curves for average retinal nerve fiber layer thickness for arbitrary values of VFI according to the regression model.
Similarly Table 4 shows the estimates of the coefficients of the ROC regression model for the macular parameter GCC RMS. The results of the model showed a significant influence of disease severity on the diagnostic accuracy of GCC RMS as indicated by the coefficient associated with severity (−0.10; P = 0.002). Disc size did not influence the diagnostic performance of this parameter. The AUCs at arbitrary VFI values of 99%, 90%, 80%, and 70% according to the ROC regression model were 0.779 (0.776–0.783), 0.914 (0.912–0.916), 0.974 (0.972–0.975), and 0.992 (0.991–0.993), respectively (Fig. 5). Sensitivities at 95% specificity at corresponding values of VFI were 36.0% (35.4–36.5), 66.3% (65.6–66.9), 88.0% (87.5–88.5), and 96.3% (96.0–96.6), respectively.
Table 4.
Results of the Receiver Operating Characteristic Regression Model for GCC RMS Incorporating Disease Severity and Disc Size as Covariates
| Parameter | Coefficient | Estimate | 95% CI | P |
|---|---|---|---|---|
| Intercept | α1 | 1.55 | 1.15 to 2.17 | <0.001 |
| Φ−1 (q) | α2 | 0.88 | 0.67 to 1.22 | <0.001 |
| Severity | β3 | −0.10 | −0.21 to −0.06 | 0.002 |
| Disc size | β1 | 0.12 | −0.43 to 0.67 | 0.66 |
| Severity × disc size | β3 | −0.08 | −0.20 to 0.001 | 0.11 |
Values in bold indicate the coefficients that are statistically significant.
Figure 5.
Receiver operating characteristic curves for ganglion cell complex: RMS for arbitrary values of VFI according to the regression model.
The ROC models fitted the data well. AUCs derived from the models were found to be within ± 0.02 of the empiric AUCs in the 3 groups categorized based on VFI tertiles.
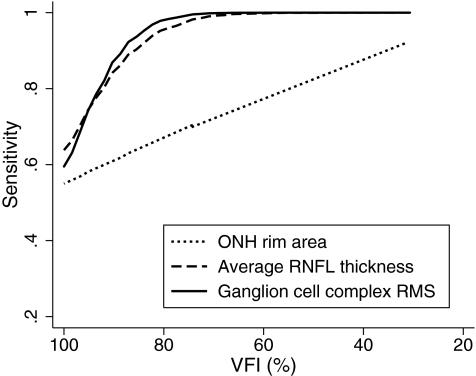
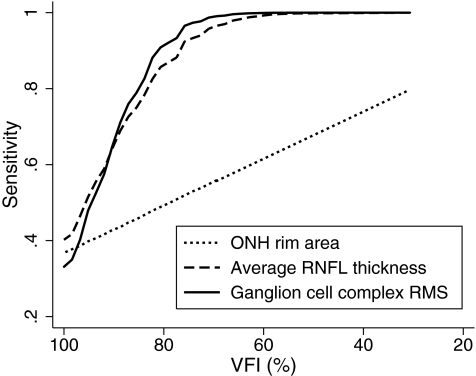
Figures 6 and 7 show the sensitivities at fixed specificities of 80% and 95% for the ONH rim area, average RNFL thickness, and GCC RMS throughout the range of disease severity calculated based on the regression model. GCC RMS had sensitivities similar to average RNFL thickness in detecting glaucoma across different severities of the disease, which were superior to those of the ONH rim area.
Figure 6.
Sensitivities at a fixed specificity of 80% for ONH rim area, average RNFL thickness, and ganglion cell complex RMS according to the severity of disease.
Figure 7.
Sensitivities at a fixed specificity of 95% for ONH rim area, average RNFL thickness, and ganglion cell complex RMS according to the severity of disease.
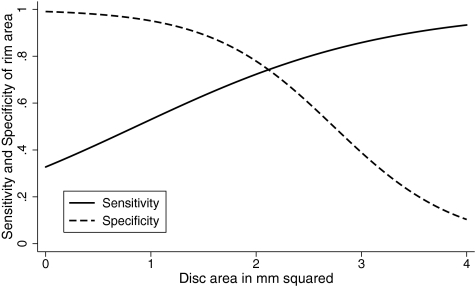
The logistic marginal regression models evaluating the effect of covariates on sensitivities and specificities showed that disease severity influenced the sensitivities of all the above parameters to diagnose glaucoma (P < 0.05 for all analysis). Sensitivity of ONH rim area increased (β=0.92, P = 0.01) and specificity of ONH rim area decreased (β = −1.65, P = 0.03) as the optic disc size increased (Fig. 8). Disc size did not influence the sensitivity (β = −0.42, P = 0.28) and specificity (β = −0.04, P = 0.95) of average RNFL thickness. Disc size also did not influence the sensitivity (β = −0.48, P = 0.17) and specificity (β=1.23, P = 0.17) of GCC RMS.
Figure 8.
Sensitivities and specificities of ONH rim area from logistic regression model according to optic disc size after fixing the disease severity at the median severity (VFI 95%) of the glaucoma group.
Discussion
In this study, we demonstrated that the diagnostic accuracies of the different scanning areas of the RTVue were significantly influenced at variable degrees by disease severity. As expected, we found that the accuracy of the RTVue was significantly better for detection of glaucomatous eyes with more severe disease. For the ONH rim area, average RNFL thickness, and GCC RMS, the AUCs were 0.693, 0.799, and 0.779, respectively, for detecting eyes with early visual field loss as indicated by a VFI of 99%. However, the AUCs improved to 0.828, 0.98,5 and 0.992, respectively, for detection of disease in patients with more severe visual field loss, as indicated by a VFI of 70%. These results are in agreement with previous studies evaluating the influence of disease severity on the accuracy of other imaging technologies for structural evaluation in glaucoma.8,30
Some of the previous studies have graded disease severity using categorical scales such as the one proposed by Hodapp-Anderson-Parrish.31 However, categorization of what is actually a continuous measure, such as disease severity, potentially reduces the power to detect associations. Other studies have also used global indexes such as MD and AGIS scores.32 Although these indices provide valid methods for continuously classifying severity, they are likely to be more affected by the presence of media opacities compared with the VFI used in our study. When we ran the ROC regression models using disease severity based on MD, we found similar results compared with VFI, which is likely explained by the fact that we excluded individuals with severe media opacities. The coefficients associated with severity (based on MD) were −0.04 (P = 0.05), −0.19 (P < 0.001), and −0.18 (P < 0.001) for rim area, average RNFL thickness, and GCC RMS, respectively. The AUCs calculated at arbitrary MD values of −1, −6, and −10 dB were 0.710, 0.764, and 0.803 for rim area, 0.802, 0.942, and 0.984 for average RNFL thickness, and 0.805, 0.935, and 0.980 for GCC RMS, respectively. It is important to note that although disease severity significantly influenced the diagnostic accuracy of the structural parameters, the amount of variance in the structural measurements explained by visual field severity was not large. The coefficient of determination (R2) for the relationship between VFI and ONH rim area was 11%, for VFI and average RNFL thickness was 24%, and for VFI and RMS was 26%. These results are in agreement with previous studies on structure-function relationship and suggest that other factors are also responsible for the variability in structural measurements obtained by the RTVue and differences in diagnostic accuracy.
When the diagnostic accuracies of ONH, RNFL and macular parameters were compared at different levels of disease severities, we found that the macular and RNFL parameters performed better than the ONH rim area. This agrees with the results by Medeiros et al.,33 who found that RNFL thickness assessment with scanning laser polarimetry performed significantly better than optic disc topographic evaluation with confocal scanning laser ophthalmoscopy to detect early signs of disease in glaucoma suspects. This could reflect a superior performance of RNFL analysis in detecting structural damage in glaucoma. Alternatively, it could reflect a weaker performance of the RTVue software for topographic assessment of the ONH compared with its macular and RNFL thickness evaluation algorithms. Whatever the reasons might be, it indicates that the macular and RNFL evaluation by the RTVue is likely to provide more information to assist clinicians in detecting glaucomatous damage than the ONH topographic analysis of this instrument.
We also found that macular measurements were as good as RNFL measurements to detect glaucoma except perhaps in very early stages of the disease. This represents a significant improvement in performance of macular thickness analysis with SDOCT compared with an earlier version of this technology, the Stratus OCT.34,35 Such improvement could be related to the acquisition of a larger number of data points in the macular region with SDOCT compared to time-domain OCT, resulting in a decreased requirement for data interpolation and more accurate structural representation of the macular zone. Alternatively, it could be related to the improvement in software analysis of macular thickness data, which now concentrates on the inner retinal layers instead of all the retinal layers at the macula. Such improvement has been made possible by the higher resolution of SDOCT compared with time-domain OCT, enabling better identification of the different retinal layers.
We were not able to find a significant influence of disc size on the AUCs of any of the scanning areas of RTVue. We based the disc size on the HRT disc area. Though RTVue also provides a measure of disc area, the validity of these measurements has not been reported. Moreover, using the disc area from the same instrument, the other parameters of which are being evaluated, might introduce bias. The logistic marginal regression models showed that the sensitivity of RTVue ONH rim area increased and specificity decreased in large discs. Previous studies evaluating the effect of optic disc size on the diagnostic performance of HRT topographic measurements have found similar results.1–7 However, the analysis of the ROC model for the RTVue ONH parameter rim area makes it clear that the improvement in sensitivity occurred at the expense of decreased specificity and, therefore, did not result in change to the area under the ROC curve; that is, there was no improvement in the overall diagnostic accuracy of this parameter for larger discs. Another limitation of most of the previous studies is the lack of adjustment for the severity of disease when comparing the effect of disc size on the diagnostic accuracy of imaging tests. It is possible that subgroups of patients divided on the basis of optic disc size would present different stages of disease severity, introducing a confounding factor into the comparison. ROC and logistic marginal regression models are advantageous because they allow simultaneous evaluation of the effect of multiple covariates, such as disease severity and optic disc size.
Our study has limitations. All our glaucoma patients had evidence of visual field loss. However, in clinical practice, a diagnostic test is used to diagnose disease in those suspected of having disease, and not in patients with confirmed abnormalities. Diagnostic studies with such a case-control design have been shown to substantially overestimate the performance of the test.36,37 Therefore, caution should be exercised when interpreting estimates provided in our study. Longitudinal studies should evaluate the ability of RTVue in detecting glaucomatous damage in eyes suspected of having the disease. Another limitation of our study was the different sample characteristics of the two groups studied with respect to age, race, and optic disc size. Although we used statistical methods to adjust for these differences, it is possible that the statistical methodology may not have fully accounted for the differences between the two groups.
In conclusion, we found that the diagnostic accuracies of the RTVue scanning protocols for glaucoma were significantly influenced by disease severity. Though optic disc size did not influence the AUCs of any of the scanning protocols of RTVue, sensitivity of the ONH rim area to diagnose glaucoma increased in large optic discs, albeit at the expense of specificity. These covariates should be considered while comparing and evaluating the results of SDOCT for glaucoma detection. We also observed that macular measurements were as sensitive as the RNFL measurements to detect glaucoma.
Footnotes
Supported in part by CAPES Ministry of Education, Brazil, Grant Nos. BEX1327/09–7 (MTL), NEI EY08208 (PAS), and NEI EY11008 (LMZ), and participant retention incentive grants in the form of glaucoma medication at no cost (Alcon Laboratories Inc., Allergan, Pfizer Inc., and SANTEN Inc.).
Disclosure: H.L. Rao, None; M.T. Leite, None; R.N. Weinreb, Optovue (F, C), Topcon (F, C), Heidelberg Engineering (F, C, R), Carl Zeiss (C, F, R); L.M. Zangwill, Heidelberg Engineering (F), Carl Zeiss (F), Optovue (F); L.M. Alencar, None; P.A. Sample, Carl Zeiss (F), Heidelberg Engineering (F), Welch Allyn (F); F.A. Medeiros, Carl Zeiss (F, R), Heidelberg Engineering (R)
References
- 1. Iester M, Mikelberg FS, Drance SM. The effect of optic disc size on diagnostic precision with the Heidelberg retina tomograph. Ophthalmology. 1997;104:545–548 [DOI] [PubMed] [Google Scholar]
- 2. Bathija R, Zangwill L, Berry CC, Sample PA, Weinreb RN. Detection of early glaucomatous structural damage with confocal scanning laser tomography. J Glaucoma. 1998;7:121–127 [PubMed] [Google Scholar]
- 3. Mardin CY, Horn FK. Influence of optic disc size on the sensitivity of the Heidelberg Retina Tomograph. Graefes Arch Clin Exp Ophthalmol. 1998;236:641–645 [DOI] [PubMed] [Google Scholar]
- 4. Wollstein G, Garway-Heath DF, Hitchings RA. Identification of early glaucoma cases with the scanning laser ophthalmoscope. Ophthalmology. 1998;105:1557–1563 [DOI] [PubMed] [Google Scholar]
- 5. Ford BA, Artes PH, McCormick TA, Nicolela MT, LeBlanc RP, Chauhan BC. Comparison of data analysis tools for detection of glaucoma with the Heidelberg Retina Tomograph. Ophthalmology. 2003;110:1145–1150 [DOI] [PubMed] [Google Scholar]
- 6. Medeiros FA, Zangwill LM, Bowd C, Sample PA, Weinreb RN. Influence of disease severity and optic disc size on the diagnostic performance of imaging instruments in glaucoma. Invest Ophthalmol Vis Sci. 2006;47:1008–1015 [DOI] [PubMed] [Google Scholar]
- 7. Zangwill LM, Jain S, Racette L, et al. The effect of disc size and severity of disease on the diagnostic accuracy of the Heidelberg Retina Tomograph Glaucoma Probability Score. Invest Ophthalmol Vis Sci. 2007;48:2653–2660 [DOI] [PubMed] [Google Scholar]
- 8. Hoesl LM, Mardin CY, Horn FK, Juenemann AG, Laemmer R. Influence of glaucomatous damage and optic disc size on glaucoma detection by scanning laser tomography. J Glaucoma. 2009;18:385–389 [DOI] [PubMed] [Google Scholar]
- 9. Nassif N, Cense B, Park B, et al. In vivo high-resolution video-rate spectral-domain optical coherence tomography of the human retina and optic nerve. Opt Express. 2004;12:367–376 [DOI] [PubMed] [Google Scholar]
- 10. Wojtkowski M, Srinivasan V, Ko T, Fujimoto J, Kowalczyk A, Duker J. Ultrahigh-resolution, high-speed, Fourier domain optical coherence tomography and methods for dispersion compensation. Opt Express. 2004;12:2404–2422 [DOI] [PubMed] [Google Scholar]
- 11. Leung CK, Cheung CY, Weinreb RN, et al. Retinal nerve fiber layer imaging with spectral-domain optical coherence tomography: a variability and diagnostic performance study. Ophthalmology. 2009;116:1257–1263 [DOI] [PubMed] [Google Scholar]
- 12. Sehi M, Grewal DS, Sheets CW, Greenfield DS. Diagnostic ability of Fourier-domain vs time-domain optical coherence tomography for glaucoma detection. Am J Ophthalmol. 2009;148:597–605 [DOI] [PMC free article] [PubMed] [Google Scholar]
- 13. Rao HL, Zangwill LM, Weinreb RN, et al. Comparison of different spectral domain optical coherence tomography scanning areas for glaucoma diagnosis. Ophthalmology. 2010;117:1692–1699.e1 [DOI] [PubMed] [Google Scholar]
- 14. Bengtsson B, Heijl A. A visual field index for calculation of glaucoma rate of progression. Am J Ophthalmol. 2008;145:343–353 [DOI] [PubMed] [Google Scholar]
- 15. Zangwill LM, Medeiros FA, Bowd C, Weinreb RN. Optic nerve imaging devices: recent advances. In: Grehn F, Stampher R. eds. Essentials in Ophthalmology: Glaucoma. Heidelberg, Germany: Springer-Verlag; 2004:63–91 [Google Scholar]
- 16. Zangwill LM, Weinreb RN, Berry CC, et al. The confocal scanning laser ophthalmoscopy ancillary study to the ocular hypertension treatment study: study design and baseline factors. Am J Ophthalmol. 2004;137:219–227 [DOI] [PubMed] [Google Scholar]
- 17. Medeiros FA, Sample PA, Zangwill LM, Liebmann JM, Girkin CA, Weinreb RN. A statistical approach to the evaluation of covariate effects on the receiver operating characteristic curves of diagnostic tests in glaucoma. Invest Ophthalmol Vis Sci. 2006;47:2520–2527 [DOI] [PubMed] [Google Scholar]
- 18. Pepe MS. A regression modelling framework for receiver operating characteristic curves in medical diagnostic testing. Biometrika. 1997;84:595–608 [Google Scholar]
- 19. Pepe MS. Three approaches to regression analysis of receiver operating characteristic curves for continuous test results. Biometrics. 1998;54:124–135 [PubMed] [Google Scholar]
- 20. Pepe MS. An interpretation for the ROC curve and inference using GLM procedures. Biometrics. 2000;56:352–359 [DOI] [PubMed] [Google Scholar]
- 21. Alonzo TA, Pepe MS. Distribution-free ROC analysis using binary regression techniques. Biostatistics. 2002;3:421–432 [DOI] [PubMed] [Google Scholar]
- 22. Janes H, Pepe MS. Adjusting for covariates in studies of diagnostic, screening, or prognostic markers: an old concept in a new setting. Am J Epidemiol. 2008;168:89–97 [DOI] [PubMed] [Google Scholar]
- 23. Costa VP, Lauande-Pimentel R, Fonseca RA, Magacho L. The influence of age, sex, race, refractive error and optic disc parameters on the sensitivity and specificity of scanning laser polarimetry. Acta Ophthalmol Scand. 2004;82:419–425 [DOI] [PubMed] [Google Scholar]
- 24. Girkin CA, McGwin G, Jr, Long C, DeLeon-Ortega J, Graf CM, Everett AW. Subjective and objective optic nerve assessment in African Americans and whites. Invest Ophthalmol Vis Sci. 2004;45:2272–2278 [DOI] [PubMed] [Google Scholar]
- 25. Zelefsky JR, Harizman N, Mora R, et al. Assessment of a race-specific normative HRT-III database to differentiate glaucomatous from normal eyes. J Glaucoma. 2006;15:548–551 [DOI] [PubMed] [Google Scholar]
- 26. De Leon-Ortega JE, Sakata LM, Monheit BE, McGwin G, Jr, Arthur SN, Girkin CA. Comparison of diagnostic accuracy of Heidelberg Retina Tomograph II and Heidelberg Retina Tomograph 3 to discriminate glaucomatous and nonglaucomatous eyes. Am J Ophthalmol. 2007;144:525–532 [DOI] [PMC free article] [PubMed] [Google Scholar]
- 27. Zhou X-H, Obuchowski NA, McClish DK. Analysis of correlated ROC data. In: Zhou X-H, Obuchowski NA, McClish DK. eds. Statistical Methods in Diagnostic Medicine. New York: John Wiley & Sons; 2002:274–306 [Google Scholar]
- 28. Glynn RJ, Rosner B. Accounting for the correlation between fellow eyes in regression analysis. Arch Ophthalmol. 1992;110:381–387 [DOI] [PubMed] [Google Scholar]
- 29. Coops A, Henson DB, Kwartz AJ, Artes PH. Automated Analysis of Heidelberg Retina Tomograph Optic Disc Images by Glaucoma Probability Score. Invest Ophthalmol Vis Sci. 2006;47:5348–5355 [DOI] [PubMed] [Google Scholar]
- 30. Medeiros FA, Bowd C, Zangwill LM, Patel C, Weinreb RN. Detection of glaucoma using scanning laser polarimetry with enhanced corneal compensation. Invest Ophthalmol Vis Sci. 2007;48:3146–3153 [DOI] [PubMed] [Google Scholar]
- 31. Hodapp E, Parrish RK, Anderson DR. Clinical Decisions in Glaucoma. St. Louis: Mosby; 1993:53 [Google Scholar]
- 32. Advanced Glaucoma Intervention Study. 2 Visual field test scoring and reliability. Ophthalmology. 1994;101:1445–1455 [PubMed] [Google Scholar]
- 33. Medeiros FA, Vizzeri G, Zangwill LM, Alencar LM, Sample PA, Weinreb RN. Comparison of retinal nerve fiber layer and optic disc imaging for diagnosing glaucoma in patients suspected of having the disease. Ophthalmology. 2008;115:1340–1346 [DOI] [PMC free article] [PubMed] [Google Scholar]
- 34. Medeiros FA, Zangwill LM, Bowd C, Vessani RM, Susanna R, Jr, Weinreb RN. Evaluation of retinal nerve fiber layer, optic nerve head, and macular thickness measurements for glaucoma detection using optical coherence tomography. Am J Ophthalmol. 2005;139:44–55 [DOI] [PubMed] [Google Scholar]
- 35. Wollstein G, Ishikawa H, Wang J, Beaton SA, Schuman JS. Comparison of three optical coherence tomography scanning areas for detection of glaucomatous damage. Am J Ophthalmol. 2005;139:39–43 [DOI] [PubMed] [Google Scholar]
- 36. Medeiros FA, Ng D, Zangwill LM, Sample PA, Bowd C, Weinreb RN. The effects of study design and spectrum bias on the evaluation of diagnostic accuracy of confocal scanning laser ophthalmoscopy in glaucoma. Invest Ophthalmol Vis Sci. 2007;48:214–222 [DOI] [PubMed] [Google Scholar]
- 37. Lijmer JG, Mol BW, Heisterkamp S, et al. Empirical evidence of design-related bias in studies of diagnostic tests. JAMA. 1999;282:1061–1066 [DOI] [PubMed] [Google Scholar]


