

Abstract
Objective
To examine the association between the increase in body mass index (BMI) and socioeconomic factors (eg, income level, % below poverty line, unemployment rates and persons receiving food stamps) in Mississippi, Alabama, Louisiana, Tennessee and Colorado.
Design
Data from Behavioral Risk Factor Surveillance System, United States Department of Agriculture and the United States Department of Labor/ Bureau of Labor were obtained and analyzed for the years 1995–2008.
Results
Results from this study showed a strong association between obesity and the tested variables (R2=.767). Factors more closely related with obesity were: income below poverty level; receipt of food stamps; unemployment; and general income level. The coefficient of determination for these variables were 0.438, 0.427. 0.103 and 0.018, respectively. The highest rate of obesity was found in Mississippi (26.5% ± 4.13%) followed by Alabama (25.18% ± 4.41%), while Colorado had the lowest rate of obesity (15.4% ± 2.63%). By ethnicity, African Americans had the highest rate of obesity (32.64 ± 5.99%).
Conclusion
We found a significant effect of consumption of low-quality food, due to economic factors, on increased BMI. Besides physical activity, the quality and the quantity of food are important factors that contribute to obesity rates.
Keywords: Obesity, BMI, Poverty, Unemployment, Food Stamps
Introduction
Obesity is a common manifestation of energy imbalance, which is classically defined as the balance between energy consumed, by food and drink, and energy expended through metabolism and physical activity. Obesity, which is strongly linked to lifestyle behaviors, may be characterized by low levels of physical activity or high consumption of energy-dense diets, or both.1 The body mass index (BMI [kg/m2]) defines people as overweight when BMI is between 25 and 30, and obese when it is greater than 30.2
The United States has witnessed a significant increase in the prevalence of obesity during the past three decades and disparities among population groups have been reported.3 Overweight and obesity are estimated to cause 2.6 million deaths worldwide and 2.3% of the global burden of disease.4 Obesity has been found to be a major risk factor for the development of type 2 diabetes, asthma, hypertension, stroke, coronary artery disease, cancer and cancer-related mortality, liver and gallbladder diseases, sleep apnea, osteoarthritis and gynecological complications.1,2,4-7 The rising obesity rates are the result of a number of trends in the United States: the population, on average, consumes 300 more calories per day and eats less nutritious foods compared to 25 years ago; nutritious foods can be significantly more expensive than calorie-dense, less nutritious foods; the population walks less and drives more even for trips of less than one mile; and, parks and recreation spaces are not considered safe or well maintained in many communities.8,9
Studies have reported significant disparities in the availability of food stores. While African American and Hispanic neighborhoods have had 50% to 70% fewer chain supermarkets than White and non-Hispanic neighborhoods, the availability of supermarkets has been associated with more healthful diets, higher vegetable and fruit consumption, and lower rates of obesity.10 Furthermore, minority population groups have had less access to physical activity facilities, which is associated with decreased physical activity and increased overweight.10 Higher rates of obesity are likely to be found among the lowest income and the least educated groups, particularly among women and certain ethnic groups.10,11 An association between hunger and obesity may be explained by the relatively low cost of energy-dense foods, the high palatability of sweets and fats associated with higher energy intakes, and the association of lower income and food insecurity with lower intakes of fruit and vegetables.12 Studies have found that healthier foods, generally, are more expensive and less readily available in poorer communities.13,14
Body mass index has been found to be higher in some groups of people receiving food stamps benefits.12 Weight differences were especially high for women; 42% of women who participated in the food stamps program were obese. Although food stamps increase the availability of food energy, protein, and some micronutrients such as vitamins and iron, persons receiving food stamps consume more meat, added sugars, and total fats rather than fruits, vegetables, grains, and dairy products.12,13
To maintain a healthy weight, a person’s caloric intake must be balanced with calories used through physical activity. According to the Centers for Disease Control and Prevention’s Guide to Community Preventive Services,2 the evidence-based strategies to increase physical activity levels include: community-wide campaigns; individual behavioral change; social support in community settings; the creation or enhancement of access to places for physical activity; and point-of-decision prompts.
The objective of our study was to examine the relationship between socioeconomic factors and obesity. We examined these factors: income level, % of people below the poverty line, % of people receiving food stamps, unemployment levels, and geographic location in five states: Alabama, Tennessee, Mississippi, Louisiana, and Colorado.
Methods
Demographic data (sex, ethnicity, geographic location) and BMI were obtained from the CDC’s Behavioral Risk Factor Surveillance System15 for 1995–2008. We focused on national data as well as data from Miss., Ala., La., Tenn., and Colo.
The percentage of people receiving food stamps through the Supplement Nutrition Assistance Program (SNAP) was calculated from United States Department of Agriculture data in their annual national- and state-level reports for 1995–2008.13 The population rates of our target states were obtained from the US Census Bureau for 1995–2008.16 Unemployment rates for 1995–2008 were obtained from the US Department of Labor;17 the national and state median household income data and % of people below poverty level were obtained from the US Census Bureau.16
Statistics
Data were analyzed using PROC REG procedure of SAS software (SAS, Inc, v 9.1) with the obesity rate as the dependent variable and income level, unemployment rates, % receiving SNAP and the % below poverty level as independent variables. PROC GLM was used to determine the significant difference in obesity among the states followed by TUKEY standardized test for further classification.
Results
Results of the study are summarized in Table 1. The analysis of variance showed a significant increase in obesity rates over time in all states and in the United States (P<.001). Mississippi had the highest rate of obesity (26.52 ± 4.14%) with a 13.9% increase in obesity rate since 1995 (data not shown); followed by Alabama (25.18± 4.41%), Louisiana (24.56± 3.9%), and Tennessee (23.8 ± 4.24%). All four southern states were significantly different from Colorado, (P<0.0001) which had the lowest rate of obesity (15.4 ± 2.63%). Obesity rates were higher among African Americans in all states with the highest in Mississippi (35.5 ± 5.08%). The mean obesity rate for males in the United States was 21.80 ± 3.82%, which was not significantly different from females (20.83 ± 3.48%).
Table 1.
Summary results. Means and standard deviations from 1995–2008
| Region
| |||||||
|---|---|---|---|---|---|---|---|
| Category | USA Mean ± Std Dev | MS Mean ± Std Dev | AL Mean ± Std Dev | LA Mean ± Std Dev | TN Mean ± Std Dev | South Average Mean ± Std Dev | CO Mean ± Std Dev |
| Obesity Rates | 21.31% ± 3.29 D | 26.52% ± 4.13 A | 25.18% ± 4.41 BB | 24.56% ± 3.99 BC | 23.80% ± 4.24 CC | 25.01% ± 4.19 | 15.4% ± 2.63 E |
| Obesity-African American | 31.45% ± 4.56 E | 35.50% ± 5.08 AA | 34.87% ± 5.52 AB | 31.80% ± 5.56 AB | 32.50% ± 7.06 C | 33.66% ± 5.80 | 24.32% ± 3.27 D |
| Obesity-Whites | 20.25% ± 3.64 B | 22.38% ± 4.41 A | 22.79% ± 4.43 A | 21.75% ± 3.64 A | 22.40% ± 4.38 A | 22.33% ± 4.21 | 16.54% ± 0.88 C |
| Obesity-Males | 21.80% ± 3.82 B | 25.42% ± 4.57 A | 25.08% ± 4.92 A | 24.68% ± 4.75 A | 24.10% ± 5.45 A | 24.82% ± 4.92 | 18.72% ± 1.06 C |
| Obesity-Female | 20.83% ± 3.48 E | 27.55% ± 4.82 A | 25.50% ± 4.62 BB | 24.42% ± 3.57 BC | 23.60% ± 4.15 CC | 25.27% ± 4.29 | 17.72% ± 1.15 D |
| Income level | $43259 ± 5185.4 D | $32165 ± 3179 AA | $35616.9 ± 3985 BB | $34494 ± 4561 AB | $34485 ± 4541 AA | $34190 ± 4069 | $48158 ± 5506 C |
| SNAP Rates | 7.58% ± 2.36 D | 12.74% ± 2.14 BB | 10.54% ± 1.30 CC | 14.35% ± 2.73 A | 11.56% ± 2.30 BC | 12.29% ± 2.11 | 4.76% ± 0.82 E |
| Unemployment Rates | 5.17% ± 0.67 B | 6.50% ± 0.66 A | 4.48% ± 0.77 B | 5.17% ± 0.96 B | 5.23% ± 0.68 B | 5.53% ± 0.76 | 4.68% ± 1.09 B |
| Poverty Rates | 12.63% ± 0.75 D | 19.24% ± 1.40 AA | 13.99% ± 0.84 B | 18.79% ± 1.06 A | 14.13% ± 1.24 C | 16.53% ± 1.13 | 10.05% ± 0.96 E |
Means with the same letter in a row are not significantly different
Poverty rates, percentage of people receiving food stamps through SNAP and unemployment rates also showed a significant difference over time (P<.05) (data not shown). Colorado had the highest income level with an average of $48,158 ±5506, the lowest percent of people below poverty (10.05% ± 9.6), low unemployment rates (4.7 and ±1.09%) and lowest percent of people receiving SNAP (4.76±0.82%), which were significantly different from the four southern states (P<.05). Mississippi had the lowest income level with an average of ($32165±3179), the highest rate of people below poverty (19.24±1.40%), and the highest rate of unemployment (6.50±0.66%); while Louisiana had the highest rate of people receiving SNAP (14.35±2.73%).
Regression analysis was performed to test the association between the obesity rates (BMI>30) as response variable and the percent of people receiving SNAP, unemployment rates, income level, and percent of people living below the poverty level (explanatory variables) within the US and each of the targeted states. The coefficient of determination (R2) was 0.767 when a multiple regression analysis was performed to determine the association between obesity (BMI>30) and all the explanatory variables. Scatter plots illustrate the association between the obesity rate and the percentage of people living below poverty level (Figure 1, R2=.437); between the obesity rate and percentage of people receiving SNAP (Figure 2, R2=.427); between the obesity rate and unemployment rate (Figure 3, R2=.103); and between the obesity rate and income level (Figure 4, R2=.018).
Fig 1.
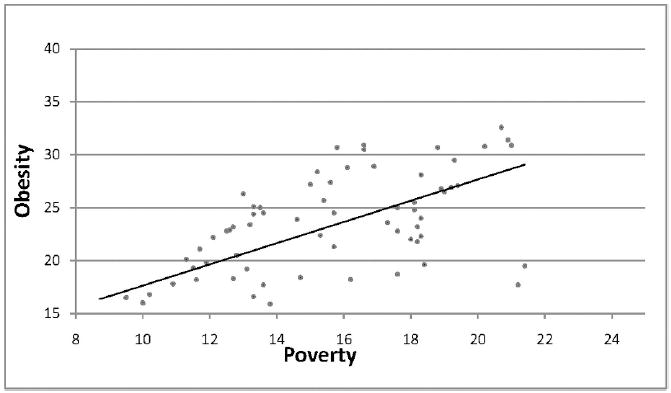
Regression analysis between the obesity rates (BMI >30) and percentage of people below the poverty level for the United States and Miss., Ala., Tenn., La., and Colo. (y = 1.0029x + 7.6152, R2 = 0.438)
Fig 2.
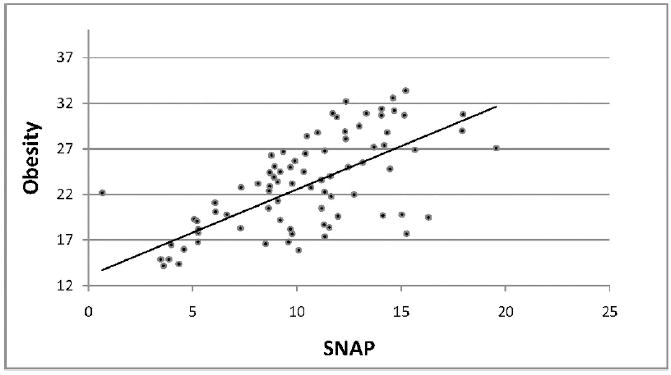
Regression analysis between the increase in obesity rates and the percent of people receiving Supplement Nutritional Assistant Program. (y = 0.948x + 13.103, R2 = 0.427)
Fig 3.
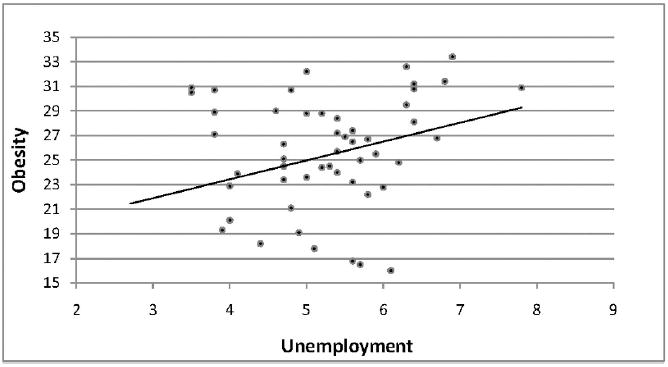
Regression analysis between the increase in obesity rates and the unemployment rates. (y = 1.5353x + 17.299; R2 = 0.103)
Fig 4.
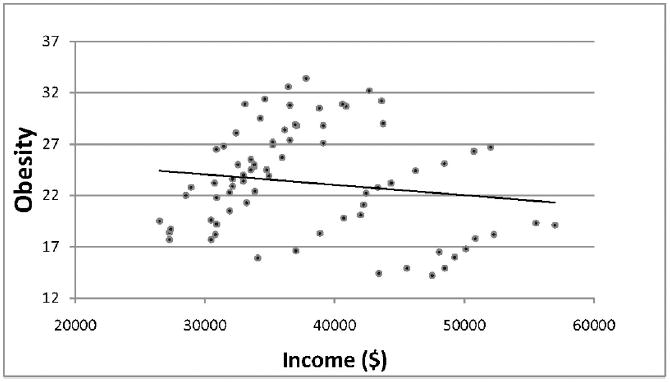
Regression analysis between the increase in obesity rates with the income level. (y = −0.0001x + 27.115; R2 = 0.018)
Discussion
The Centers for Disease Control and Prevention has suggested that obesity could be caused by genetic factors, environmental factors and some diseases or drugs.2 Of the environmental factors, quantity and the quality of the food consumed as well as physical activity are the major factors for controlling obesity. Currently, two thirds of US adults are overweight or obese.3
Results of our study have shown an increased rate of obesity that may be linked to several socioeconomic factors, such as poverty, receipt of SNAP, unemployment and income. The highest obesity rates were found among African Americans compared to Whites. Obesity prevalence was highest in Mississippi, which also had the highest percentage of African Americans (38%). Alabama, Tennessee and Louisiana also had high rates of African Americans while Colorado had the lowest rate (5%). African American populations make up around 13.5% of the United States population. An estimated 19% of African Americans have a bachelor’s degree, yet the poverty rate for Blacks is 24.5%; 19% lack health insurance; and, the annual median income is $33,916 (2007).16 According to US Census data, more than one third of food stamps benefits are issued to African Americans. Food stamps constitute 26% of the total monthly income for a typical African American family that participates in SNAP.13 More than one in five African American households (22.4%) and more than one in four African American families with children (27.4%, nearly three times more than Whites) have difficulty affording adequate food.10 The inability to afford healthy food may be a major contributor to the increase prevalence of obesity. Purchasing higher priced but more healthful food has been shown to lead to better weight and health.10,12 In addition, some low-income African Americans live in rural areas, have a higher risk for poor health, smoke more, exercise less and have less nutritious diets.1,14 Populations with low income may have less access to high quality, nutritious foods (eg, fruits and vegetables), which could result in higher rates of obesity.14
The regression analysis in our study showed a correlation between the increase in obesity prevalence with the increase in unemployment rates, poverty levels and percent of people receiving SNAP benefits. However, income level did not show a high correlation with the obesity rate.
In October 2009, the unemployment rate for Mississippi had reached 9.8%, 10.9% in Alabama, 7.4% in Louisiana, and 10.5% in Tennessee, while it was only 6.9% in Colorado. These rates suggest that more people will have difficulty affording nutritious foods.
Although obesity is caused by many factors, in most people, weight gain results from a combination of excess calorie consumption and inadequate physical activity. To maintain a healthy weight, there must be a balance between energy consumption through dietary intake and energy expenditure. Population-based policies and programs that emphasize environmental changes are most likely to be successful. Strategies to tackle obesity should be incorporated into other existing health promotion programs, particularly those promoting healthful eating and physical activity.
Acknowledgments
This project was supported by Grant Number G12RR013459 from the National Center of Research Resources. The content is solely the responsibility of the authors and does not necessarily represent the official views of the National Center of Research Resources or the National Institutes of Health.
Footnotes
Author Contributions Design concept of study: Akil, Ahmad
Acquisition of data: Akil
Data analysis and interpretation: Akil, Ah-mad
Manuscript draft: Akil, Ahmad
Statistical expertise: Akil, Ahmad
Acquisition of funding: Ahmad
Supervision: Ahmad
References
- 1.Parham GP, Scarinci IC. Strategies for achieving healthy energy balance among African Americans in the Mississippi Delta. Prev Chronic Dis. 2007;4(4):A97. [PMC free article] [PubMed] [Google Scholar]
- 2.Centers for Disease Control and Prevention. [October 3, 2009];Overweight and Obesity. Available at: www.cdc.gov/obesity.
- 3.Wang Y, Beydoun MA. The obesity epidemic in the United States—gender, age, socioeconomic, racial/ethnic, and geographic characteristics: a systematic review and meta-regression analysis. Epidemiol Rev. 2007;29:6–28. doi: 10.1093/epirev/mxm007. [DOI] [PubMed] [Google Scholar]
- 4.Klein S, Allison DB, Heymsfield SB, et al. Waist circumference and cardiometabolic risk: a consensus statement from Shaping America’s Health: Association for Weight Management and Obesity Prevention; NAASO, The Obesity Society; the American Society for Nutrition; and the American Diabetes Association. Am J Clin Nutr. 2007;85:1197–1202. doi: 10.1093/ajcn/85.5.1197. [DOI] [PubMed] [Google Scholar]
- 5.Ezzati M, Martin H, Skjold S, Vander Hoorn S, Murray CJ. Trends in national and state-level obesity in the USA after correction for self-report bias: analysis of health surveys. J R Soc Med. 2006;99:250–257. doi: 10.1258/jrsm.99.5.250. [DOI] [PMC free article] [PubMed] [Google Scholar]
- 6.Beuther DA, Weiss ST, Sutherland ER. Obesity and asthma. Am J Respir Crit Care Med. 2006;174(2):112–119. doi: 10.1164/rccm.200602-231PP. [DOI] [PMC free article] [PubMed] [Google Scholar]
- 7.Balluz LS, Okoro CA, Mokdad A. Association between selected unhealthy lifestyle factors, body mass index, and chronic health condition among individuals 50 years of age or older, by race /ethnicity. Ethn Dis. 2008;18(4):450–457. [PubMed] [Google Scholar]
- 8.The Institute for America’s Health. [November 15, 2009]; Available at: www.healthy-america.org.
- 9.Jeffery RW, French SA. Epidemic obesity in the United States: are fast foods and television viewing contributing? Am J Pub Health. 1998;88(2):277–280. doi: 10.2105/ajph.88.2.277. [DOI] [PMC free article] [PubMed] [Google Scholar]
- 10.Powell LM, Stater S, Mirtcheva D, Bao Y, Chaloupka FJ. Food Store availability and neighborhood characteristics in The United States. Prev Med. 2007;44(3):189–195. doi: 10.1016/j.ypmed.2006.08.008. [DOI] [PubMed] [Google Scholar]
- 11.Cummins S, Macintyre S. Food environments and obesity – neighborhood or nation? Int J Epidemiol. 2006;35(1):100–104. doi: 10.1093/ije/dyi276. [DOI] [PubMed] [Google Scholar]
- 12.Ver Ploeg M, Mancino L, Lin BH. Food stamps and obesity: ironic twist or complex puzzle? Amber Waves. 2006;4(1) [Google Scholar]
- 13.United States Department of Agriculture. [October 10, 2009];Food and Nutrition. Available at: www.usda.gov.
- 14.Darcey V, Quinlan JJ, Dale D. Comparison of the availability of healthy foods in low income and high income neighborhoods in Philadelphia. Ethn Dis. 2009;19(S3):S82–S83. [Google Scholar]
- 15.Centers for Disease Control and Prevention. Behavioral Risk Factor Surveillance Survey. [November 28, 2009]; Available at: www.cdc.gov/brfss.
- 16.United States Census of Bureau. Cen-Stats Database. [November 2, 2009]; Available at: www.censtats.census.gov.
- 17.United State Department of Labor, Bureau of Labor Statistics. [October 15, 2009]; Available at: www.bls.gov.