

SUMMARY
Increasingly complex research has made it more difficult to prepare data for publication, education, and outreach. Many scientists must also wade through black-box code to interface computational algorithms from diverse sources to supplement their bench work. To reduce these barriers, we have developed an open-source plug-in, embedded Python Molecular Viewer (ePMV), that runs molecular modeling software directly inside of professional 3D animation applications (hosts) to provide simultaneous access to the capabilities of these newly connected systems. Uniting host and scientific algorithms into a single interface allows users from varied backgrounds to assemble professional quality visuals and to perform computational experiments with relative ease. By enabling easy exchange of algorithms, ePMV can facilitate interdisciplinary research, smooth communication between broadly diverse specialties and provide a common platform to frame and visualize the increasingly detailed intersection(s) of cellular and molecular biology.
INTRODUCTION
Scientific research is becoming broader in scope and increasingly interdisciplinary, which often leaves researchers faced with a highly complicated story to tell when it comes time to write grants, publish, teach, or prepare slides. Although users can import multiple structure files into most molecular viewers, they cannot directly use those viewers to paint the structures into the context of a cell, as in Goodsell’s books (Goodsell, 2009a), or to animate the story of a cellular event, like the work of Berry (Berry, 2007). Conveying the details of larger structures (Goddard and Ferrin, 2007; Vale, 2003) and complex interactions, or putting a protein into a cellular context (Kühner et al. 2009), often requires an arsenal of methods (Sharpe et al., 2007) that are difficult to use, not designed to interoperate, or currently not available in popular molecular viewers (O’Donoghue et al., 2010).
Traditional scientific illustrators, however, have been creating images and animations of this type and on this scale for generations (Fawcett, 1981; Goodsell, 2005; Pollard and Earnshaw, 2007). To fill the functional gaps in molecular graphics packages, we can look to professional 3D animation packages. Hundreds of software applications with thousands of tools have been developed and refined, through a process of commercial evolution and adoption of computer-science basic research, to solve visualization challenges encountered by scientists, educators, and entertainers over the past few decades. Many niche packages still exist, but the market is dominated by a handful of industry giants who provide all-inclusive applications that can model, texture, light, animate, simulate, or render various real-world entities ranging from jet engines with working components to anatomically/kinesthetically accurate humans.
Many scientists have incorporated professional animation packages into their modeling (Takamori et al., 2006; Wong et al., 2009) and communication (Kirchhausen, 2009) pipelines to access capabilities that their favorite molecular viewer cannot provide. Johnson (an ePMV author), for example, assembled a virtual model of a motor protein dimer, articulated with a restricting inverse kinematic armature, to help keyframe reasonable paths between two known conformers to animate the walking motor protein kinesin (Vale and Milligan, 2000). Iwasa and the Reck-Peterson (Iwasa, 2010) group used more current 3D animation software with advanced physics solvers, to generate sophisticated marionette models of the motor protein dynein. These models now serve as interactive data-constrained thinking tools to help the lab contemplate plausible molecular mechanisms for this complex walking system. Once overcoming the steep learning curves associated with professional animation software, however, these cross-disciplinary scientists join a legion of scientific illustrators and edutainment animators who have been frustrated for years by the toilsome (Goodsell, 2009b) protocols (figure 1) required to import, organize and update structural data, and by the disconnect between the data and the 3D models that these export-import protocols produce. While dozens of translator scripts have become available to ease the export/import process, they translate in only one direction and remain plagued by the disconnection. With protein data, for example, this one-way translation produces 3D mesh models of selected molecular representations at one particular conformation, e.g., a cartoon ribbon backbone surrounded by its molecular surface. Such models have been used for years, as professional 3D software input, to create outputs like high-quality still renderings (Gramling, 2005), hand-keyframed animations (e.g., http://www.sciencemag.org/site/feature/data/1049155.xhtml), and crude physics simulations. Once removed from the molecular viewer and opened in the 3D software, however, these 3D models become geometric mesh shells that are devoid of the underlying chemical data that is needed to allow for easy changes in representation or for more sophisticated simulations. Simultaneously (at the opposite extreme), animators with little biology background or experience with command-line interfaces have struggled to use seemingly arcane molecular viewers to import accurate data into their familiar software environments; as a fallback, they often construct models from scratch, based loosely on previous pop-culture or soft-science references, thus unfortunately perpetuating misconceptions and outright errors to the broadest world audiences (Goodsell and Johnson, 2006).
Figure 1. Recent shifts in molecular graphics protocols.
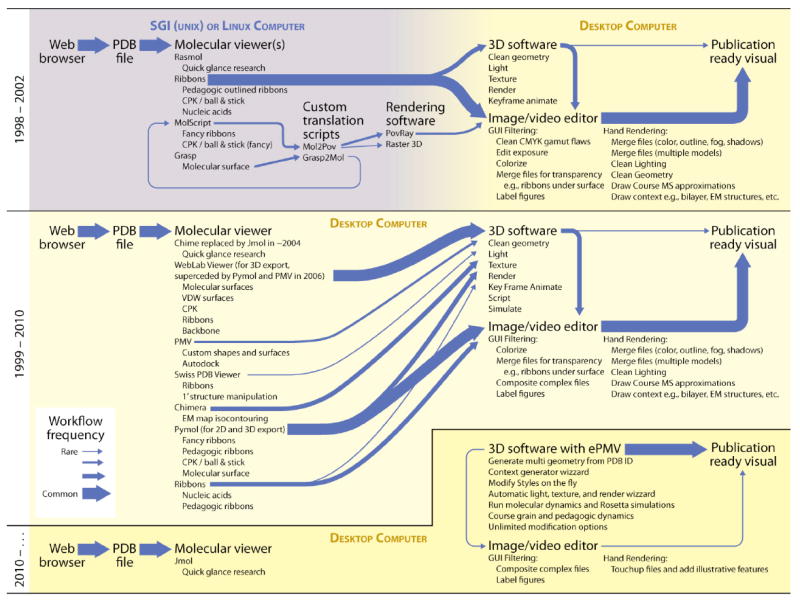
Early protocols, shown at the top, used academic workstations for molecular visualization and required significant post processing to produce publication-quality files. The width of lines in the diagram represent the effort, as estimated from time records kept by Johnson, to create over 3000 PDB-based visualizations since 1998. Straightforward renderings of clean PDB input, e.g., to show a cartoon backbone for a textbook figure, took as few as 15 minutes from start to finish, while more complex representations often took days to set up and hours to render. With time, the capabilities of dozens of software packages merged and expanded to streamline these protocols and to provide new capabilities that were more accessible to novice users. As shown at the center, however, the connections between these methods remained varied and inconsistent. ePMV, shown at the bottom, links the scientific software directly to professional animation applications, combining their abilities and providing access to powerful new tools. ePMV can visualize typical subjects in less than 20 seconds–from entering the PDB code, to selecting the molecular representations, to setting the image style/dimensions, and then rendering a press-ready TIFF. These subjects can be further animated and simulated with relative ease from within the same GUI. Screen-captured video, showing a comparison of ePMV to an export-import protocol, can be viewed at http://epmv.scripps.edu/videos/structure2010.
Several overlapping efforts have been made to address the disconnect between molecular and animation software—either by adding professional animation functionalities to molecular modeling software, e.g., for animation (Hodis et al., 2007) and for shading/rendering (Tarini et al. 2006; Weber, 2009; Chavent, 2011), or by developing molecular viewer plug-ins de novo that are specific to particular hosts (see for instance, BioBlender at http://www.bioblender.net/, PDB2Surface at http://www.grahamj.com/plugins-tutorials.php, or mMaya at http://www.molecularmovies.com/toolkit/). We have instead developed an orthogonal, non-redundant strategy that provides access to code from both worlds, uniting them through a multi-way adaptor called embedded Python Molecular Viewer (ePMV), that enables execution of the molecular modeling environment Python Molecular Viewer (PMV) (Sanner, 1999) inside of a hosting professional 3D animation application. This novel approach repairs the data-to-host disconnect because ePMV initiates a connection to molecular data from any host and maintains it throughout a project’s development.
ePMV provides a full molecular toolkit inside of a growing list of professional 3D host applications familiar to animators, scientific illustrators, and some scientists. On the surface, a simple interface, nested directly inside of a host application’s Graphical User Interface (GUI), allows users to generate all of the common molecular representations as well as a handful of simple animations (see Results and Discussion). On a deeper level, power-users can perform more sophisticated molecular operations through a command-line interface or through optional extension widgets. At any time, a user can access the hundreds of tools native to the host application to mix and match with scientific algorithms as needed. By uniting the host and molecular toolkit functionalities in this manner, ePMV combines a variety of powerful tools within a single host GUI.
ARCHITECTURE
Python links scientific algorithms to professional 3D software
Complex software environments, like molecular viewers and professional 3D animation applications, are usually programmable for advanced use that goes beyond operations supported by the GUI. Historically, such applications have relied on their own custom programming languages that were usually limited in their abilities, and had little or no capability to access external software. Over the past decade, high-level interpreted languages such as Perl, TCL, Javascript (Fisher et al., 2010), and Python have become very popular to solve this problem. A recent growth in the number of host applications that embed a Python interpreter, in particular, has made ePMV both possible and sensible, as Python has become a standard in the 3D industry and in the sciences (Bassi, 2007).
The object-oriented Python programming language supports a hierarchical packaging of modular code that has made it popular in scientific software development. While algorithms can be coded directly in Python, the language was designed to interact with legacy, compute-intensive, and optimized code implemented in compiled languages such as C, C++ or Fortran (Sali and Blundell, 1993; Eswar et al., 2008; Chaudhury et al., 2010). Most professional 3D animation packages are coded in a lower-level language like C++. Since 2005, developers have coded Python wrappers for several leading professional 3D packages, allowing such packages to serve as ePMV hosts. These wrappers expose a particular host’s Application Program Interface (API) to the Python interpreter, allowing programmers to develop high-level scripts and programs written in Python while using the hosts’ functionality. A host embedding a Python interpreter can thus embed the entire Python programming language plus any Python-coded applications within its own API, as shown in figure 2.
Figure 2. Program architecture.
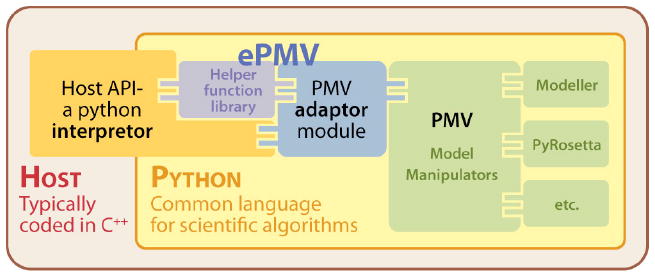
A host application can embed Python and Python applications. A host must provide a Python wrapper for its API to translate code from the host’s low-level (high-speed) language to the relatively user-friendly Python language. With a common foundation of Python, ePMV can translate logic, architecture, and command variations between the host and PMV. We have selected PMV to serve as a foundation that can store the molecular model state, manipulate the model, and plug in other Python model manipulators– hence the title, embedded PMV. Screen-captured video posted at http://epmv.scripps.edu/videos/structure2010 discusses this architecture, highlights the connection to the data and shows advantages of the system.
Even if coded in or wrapped into the same language, independently developed programs rarely share common internal structures to represent the data. As a fully-fledged general-purpose programming language, Python provides a powerful tool for creating adaptors that can facilitate the sharing of events and commands between the molecular modeling environment and various host applications (see figure 3). Since a host cannot naturally translate the molecular data from atoms into spheres, bonds into cylinders, or molecular surfaces into polyhedral meshes that the host can render, we constructed ePMV as a flexible adaptor that can communicate data and events from the molecular graphics package PMV, back-and-forth to any specific host.
Figure 3. Information flow in ePMV.
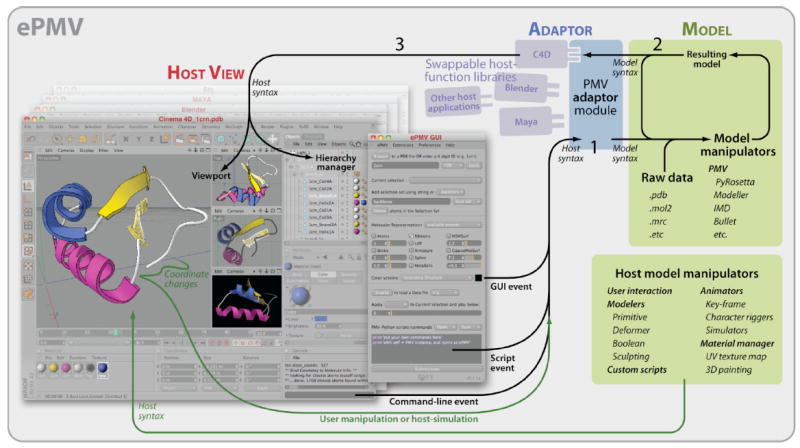
A screenshot from a host application, Cinema 4D, on the left, typifies a host GUI which consists of a 3D viewport, a hierarchical object manager, a Python command-line interface, and other scene managers (interfaces for animation, materials, etc., slightly dimmed in this image). Into this host environment, we have scripted an ePMV GUI that acts as part of the host GUI to automate Python commands and provide a multi-line scripting window. Table 1 highlights features included in the alpha-release version of the ePMV GUI. 1) The ePMV Adaptor translates user events, passed by the host, including host-model-manipulations, from host syntax into commands that the PMV Model can understand then passes these commands to the Model itself. 2) Python-linked manipulation algorithms operate on the current Model state to generate a Resulting model state that the Model passes back to the ePMV Adaptor as an event. 3) ePMV plugs a host-specific library of helper functions into the Adaptor and translates the Resulting model into a set of commands recognizable by the host, which in this example, is a professional animation package called Cinema 4D. The resulting host functions update the view port with a synchronized version of the model.
The screenshot in this Host View shows a four-panel viewport where perspective and orthogonal windows can draw the scene simultaneously with a variety of different rendering styles including OpenGL Shaded, Quick Shaded, and Quick Shaded with Lines. The front view was rendered to show the quality of output generated for movies and stills. A blue texture was made and dragged onto Helix2A to replace PMV’s default pink, and Strand1A (outlined in white) was selected to show the correlation between the geometric objects in the viewport and their representations in the hierarchy manager. The entire process can take less than 30 seconds, from starting the software to producing a publication ready image (for an example of speed and interaction, see screen captured videos at http://epmv.scripps.edu/videos/structure2010).
The core of ePMV functions as a generic translator that can communicate with specific hosts through lightweight swappable “helper-function” libraries. With this setup, the final connections to the host-specific APIs become modular and minimal. Users interested in embedding ePMV into a new host application can simply modify the functions we provide in a template script to synchronize with the new host’s Python wrapped API. Thus, any application providing Python as a scripting language can host ePMV.
To the general user these architecture details remain invisible. In a typical host, ePMV exists as a menu-bar accessible plug-in that pops up in its own window to reveal a panel of buttons, drop-down menus, command-line boxes, and other widgets typical of a molecular graphics viewer GUI (e.g., see Figure 4B). GUI functions available at the time of this printing include: file loading (with various database and multistate model options), chemistry-based selection menus, representation buttons, a data viewer that scrolls between states or adjusts selection-sensitive parameters, and a Python scripting window. The scripting window provides access to the full functionality of PMV and other Python applications. Table 1 outlines these GUI features in more detail. ePMV is available at http://epmv.scripps.edu. Currently, ePMV supports Blender 2.49b (open source freeware preferred by scientists, www.blender.org), Cinema4D v11.5™ via the plug-in Py4D and Cinema4D v12™ (the software used by the majority of medical illustrators, www.maxon.net), and Maya 2011™ (the workhorse of Hollywood and many high-end scientific animation studios, http://autodesk.com). This list can extend to include Houdini (http://www.sidefx.com), Sketchup (http://sketchup.google.com), 3D Studio Max (http://autodesk.com), RealFlow (http://www.realflow.com), SoftImage XSI (http://autodesk.com), the game engine Ogre (http://www.python-ogre.org/), the generalized scientific computing package Enthought (http://www.enthought.com/), and many other Python aware packages.
Figure 4. Examples of ePMV Models and Rendering.
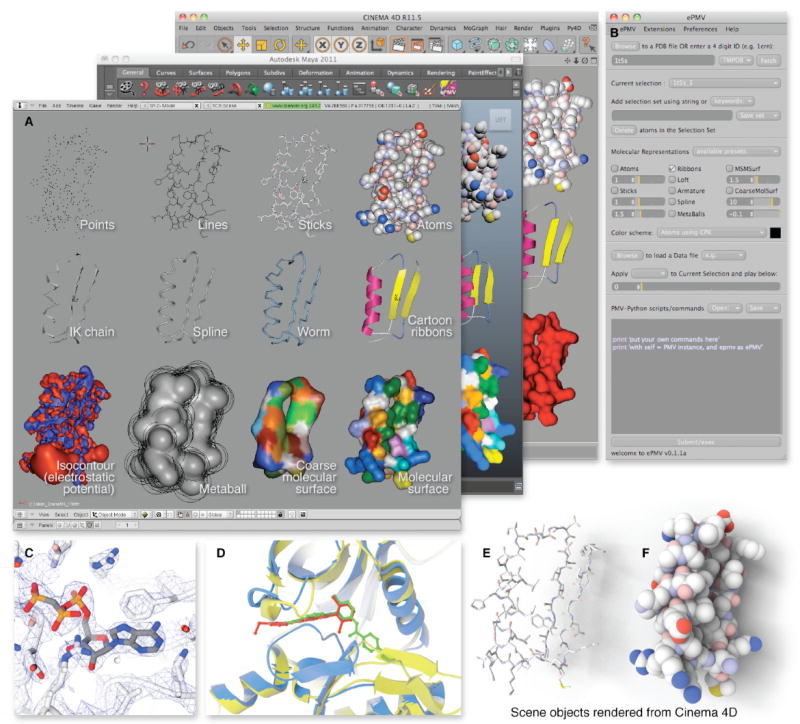
Residues 5 to 46, isolated from Trios phosphate isomerase (PDB ID 1tim (Banner et al., 1976)) show a β-α-β motif.
(A) Realtime screen captures demonstrate how ePMV can produce various representations of data consistently across three different hosts. To produce this demonstration scene, a Python script run through ePMV generates a variety of representations of PDB data in three different 3D animation packages: Maya, Blender, and Cinema 4D. Most are standard geometric representations, such as the molecular surface (Sanner et al., 1996) or the isocontouring surface (Bajaj et al., 1996) of the electrostatic fields (Baker et al., 2001). Furthermore, one backbone, labeled IK chain, is traced with skeletal joint objects set up as an inverse-kinematic armature that can be pushed and pulled like a chain to deform any attached geometry as exemplified in figure 6. (B) A detailed view of the sections of the GUI from Cinema 4D/Py4D with buttons, menus, and text boxes that support this basic functionality. Please see http://epmv.scripps.edu/videos/structure2010 for a screen-captured movie that demonstrates the use of the GUI basics in more detail. (C) PDB ID 1t5s (Sorensen et al.,2004) was used to generate a standard structural biology figure that examines the ATP binding site. The electron density map of the calcium pump was retrieved from the Electron Density Server (EDS; Kleywegt et al. [2004]) and isocontoured at a value of −0.23 (Bajaj et al., 1996) to create a mesh. A backbone tube was generated along with stick renderings for the ligand and receptor. Color-by-polarity was applied to the receptor and Color-by-atom was applied to the ACP ligand. Host-based fog creates depth-cuing. (D) Selections made with the GUI can be combined with basic functions for research analysis. Here, a homology model target (blue) is compared to its template (gray) and to the actual crystal structure for 1m52.pdb (yellow) that came out at a later date. Crystallographic ligands for the template (red) and the resolved structure (green) highlight functionality of the kinase switch loop. (E and F) The images show a rendering from Cinema 4D with the render-time option of ambient occlusion turned on to enhance the surface pockets for two of the representations from the scene and includes an editorial cast shadow to highlight the facile ray-tracing options available in hosts.
Table 1.
Graphic User Interface (GUI) functions available in ePMV v0.0.2a Related to Figure 3
| GUI section | GUI Feature | Descriptive example |
|---|---|---|
| Data access | File System browser | Load a local PDB file |
| Fetch from web | Download to cache and then load a PDB file from the internet directly from the ePMV GUI without opening a web browser. | |
| Database pointer | Specify to fetch from a variety of optional databases, e.g., Optimized Membrane Protein or Transmembrane Protein Data bases, or load CIF or PSQ versions of the data. | |
| Selection | Current selection: | Choose a molecule or a previously saved custom selection set |
| Add selection set | Make a selection using PMV commands or dozens of provided keywords to make chemistry based selections | |
| Save, rename, or delete selection sets | Save complicated selections for later access. Rename the defaults to easily track numerous and complex selections. Delete unwanted selection sets without affecting the actual atoms | |
| Delete the atoms | Remove atoms defined by the current selection set (atoms are deleted from the host view as well as from the underlying model.) | |
| Representation | Choose from preset Representations | A present representation will turn on and adjust parameters of the various appropriate standard representations |
| Atoms | Spacefilling or CPK representation with each atom represented as a sphere with van der Waals radii and a single radius scaling slider | |
| Sticks | Atom and bond representation with a scaling option and an atom/bond radius ratio slider | |
| Ribbons | Cartoon backbone representation | |
| Loft | A smoothed cartoon backbone that uses host-based lofting technologies (morphing a smooth skin from one 2D cross-section shape to another) to create a single mesh. Users can access host tools to alter the transverse profiles of coils, helices and sheets independently or universally. Useful for animating transition states to avoid binary flickers in secondary structures while morphing between conformers. | |
| Armature | A joint/bone technology ubiquitous in hosts allows molecular models to be animated with kinematics rigging techniques and tools. | |
| Spline | A multipurpose 3D curve drawn between atoms can be used for animating joints and backbones or for creating a smooth worm model backbone or a linear CA trace for example. | |
| Metaballs | A surfacing technology ubiquitous in hosts that skins clusters of points, splines, or spheres. It can make a smooth skin between disparate geometry types and can be used, for example, to maintain a smooth and continuous mesh surface over a dynamic molecule. | |
| MSMSurf | Standard “solvent excluded” molecular surface representation with an adjustable probe radius | |
| CoarseMolSurf | Standard Gaussian-based coarse molecular surface representation with adjustable isovalue and resolution sliders | |
| Color scheme: | Color representations using a variety of color schemes, e.g., Color By: atom type, residue, secondary structure, temperature factor, etc. | |
| Data Viewer | Disk Browser | Load a variety of data file types such as Molecular Dynamics files (trj, xtc) or Volumetric grid Maps (e.g., mrc, ccp4, map, etc.) |
| Apply Data | Select which loaded data file to apply to the current geometry | |
| Data Player | Context sensitive numeric slider bar will set appropriate ranges and adjust the parameter accessible in the data file. Loading an NMR structure in the Data Access Panel will set the player to a range from 0 to the number of structures in the PDB file and the slider can be used to scroll through them Loading a .ccp4 file will set the data player to adjust the isocontour value. | |
| Script manager | Open | Open a python script from library of premade scripts or from a custom file on the hard drive |
| Save (as) | Save a copy of a custom script or save a new version of a modified default script | |
| Script window | Access the full functionality of PMV and other python applications by typing or pasting script text into this window. For users unfamiliar with PMV’s python syntax, every action performed in PMV has the corresponding command written to a log file, which can be copied and pasted into ePMV. |
RESULTS AND DISCUSSION
Basic functionality– a molecular viewer inside of a professional 3D animation package
The modular structure of ePMV extends various host applications, in a consistent manner, with the basic functions expected of a molecular viewer. With simple Python commands or a provided GUI, as shown in figure 4, users can quickly create common representations of molecular models directly inside of a host’s viewport. Since it contains the functionality of PMV, ePMV can import dozens of file types, generate multiple representations at consistent and relevant scales, and then color them with traditional schemes. For example, it can read and model all standard files from the Protein Data Bank (PDB http://www.pdb.org (Berman et al., 2000)) and simultaneously create isocontoured surface meshes based on volumetric data (Bajaj et al., 1996) ranging from crystallography density maps to medical magnetic resonance imaging (MRI) scans. To easily access changes over time, the basic GUI provides a data player to scroll through multiple molecular conformers, such as molecular dynamics trajectories, nuclear magnetic resonance (NMR) states, and the ligand binding-modes in docking log files.
ePMV embeds these molecular tools within hosts that specialize in 3D modeling, animating, and rendering. Two highly useful interface features are rarely available in molecular viewers, but have evolved to become standards in hosts to help users work with improved control and intuition (see video screen captures at http://epmv.scripps.edu/videos/structure2010). First, a multi-angle viewport allows a user to visualize the model (or collection of models called a scene) from any number of orthogonal or perspective camera angles, and to toggle back and forth from the multi-angle view to an enlargement of any single view. When united with other standards like construction grids, editable coordinate palettes, and snap-to scene modeling options, the user can move through a scene and interact with a fine degree of control. Second, a hierarchical tree (or node) palette allows users to intuitively organize a scene, at the same time that timeline and material palettes isolate the complex tasks of animation and color/texture management which are often glossed over or deeply buried in molecular viewer GUIs.
Beyond interface enhancements, an ePMV scene can be augmented using built-in host functions that are often difficult to access or nonexistent in molecular viewers. For example, render-time options like cast shadows, global illumination (photorealistic, highly detailed shading), ambient occlusion (light attenuation mapping), and dozens more can be turned on in all hosts, but are rarely offered concurrently by any single molecular viewer. Features like shadows and ambient occlusion can elucidate critical details, e.g., active site cavities (figure 4F), which are otherwise difficult to distinguish in a shadowless scene (Langer and Buelthoff, 2000). Such options can be turned on to produce high quality images or movies as output for publication, but can also be utilized to enhance interactive research, where certain hosts running on computers with high-power graphics capabilities can render these effect details in realtime.
While ePMV offers the functionality of a molecular viewer, it does not fully replace the utility of a molecular viewer. Some molecular viewers, for example, have been optimized to visualize up to a million atoms (spheres), quickly and efficiently (Bajaj, 2004), but this ability will inherently vary from host to host depending on each host’s architecture. Many hosts are optimized to visualize and manipulate small numbers of high polygon count meshes or variably defined particle systems rather than large numbers of simple objects, thus ePMV may move relatively slowly to generate atom or bond representations of molecules with more than 30,000 atoms. Three-dimensional mesh representations like molecular surfaces, cartoon ribbons, and volumetric isocontours, however, are visualized as efficiently in the host as they are in PMV and often make more suitable representations for larger molecular models (Hodges et al., 2003). Additionally, workarounds exist to speed up interaction, for example, generating a molecular surface with a probe radius set to 0.001Å will create an atomistic mesh that tightly hugs the van der Waals radii to mimic a color-coded spacefilling representation. Now that ePMV can plug this type of data into a variety of hosts, open-source and host developers can work to enhance the efficiency of any lagging representations by solving the specific limitations within each host’s architecture.
Combined environments– facile generation of complex stories and mesoscale events
Although a user can import multiple structure files into most any molecular viewer, these viewers are typically not designed to assemble complex scenes or to export animated movies that convey events. Most viewers, for example, cannot easily situate a protein into a cellular context and animate multiple molecular interactions to explain a mechanism of action (McGill, 2008). With ePMV, however, a user can interoperate a variety of molecular modeling and host tools to construct highly complicated scenes.
ePMV can import data and adjust (simplify or enhance) the level of detail (e.g., from atomistic to geometric for PDB files) to suit specific audiences or to convey the confidence levels for each object shown in the scene. At any time, additional host objects can be added to a scene to interact with the molecular ePMV models. These objects can be rendered as part of the final visual: for example, iconographic lipid shapes can be instanced onto spline curves to sculpt an organic bilayer, or molecules with no available structure can be modeled by hand and placed into the scene as theoretical low-confidence placeholders. Host objects can also serve as tools “behind the scenes” in the workflow: for instance, background images that define cell compartments can be used as 2D template sketches to draft 3D models. All of the options of the host application are simultaneously available to further model and enhance the scene. While many such features exist sparsely in available molecular viewers, they exist ubiquitously in hosts where they are relatively easy to generate and alter. Elements like lights, textures, and fog, though adjustable in molecular software, have many more controls and more intuitive controls in hosts. Other options that can greatly extend molecular modeling and rendering functionality are only available in hosts. For example, depth of field helps to clarify complex z-dimension overlaps and focus viewer attention, and motion blur can imply dynamics in static images or smooth animated movies (Figure 6).
Figure 6. ePMV interoperations between host and external algorithms.
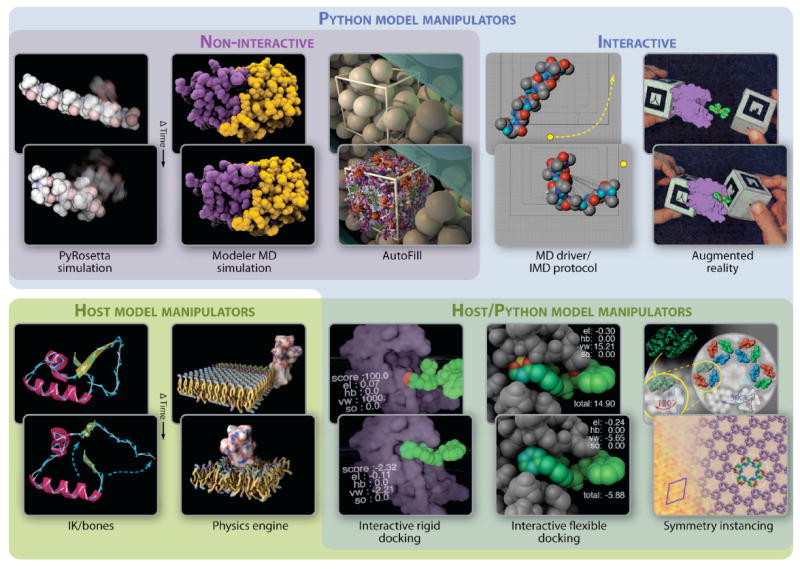
The back images show the initial state of an imported or constructed model and the front images show a change in the model state as induced by each method. From the top left, Monte Carlo mechanics perform ab initio folding of a short amino-acid sequence via PyRosetta (Chaudhury et al., 2010) to yield an alpha helix. A molecular dynamics simulation using Modeller (Eswar et al., 2008) was performed on HIV protease (PDB ID 3nu3; Shen et al. [2010]). AutoFill builds an atomic model based on the reference Takamori et al. (2006) onto synaptic cleft vesicles imported from an electron microscope tomography model from Arthur et al. (2010). Boundaries for the fill were generated interactively with native host tools. The Interactive Molecular Driver (Stone et al., 2001) or the realtime option in the Modeller widget allows realtime interactive molecular dynamics with additional forces provided by the user’s mouse gestures. Augmented reality allows a user to interact with data via hand held markers tracked by a camera (Gillet et al., 2005), in this case, to perform an interactive rigid body docking with intuitive mid-air hand gestures. The backbone of crambin (PDB ID 1crn (Teeter, 1984)) is animated to flex using inverse kinematic joints at each α-carbon. Molecules generated on a grid using host-based instancing are randomized and animated to imply Brownian motion with random walks combined with Newtonian physics solvers and collision avoidance. Model manipulation algorithms contributed by the host allow a ligand to be hand-guided into a binding site with real time scores (visible as text and color gradients on the atoms) provided by Python modules like Autodock (Huey et al, 2007) and PyRosetta (Chaudhury et al., 2010). Host-provided physics shortcuts (soft-body springs for bonds) allow interactive flexible docking with real-time scoring within the receptor and the ligand as well. An atomic model is fit to an electron micrograph using symmetry instancing to generate the molecular and 2D crystallographic symmetry. Please see http://epmv.scripps.edu/videos/structure2010 for screen-captured video of each example in this figure and visit the main site http://epmv.scripps.edu for links to tutorials on each topic.
Just as host objects can be added and altered at any time, ePMV models in the host environment remain connected to the underlying PMV model, which allows them to be added, deleted, or altered at any time as well. This is one of the major advantages of ePMV: it repairs the data-host disconnect that occurs with typical import/export protocols, and now allows users to experience a seamless, non-linear and repeatable workflow from within any host environment. A user can, for example, set up an animation of a ligand-binding event using molecular surfaces for the receptor and ligand, decide with a colleague that the surfaces obscure the interaction, and just toggle four checkboxes in the GUI to change the receptor to a ribbon and the ligand to a ball-and-stick representation as the animation continues to loop through its keyframes.
Figure 5 displays a typical scene that would be useful in various professional, educational, editorial and outreach communications. The raw scene is constructed in a host with ePMV, and then various host options are used to output illustrations and animations for different purposes. In Figure 5A, six different data (PDB and cryo-electron density maps) structures were loaded into a host scene and arranged to tell a story of calcium regulation in eukaryotes based on figure 26-12 from (Pollard and Earnshaw, 2007). First, two curves were hand-drawn and extruded slightly into the screen to create organic polyhedral surfaces that represent the various organelle membranes using host-based model construction tools. Transmembrane components were placed perpendicularly into the membrane polyhedrons, using ePMV, including: transmembrane PDB files loaded from the Protein Data Bank of Transmembrane Proteins (PDBTM) at http://pdbtm.enzim.hu/ (Tusnady et al., 2004, 2005a, 2005b) and the Orientations of Proteins in Membranes (OPM) database at http://opm.phar.umich.edu (Lomize et al., 2006); cryo-electron density maps loaded from The Electron Microscopy Data Bank (EMDB) at EBI at http://www.ebi.ac.uk/pdbe/emdb (Henrick et al., 2003); and geometric shapes that represent unresolved proteins. Structures don’t yet exist for the voltage-sensitive or store-operated channels, so geometric shapes were modeled by hand to serve as placeholders. These two models lack atomistic detail to imply low confidence in the structure, but were designed to fit into the style of the scene as generic channel shapes (based on family archetypes) to avoid distracting undergraduate readers from the main lesson (Kramer, 2010). For a graduate-level audience, these channel models could be replaced with graphic squares, for example, to more accurately imply zero-structural confidence. To demonstrate a range of tools, Figure 5A shows two different approaches to generate lipid bilayers: on the left, host-based cloning tools were used to coat the membrane geometry with a generic library of roughly perpendicular lipids and an inexpensive host physics simulation was performed to prevent the lipids from overlapping the protein geometries to imply a lipid bilayer. On the right, a rounded square was extruded along the bilayer splines to generate a more simplified representation.
Figure 5. Complex ePMV scene rendered for different audiences and purposes.
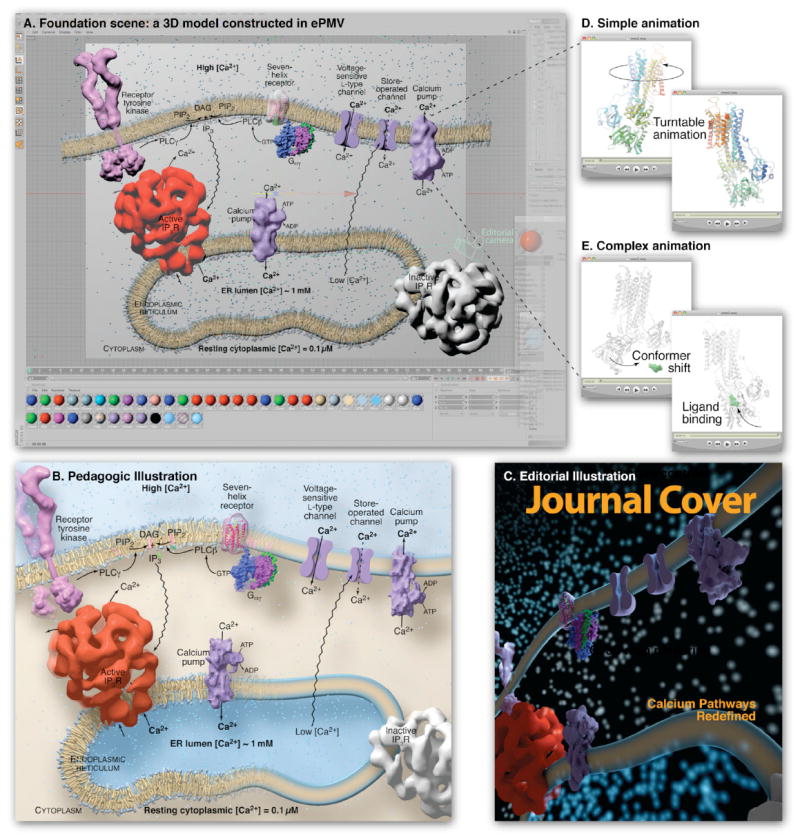
(A) A cell biology scene modeled with ePMV and host geometry, running in sample host Cinema 4D, depicts pathways of Ca2+ release and uptake using molecular structures from many sources. ePMV can quickly model representations of structural data while host tools can be used to model geometries to represent unknown or abstracted components. The host can then be used to assemble all of the models into a contextual scene. This scene includes a coarse molecular surface for receptor tyrosine kinase (PDB IDs 3kxz (Moy et al., 2010) and 2e9w (Yuzawa et al., 2007)) connected with two host cylinders to represent the unresolved transmembrane domains. Lipids are based on PDB coordinates pulled from a molecular dynamics simulation and simplified as an extruded rectangle on the right. The receptor and trimeric G protein, and calcium pump (entries 1f88; Palczewski et al. [2000]; and 1got; Lambright et al. [1996]) from the PDBTM, were modeled with coarse molecular surfaces (Bajaj et al., 1996) and the receptor made transparent using a host texture to reveal an underlying ePMV ribbon model. The calcium pump (PDB ID 1t5s (Sorensen et al.,2004)) was loaded from the optional Orientations of Protein Membranes Database to ensure a proper translation and procession in the membrane. Low-confidence representations of the voltage and store-operated channels were hand-modeled using host tools to complete the story with minimal distraction. The entry 1061 (Sato et al., 2004) was loaded from the EMDB (Henrick et al., 2003) and isocontoured (Bajaj et al., 1996) to represent the Active IP3 receptor and a gray texture was applied to a duplicated instance to represent the inactive state, since no density map models exist for this conformation. Please see http://epmv.scripps.edu/videos/structure2010 for a time-lapsed screen capture showing the construction of this model and a comparison to more traditional approaches. (B) A textbook figure based on the entire scene and rendered with educational style settings. (C) A second camera (“Editorial camera”) was placed at an extreme angle, and editorial style scene settings were selected to render the scene with a dramatic editorial mood. (D) A looping turntable animation of the calcium pump is useful for professional slide presentations and websites. (E) A detailed animation shows conformational change in the calcium pump, based on two crystallographic structures (PDB ID 1su4 (MacLennan and Green, 2000) and 1t5s (Sorensen et al.,2004)). Domain-localized linear interpolation of the atoms from a molecular dynamics simulation performed with Modeller in ePMV and a hinged bone skeleton (host) for large domain motion was used to morph between the two experimental conformations, host-based vibration was applied to the ligand to imply Brownian motion, and the position of the ligand was keyframed to migrate into the binding pocket at a specific time. A host physics engine was used to prevent the vibrating ligand from colliding with the atoms in the receptor.
Figure 5B-E highlights ways that ePMV can stylize any of the elements comprising this scene to meet particular publication needs. Once constructed, simple camera, lighting, and rendering modifications allow the same scene to be rendered for professional presentations, teaching and editorial purposes. Components from the scene or the entire scene can be animated to reveal structure details or to describe events. Lastly, figures that highlight structural details can be easily constructed by combining ePMV’s selection tools, representation styles, and color schemes with host cameras and render settings. Many of the ideal host settings can be accessed and setup with the click of a button through ePMV styles, which are designed by expert users. For example, Style->PrintPublication->White will create a standard illustration for journal publication, with a white background, depth-cuing fog, upper left lighting, ambient occlusion, and the high-resolution render settings, established by professional illustrators, graphic designers and printers, that are required for journal publication.
A static scene, like figure 5, inherently creates a storyboard describing a time-based event where the arrows imply either motion or interaction. Using this as a starting point, all of the host and molecular simulation tools can be combined to create an animated version of the figure (see examples at http://epmv.scripps.edu/videos/structure2010). At its simplest, the static image itself may be animated: arrows and labels can fade in and out, or object positions can be “keyed” and interpolated in sequence to break the story down into sub-events. Alternatively, full 3D animation may be used to show protein interactions and processes. This type of animation is difficult in molecular viewers, but is possible within ePMV, where multiple-viewports, force-field or spring attractions and collision prevention from the host can coarsely approximate two molecules while pushing molecules ancillary to the story (like lipids in the bilayer) out of the way. In addition, advanced molecular modeling methods, such as interpolation between structures, Brownian dynamics (McGuffee, 2010), and molecular dynamics, may be used to add scientific rigor to the motions and interactions depicted in the animation. Whether from a host or from ePMV, both the static and dynamic components of each object/model in a scene can be integrated, modified, and rendered to realize a movie of any complexity.
ePMV unites scientific tools in a common model
ePMV currently includes a basic, stable GUI that interfaces the PMV molecular modeling software with 3D animation hosts, as well as a collection of scripts that advanced users can invoke and modify to adopt ePMV for use in research and visualization settings. Since ePMV can access external Python algorithms or algorithms native to the host, Python applications can plug into the model (figure 3) to allow a user to perform computational experiments or manipulations on the molecular or subcellular models. Figure 6 shows some of the methods that we have included in ePMV, including Monte Carlo and molecular dynamics simulators, augmented reality toolkits, docking algorithms, procedural subcellular modelers, and game-engine physics simulators. These have been combined and tested with various host-based tools like character rigging (inverse kinematics, bones/joints, walk cycles, etc.), agent behaviors, instancing, and the host physics engines.
As the necessary adaptor and helper functions become refined, we plan to integrate many of these as stabilized options into simple or sophisticated GUIs to allow researchers who do not specialize in computational biology to initiate such tasks. ePMV has already been optimized to run real-time interoperating simulations to generate powerful hybrid tools, for example, functions like Monte Carlo peptide folding from PyRosetta (Chaudhury et al., 2010) and rigid-docking scores from AutoDock (Huey et al, 2007) can interact with host-based collision-detection to simulate interactive rigid or flexible docking. Our initial tests show that using the computationally inexpensive host-system to avoid collisions provides significantly improved results for the all-atoms docking scores and will be further examined for potential as a research tool.
Conclusions
ePMV creates both a common model and a common GUI environment to unite molecular modeling software and 3D animation applications, as well as algorithmic contributions from a variety of scientific software packages. While most hybridization efforts have re-coded molecular graphics functionalities into one particular host API, our model-view-presenter (Potel, 1996) approach does not require de novo implementation of available methods and can quickly interoperate with a variety of hosts and scientific algorithms. We have scripted the bulk of ePMV’s helper functions to be broad and generic. Thus, as PMV’s interactive capabilities increase and functionality expands, ePMV users can automatically port new, enhanced, or corrected features into all hosts by simply updating PMV. Users can also visit http://epmv.scripps.edu, to learn from tutorials, communicate in forums or participate in development. Since Python serves as a foundation for communication, developers of external Python applications (not just molecular modeling software) can tailor their export formats to plug into PMV or directly into the ePMV adaptor to make their software simultaneously accessible to all of the hosts that ePMV already supports. This capability allows ePMV to facilitate projects well beyond the realm of biology.
Computational components to perform complex simulations, to put proteins into context, or to animate cell events have existed independently for years, but have been largely restricted to their individual professional domains. As a flexible adaptor, ePMV can unite the capabilities of both scientific Python modules and highly optimized/generalized hosts. By providing molecular graphics tools in an environment designed to generate Hollywood-caliber movies, both scientists and outreach specialists can harness ePMV to address the increasing complexity of scientific communication. While ePMV may not convert structural biologists into award-winning scientific illustrators (Nesbit and Bradford, 2010) or turn professional animators into molecular modelers, it can provide a fertile platform where these two communities can meet, collaborate, and ultimately learn from each other for the benefit of all.
Acknowledgments
We thank Py4D programmer, Sebastian Rath of Maxon Computer for development consultation and technical support with Py4D. At The Scripps Research Institute, we would like to thank Andrew Ward for manuscript input/editing and Mostafa Al-Alusi for early library development while working on the PDBtoSurface plug-in. Thanks to members of the Association of Medical Illustrators for assessing and expressing development needs in conversations prior to 2007. Elsevier allowed Johnson to generate a 3D reconstruction based on his own 2D figure 26-12 from the textbook, Cell Biology (Pollard and Earnshaw 2007) for use in figure 5 of this article. This research was supported in part by an NSF Predoctoral Fellowship (NSF 07576) to GTJ, and NIH Grant P41 RR08605 to AJO and MFS. L. Autin and G. Johnson jointly wrote the paper.
References
- Arthur CP, Dearn D, Pagratis M, Chapman ER, Stowell MHB. Loss of synaptotagmin IV results in a reduction in synaptic vesicles and a distortion of the Golgi structure in cultured hippocampal neurons. Neuroscience. 2010;167:135–142. doi: 10.1016/j.neuroscience.2010.01.056. [DOI] [PMC free article] [PubMed] [Google Scholar]
- Bajaj C, Djeu P, Siddavanahalli V, Thane A. VIS ’04 Proceedings of the conference on Visualization ’04. Austin: IEEE Computer Society Press; 2004. [Google Scholar]
- Bajaj C, Pascucci V, Schikore D. Proceedings of ACM Siggraph/IEEE Symposium on Volume Visualization. San Francisco: ACM Press; 1996. [Google Scholar]
- Bajaj C, Djeu P, Siddavanahalli V, Thane A. VIS ’04 Proceedings of the conference on Visualization ’04. 2004:243–250. [Google Scholar]
- Baker NA, Sept D, Joseph S, Holst MJ, McCammon JA. Electrostatics of nanosystems: application to microtubules and the ribosome. Proc Natl Acad Sci U S A. 2001;98:10037–10041. doi: 10.1073/pnas.181342398. [DOI] [PMC free article] [PubMed] [Google Scholar]
- Banner DW, Bloomer A, Petsko GA, Phillips DC, Wilson IA. Atomic coordinates for triose phosphate isomerase from chicken muscle. Biochem Biophys Res Commun. 1976;72:146–155. doi: 10.1016/0006-291x(76)90972-4. [DOI] [PubMed] [Google Scholar]
- Bassi S. A primer on Python for life science researchers. PLoS Comput Biol. 2007;3:e199. doi: 10.1371/journal.pcbi.0030199. [DOI] [PMC free article] [PubMed] [Google Scholar]
- Berman HM, Westbrook J, Feng Z, Gilliland G, Bhat TN, Weissig H, Shindyalov IN, Bourne PE. The Protein Data Bank. Nucleic Acids Res. 2000;28:235–242. doi: 10.1093/nar/28.1.235. [DOI] [PMC free article] [PubMed] [Google Scholar]
- Berry D. Molecular animation of cell death mediated by the Fas pathway. Sci STKE. 2007:380. [Google Scholar]
- Chaudhury S, Lyskov S, Gray JJ. PyRosetta: a script-based interface for implementing molecular modeling algorithms using Rosetta. Bioinformatics. 2010;26:689–691. doi: 10.1093/bioinformatics/btq007. [DOI] [PMC free article] [PubMed] [Google Scholar]
- Eswar N, Eramian D, Webb B, Shen MY, Sali A. Protein structure modeling with MODELLER. Methods Mol Biol. 2008;426:145–159. doi: 10.1007/978-1-60327-058-8_8. [DOI] [PubMed] [Google Scholar]
- Chavent M, Lévy B, Krone M, Bidmon K, Nominé J, Ertl T, Baaden M. GPU-powered tools boost molecular visualization. Briefings in Bioinformatics. 2011 doi: 10.1093/bib/bbq089. [DOI] [PubMed] [Google Scholar]
- Fawcett DW. The Cell. Philadelphia: W.B Saunders; 1981. [Google Scholar]
- Fisher D, Drucker SM, Fernandez R, Ruble S. Visualizations Everywhere: A Multiplatform Infrastructure for Linked Visualizations. IEEE Transactions on Visualization and Computer Graphics. 2010;16:1157–1163. doi: 10.1109/TVCG.2010.222. [DOI] [PubMed] [Google Scholar]
- Gillet A, Sanner M, Stoffler D, Olson A. Tangible interfaces for structural molecular biology. Structure. 2005;13:483–491. doi: 10.1016/j.str.2005.01.009. [DOI] [PubMed] [Google Scholar]
- Goddard TD, Ferrin TE. Visualization software for molecular assemblies. Curr Opin Struct Biol. 2007;17:587–595. doi: 10.1016/j.sbi.2007.06.008. [DOI] [PMC free article] [PubMed] [Google Scholar]
- Goodsell DS. Visual Methods from Atoms to Cells. Structure. 2005;13:347–354. doi: 10.1016/j.str.2005.01.012. [DOI] [PubMed] [Google Scholar]
- Goodsell DS. The Machinery of Life. NewYork: Springer; 2009a. [Google Scholar]
- Goodsell DS. RCSB Protein Data Bank Newsletter 41, PDB Community Focus: Gael McGill, PhD, and Graham Johnson, Molecular Animators. Piscataway: RCSB; 2009b. [Google Scholar]
- Goodsell DS, Johnson GT. Filling in the gaps: artistic license in education and outreach. PLoS Biol. 2007;5:e308. doi: 10.1371/journal.pbio.0050308. [DOI] [PMC free article] [PubMed] [Google Scholar]
- Gramling C. 2005 Visualization Challenge: Illustration. Science. 2005;309:1990. doi: 10.1126/science.309.5743.1990. [DOI] [PubMed] [Google Scholar]
- Henrick K, Newman R, Tagari M, Chagoyen M. EMDep: a web-based system for the deposition and validation of high-resolution electron microscopy macromolecular structural information. J Struct Biol. 2003;144:228–237. doi: 10.1016/j.jsb.2003.09.009. [DOI] [PubMed] [Google Scholar]
- Hodis E, Schreiber G, Rother K, Sussman JL. eMovie: a storyboard-based tool for making molecular movies. Trends Biochem Sci. 2007;32:199–204. doi: 10.1016/j.tibs.2007.03.008. [DOI] [PubMed] [Google Scholar]
- Hodges ERS, Buchanan S, Cody J, Nicholson T. The Guild Handbook of Scientific Illustration. Second Edition. Hoboken: John Wiley & Sons Inc; 2003. [Google Scholar]
- Huey R, Morris GM, Olson AJ, Goodsell DS. A semiempirical free energy force field with charge-based desolvation. J Comput Chem. 2007;28:1145–1152. doi: 10.1002/jcc.20634. [DOI] [PubMed] [Google Scholar]
- Iwasa JH. Animating the model figure. Trends Cell Biology. 2010;20:699–704. doi: 10.1016/j.tcb.2010.08.005. [DOI] [PubMed] [Google Scholar]
- Jaakola VP, Griffith MT, Hanson MA, Cherezov V, Chien EY, Lane JR, Ijzerman AP, Stevens RC. The 2.6 angstrom crystal structure of a human A2A adenosine receptor bound to an antagonist. Science. 2008;322:1211–1217. doi: 10.1126/science.1164772. [DOI] [PMC free article] [PubMed] [Google Scholar]
- Kramer IM. RCSB Protein Data Bank Newsletter 44, Education Corner: A Search For Best Methods to Illustrate Complex Information. Piscataway: RCSB; 2010. [Google Scholar]
- Langer MS, Buelthoff HH. Depth discrimination from shading under diffuse lighting. Perception. 2000;29(6):649–660. doi: 10.1068/p3060. [DOI] [PubMed] [Google Scholar]
- Kirchhausen T. Imaging endocytic clathrin structures in living cells. Trends Cell Biol. 2009;19:596–605. doi: 10.1016/j.tcb.2009.09.002. [DOI] [PMC free article] [PubMed] [Google Scholar]
- Kleywegt GJ, Harris MR, Zou JY, Taylor TC, Wahlby A, Jones TA. The Uppsala Electron-Density Server. Acta Crystallogr D Biol Crystallogr. 2004;60:2240–2249. doi: 10.1107/S0907444904013253. [DOI] [PubMed] [Google Scholar]
- Kühner S, van Noort V, Betts MJ, Leo-Macias A, Batisse C, Rode M, Yamada T, Maier T, Bader S, Beltran-Alvarez P, et al. Proteome Organization in a Genome-Reduced Bacterium. Science. 2009;326:1235–1240. doi: 10.1126/science.1176343. [DOI] [PubMed] [Google Scholar]
- Lambright DG, Sondek J, Bohm A, Skiba NP, Hamm HE, Sigler PB. The 2.0 A crystal structure of a heterotrimeric G protein. Nature. 1996;379:311–319. doi: 10.1038/379311a0. [DOI] [PubMed] [Google Scholar]
- Lomize MA, Lomize AL, Pogozheva ID, Mosberg HI. OPM: orientations of proteins in membranes database. Bioinformatics. 2006;22:623–625. doi: 10.1093/bioinformatics/btk023. [DOI] [PubMed] [Google Scholar]
- MacLennan DH, Green NM. Structural biology. Pumping ions. Nature. 2000;405:633–634. doi: 10.1038/35015206. [DOI] [PubMed] [Google Scholar]
- McGill G. Molecular Movies… Coming to a Lecture near You. Cell. 2008;133:1127–1132. doi: 10.1016/j.cell.2008.06.013. [DOI] [PubMed] [Google Scholar]
- McGuffee SR, Elcock AH. Diffusion, Crowding and Protein Stability in a Dynamic Molecular Model of the Bacterial Cytoplasm. PLoS Computational Biology. 2010;6:1–18. doi: 10.1371/journal.pcbi.1000694. [DOI] [PMC free article] [PubMed] [Google Scholar]
- Moy FJ, Lee A, Gavrin LK, Xu ZB, Sievers A, Kieras E, Stochaj W, Mosyak L, McKew J, Tsao DH. Novel synthesis and structural characterization of a high-affinity paramagnetic kinase probe for the identification of non-ATP site binders by nuclear magnetic resonance. J Med Chem. 2010;53:1238–1249. doi: 10.1021/jm901525b. [DOI] [PubMed] [Google Scholar]
- Nesbit J, Bradford M. 2009 Visualization Challenge. Science. 2010;327:945. doi: 10.1126/science.327.5968.945. [DOI] [PubMed] [Google Scholar]
- O’Donoghue SI, Goodsell DS, Frangakis AS, Jossinet F, Laskowski RA, Nilges M, Saibil HR, Schafferhans A, Wade RC, Westhof E, Olson AJ. Visualization of macromolecular structures. Nat Methods. 2010;7:S42–55. doi: 10.1038/nmeth.1427. [DOI] [PMC free article] [PubMed] [Google Scholar]
- Palczewski K, Kumasaka T, Hori T, Behnke CA, Motoshima H, Fox BA, Le Trong I, Teller DC, Okada T, Stenkamp RE, et al. Crystal structure of rhodopsin: A G protein-coupled receptor. Science. 2000;289:739–745. doi: 10.1126/science.289.5480.739. [DOI] [PubMed] [Google Scholar]
- Pollard TD, Earnshaw WE. Cell Biology. New York: W.B Saunders/Elsevier; 2007. [Google Scholar]
- Potel M. MVP: Model-View-Presenter The Taligent Programming Model for C++ and Java. Cuppertino: Taligent Inc; 1996. [Google Scholar]
- Šali A, Blundell TL. Comparative protein modelling by satisfaction of spatial restraints. J Mol Biol. 1993;234:779–815. doi: 10.1006/jmbi.1993.1626. [DOI] [PubMed] [Google Scholar]
- Sanner MF. Python: A Programming Language for Software Integration and Development. J Mol Graphics Mod. 1999;17:57–61. [PubMed] [Google Scholar]
- Sanner MF, Olson AJ, Spehner JC. Reduced surface: an efficient way to compute molecular surfaces. Biopolymers. 1996;38:305–320. doi: 10.1002/(SICI)1097-0282(199603)38:3%3C305::AID-BIP4%3E3.0.CO;2-Y. [DOI] [PubMed] [Google Scholar]
- Sato C, Hamada K, Ogura T, Miyazawa A, Iwasaki K, Hiroaki Y, Tani K, Terauchi A, Fujiyoshi Y, Mikoshiba K. Inositol 1,4,5-trisphosphate receptor contains multiple cavities and L-shaped ligand-binding domains. J Mol Biol. 2004;336:155–164. doi: 10.1016/j.jmb.2003.11.024. [DOI] [PubMed] [Google Scholar]
- Sharpe J, Lumsden C, Woolridge N. In Silico: 3D Animation and Simulation of Cell Biology With Maya and MEL. Amsterdam: Elsevier/Morgan Kaufman; 2008. [Google Scholar]
- Shen CH, Wang YF, Kovalevsky AY, Harrison RW, Weber IT. Amprenavir complexes with HIV-1 protease and its drug-resistant mutants altering hydrophobic clusters. FEBS J. 2010;277:3699–3714. doi: 10.1111/j.1742-4658.2010.07771.x. [DOI] [PMC free article] [PubMed] [Google Scholar]
- Stone JE, Gullingsrud J, Schulten K. Proceedings of the 2001 Symposium on Interactive 3D Graphics I3D ’01. New York: ACM Press; 2001. [Google Scholar]
- Sorensen TL, Moller JV, Nissen P. Phosphoryl transfer and calcium ion occlusion in the calcium pump. Science. 2004;304:1672–1675. doi: 10.1126/science.1099366. [DOI] [PubMed] [Google Scholar]
- Takamori S, Holt M, Stenius K, Lemke EA, Gronborg M, Riedel D, Urlaub H, Schenck S, Brugger B, Ringler P, et al. Molecular anatomy of a trafficking organelle. Cell. 2006;127:831–846. doi: 10.1016/j.cell.2006.10.030. [DOI] [PubMed] [Google Scholar]
- Tarini M, Cignoni P, Montani C. Ambient occlusion and edge cueing for enhancing real time molecular visualization. IEEE Transactions on Visualization and Computer Graphics. 2006;12(5):1237–1244. doi: 10.1109/TVCG.2006.115. [DOI] [PubMed] [Google Scholar]
- Teeter MM. Water structure of a hydrophobic protein at atomic resolution: Pentagon rings of water molecules in crystals of crambin. Proc Natl Acad Sci USA. 1984;81:6014–6018. doi: 10.1073/pnas.81.19.6014. [DOI] [PMC free article] [PubMed] [Google Scholar]
- Tusnady GE, Dosztanyi Z, Simon I. Transmembrane proteins in the Protein Data Bank: identification and classification. Bioinformatics. 2004;20:2964–2972. doi: 10.1093/bioinformatics/bth340. [DOI] [PubMed] [Google Scholar]
- Tusnady GE, Dosztanyi Z, Simon I. PDB_TM: selection and membrane localization of transmembrane proteins in the protein data bank. Nucleic Acids Res. 2005;33:D275–278. doi: 10.1093/nar/gki002. [DOI] [PMC free article] [PubMed] [Google Scholar]
- Tusnady GE, Dosztanyi Z, Simon I. TMDET: web server for detecting transmembrane regions of proteins by using their 3D coordinates. Bioinformatics. 2005;21:1276–1277. doi: 10.1093/bioinformatics/bti121. [DOI] [PubMed] [Google Scholar]
- Vale RD. The Molecular Motor Toolbox for Intracellular Transport. Cell. 2003;112:467–480. doi: 10.1016/s0092-8674(03)00111-9. [DOI] [PubMed] [Google Scholar]
- Vale RD, Milligan RA. The way things move: looking under the hood of molecular motor proteins. Science. 2000;288:88–95. doi: 10.1126/science.288.5463.88. [DOI] [PubMed] [Google Scholar]
- Weber JR. ProteinShader: Illustrative Rendering of Macromolecules. BMC Structural Biology. 2009;9:19. doi: 10.1186/1472-6807-9-19. [DOI] [PMC free article] [PubMed] [Google Scholar]
- Wong H, Winn PJ, Mozziconacci J. A molecular model of chromatin organization and transcription: how a multi-RNA polymerase II machine transcribes and remodels the beta-globin locus during development. BioEssays. 2009;31:1357–1366. doi: 10.1002/bies.200900062. [DOI] [PubMed] [Google Scholar]
- Yuzawa S, Opatowsky Y, Zhang Z, Mandiyan V, Lax I, Schlessinger J. Structural basis for activation of the receptor tyrosine kinase KIT by stem cell factor. Cell. 2007;130:323–334. doi: 10.1016/j.cell.2007.05.055. [DOI] [PubMed] [Google Scholar]