

Abstract
Introduction
An [18F] labeled PET amyloid (Aβ) imaging agent could facilitate clinical evaluation of late-life cognitive impairment by providing an objective measure for Alzheimer’s disease (AD) pathology. Here we present the results of the first clinical trial with [18F]AV-45 (Florbetapir F 18).
Methods
An open-label, multicenter, brain imaging, metabolism and safety study of [18F]AV-45 was performed on 16 patients with Alzheimer’s disease (AD: MMSE 19.3 +/− 3.1; Age 75.8 +/− 9.2) and 16 cognitively healthy controls (HC: MMSE 29.8 +/− 0.45; Age 72.5 +/− 11.6 ). Dynamic PET imaging was performed over a period of approximately 90 minutes following 10 mCi injection of the tracer. Standard uptake values (SUV) and cortical to cerebellum SUV ratios (SUVR) were calculated. A simplified reference tissue method was used to generate distribution volume ratio (DVR) parametric maps in a subset of subjects
Results
Valid PET imaging data were available for 11 AD and 15 HC subjects [18F]AV-45 accumulated in cortical regions expected to be high in amyloid deposition (e.g., precuneus, frontal and temporal cortex) of AD patients; minimal accumulation of tracer was seen in cortical regions of HC subjects. The cortical to cerebellar SUVR values in AD patients showed continual substantial increases through 30 minutes post-administration, reaching a plateau within 50 minutes. The 10 minute period from 50–60 minutes post administration was taken as a representative sample for further analysis. The cortical average SUVR for this period was 1.67 +/− 0.175 for patients with AD vs. 1.25 +/− 0.177 for HC subjects. Spatially normalized DVRs generated from PET dynamic scans were highly correlated with SUVR (r= 0.58–0.88, p<0.005) and were significantly greater for AD patients than for HC subjects in cortical regions, but not in subcortical white matter or cerebellar regions.
There were no clinically significant changes in vital signs, ECG or laboratory values.
Conclusions
[18F]AV-45 was well tolerated and PET imaging showed significant discrimination between AD patients and HC subjects using either a parametric reference region method (DVR) or a simplified SUVR calculated from 10 minutes of scanning 50–60 minutes after [18F]AV-45 administration.
Keywords: Amyloid, PET, Alzheimer’s Disease, Dementia, Biomarkers, Aging, F-18
Introduction
Although the etiology of AD has not been established, converging evidence suggests that the amyloid-beta (Aβ) peptide plays an important role in AD pathogenesis (1). Plaques containing Aβ fibrils are found in the AD brain, and are a key component of the neuropathological criteria for autopsy-based confirmation of diagnosis (2,3). Immunological therapies that decrease amyloid deposition have been shown to stabilize or reverse cognitive deficits in transgenic mouse models of AD (4). Additionally, amyloid deposition is thought to precede cognitive symptoms in AD and thus, is a potential preclinical marker of disease (5). Thus, amyloid deposition is a major target for novel AD treatments currently in human trials.
However, these efforts have been hampered by the absence of reliable, noninvasive markers for brain amyloid load. A reliable biomarker could aid diagnosis by documenting the presence of disease-specific pathology, could be useful for following disease progression, evaluating the effects of therapy on disease progression, and for early (presymptomatic) identification of subjects at risk for developing AD. While CSF Aβ levels are reliably decreased in AD (6), CSF studies are inevitably indirect markers. Imaging techniques utilizing radiolabelled positron emission tomography (PET) tracers that bind to the aggregated Aβ peptides in amyloid plaques have the potential to directly assess relative brain amyloid plaque pathology. To date the most widely researched imaging approach has utilized the 11C-labeled PET tracer [N-methyl-]2-(4’-methylaminophenyl)-6-hydroxybenzothiazole (6-OH-BTA), also known as Pittsburgh compound B or PIB (7). Despite these encouraging results, the short half-life (20 minutes) of the 11C isotope may limit the utility of 11C-PIB as a tool for aiding in community-based diagnosis and therapeutic evaluation.
Since 18F has a radioactive half-life of 110 minutes, regional preparation and shipping of doses is possible, thereby reducing the cost and greatly increasing the number of potential imaging center users. Several 18F-labeled amyloid tracers have been successfully tested in clinical trials (8–10)) (Suppl. Figure 1). However, a ligand with faster kinetics was desired in order to enable shorter imaging procedures Alzheimer’s disease patients. [18F]AV-45 was selected from a series of agents as the tracer with the optimum kinetics and selectivity for amyloid plaques. (11) The present study was designed as a preliminary exploration of the brain imaging properties, pharmacokinetics (PK), and tolerability of [18F]AV-45 in elderly cognitively healthy subjects and in subjects with AD.
Methods and Materials
[18F]AV-45 (Florbetapir F 18) was studied at 3 sites– Johns Hopkins Hospital/Johns Hopkins University(JHU) (Baltimore, MD), The Memory Enhancement Center (MEC) (Eatontown, NJ), and Community Health Center (CHC) (North East, MD) –in cognitively healthy elderly control (HC) subjects and patients with AD.
Eligibility and Overall Study Design
[18F]AV-45 was studied in a total of 16 HC volunteers and 16 AD patients. Patients with AD had to be greater than 50 years of age and have a probable diagnosis of AD according to the NINCDS-ADRDA, with a Mini-Mental State Examination (MMSE) score between 10 and 24 inclusive. (12, 13) HC subjects had to be greater than 50 years of age, with no evidence of cognitive impairment by history and psychometric testing, and had to have an MMSE score of ≥ 29. Subjects who showed evidence of any other significant neurodegenerative or psychiatric disease on clinical examination or MRI, or clinically significant medical comorbidities that might pose a safety risk to the subject or interfere with interpretation of the scan were excluded from the study. Patients with AD could be on a stable dose (by investigator judgment: not in titration period, no change in medication being considered) of an acetylcholinesterase inhibitor, memantine, and/or Vitamin E. Patients who had ever participated in an experimental study with a treatment targeting amyloid (e.g., immunotherapy, secretase inhibitor, selective amyloid lowering agents) were excluded. All procedures were approved by the appropriate Institutional Review Board and all participants or an appropriate representative signed informed consent forms, consistent with established criteria (12).
Similar acquisition protocols were used at the three centers. All subjects received a single IV bolus of approximately 370 MBq or 10 mCi [18F]AV-45 and PET imaging began. Dynamic brain PET images were collected for a period of approximately 90 minutes. The PET scanners employed were GE Advance (PET only, at JHU), GE Discovery LS (PET/CT), at CHC and MEC, and the Discovery ST (PET/CT), at MEC). In addition plasma metabolite analysis was conducted using the method of Hilton, et al (14). For detailed PET, metabolite analysis and image acquisition procedures see supplementary information.
Radiosynthesis of [18F]AV-45
The doses of [18F]AV-45 were prepared individually on the day of administration at either the JHU cyclotron/radiochemistry lab or at the Avid radiochemistry lab (Philadelphia, PA) in accordance with the Avid Radiopharmaceuticals IND Master Batch Record and QC release criteria. Mean specific activity at the time of injection was 2021 +/− 1957 Ci/mmol.
Image Analysis
PET images for each subject were re-sliced (realigned) to create a mean image across all of the frames (individual acquisition time blocks). This image was normalized to Talairach space by SPM version 2. Each individual frame was then fitted to this normalized mean image. No partial volume correction was performed. In order to identify volumes of interest for analysis, images of 10 subjects were segmented to identify grey and white matter, cerebrospinal fluid and skull. Images from the first 10 min post-administration in the first 15 subjects were then analyzed, and high flow areas were determined and compared to the previously segmented grey matter dataset. Volumes of interest (VOI) were created in the high flow, grey matter regions of frontal, temporal, parietal, occipital, anterior cingulate, posterior cingulate, and precuneus cortical grey matter and counts were extracted. Standard uptake values (SUV) were then generated from the VOI for each time frame. SUV ratios were calculated using cerebellar grey matter as the primary reference region and centrum semiovale white matter as an alternative reference region.
Mathematical Kinetic Modeling (for DVR Measures)
In a subset of subjects (9 AD and 8 HC) for whom adequate MRI scans were available, Time Activity Curves (TACs) were presented as % ID and micro Ci/cc for kinetic analyses. A parametric mapping approach employing the cerebellum as a reference region (15) was used to calculate distribution/volume ratios (DVR). (16)
Whole Body Imaging and Dosimetry Estimation
Because this was an exploratory, first in humans study, brain imaging in four healthy subjects was interrupted and whole body scans were performed for preliminary dosimetry estimation from approximately 20 to 45 minutes post dose and again from approximately 160 to 185 minutes post dose. One subject’s data was not available due to technical problems with image retrieval. Data were fit using the SAAM II software (17). Time integrals of activity (18) were entered into the OLINDA/EXM software (19) using the adult male model. Urinary and intestinal tract excretion data were treated with the OLINDA/EXM urinary bladder and ICRP 30 GI tract model.
Results
Subjects
Thirty-two (32) subjects were injected with the imaging agent (16 elderly HC subjects and 16 AD patients). Baseline characteristics are summarized in Table 1. The first human study worldwide was carried out at Johns Hopkins University on June 8, 2007.
Table 1.
Demographics: All Subjects, All 3 Centers
| AD Patients | HC Subjects | |
|---|---|---|
| N | 16 | 16 |
| Age (years) | 75.8 +/− 9.2 | 72.5 +/− 11.6 |
| MMSE* | 19.3 +/− 3.1 | 29.8 +/− 0.5 |
| Weight ( kg.) | 75.4 +/− 20 | 82.0 +/− 15 |
| Gender (M/F) | 8/8 | 10/6 |
| College Education | 12/16 (75%) | 12/16 (75%) |
| Duration Symptoms (months) | 70.6 +/− 35 | 0 |
MMSE scores for AD patients vs. HC subjects were significantly different by simple 2-tailed t-test, p < 0.001.
Abbreviations: AD: Alzheimer’s disease; HC: Healthy control.
The mean radioactivity injected was 10.3 +/− 1.11 mCi in the AD patients and 9.7 +/− 1.1 mCi in the HC subjects. As would be expected, the baseline average MMSE was lower in the AD patients than in the HC subjects (19.1 +/− 3.1 vs. 29.8 +/− 0.45). The AD and HC groups were similar in age, weight, and education. There was a slightly higher proportion of males in the HC than in the AD group (10/16 vs 8/16, respectively). Despite the mass dose range (0.56 – 9.1 μg), there was no correlation with SUVR for AD, HC or combined.
All of the elderly HC subjects and 15 of 16 (94%) AD subjects completed the study. One (1) AD subject (6.3%) withdrew consent after five minutes in the scanner. All subjects who received [18F]AV-45 for injection were included in the safety analysis. Efficacy analyses were performed for subjects who had PET scan imaging for at least 10 minutes and had no significant imaging technical failures. Imaging technical failures occurred in 5 subjects. Four (4) of the 5 technical failures occurred in AD patients who exhibited poor placement and/or excessive movement while in the scanner, which limited proper attenuation correction and quantification of the results. For the 5th subject, operational difficulties with the scanner precluded reconstruction of the data, and no usable images were obtained from the scanner. Thus, valid data for the evaluable population were available for a total of 15 HC subjects and 11 AD patients.
Imaging Results
Figure 1 shows a typical image from an AD patient and an HC subject. These images were averaged across two, 5 minute frames beginning 50 minutes following IV administration of [18F]AV-45. These images are shown here as count ratio (SUVR) images; each voxel was divided by the average number of counts per voxel in the cerebellar grey matter.
Figure 1.

Representative [18F]AV-45 PET images. Average of two consecutive 5 minute PET brain images (obtained 50 – 60 minutes post injection) from a 77 year old female mild AD patient with an MMSE of 24 (top) and an 82 year old male cognitively healthy control with an MMSE of 30 (bottom), following injection with 10 mCi [18F]AV-45. Experimental conditions and imaging and computational parameters were identical for the two subjects. Counts are shown as ratio to the average of the grey matter in cerebellum for each subject (SUVR).
In the AD patient, accumulation of tracer can be seen in cortical target areas such as the frontal cortex, temporal cortex and precuneus, areas expected to be high in amyloid deposition. In contrast, the HC subject shows tracer accumulation predominantly in white matter areas. Similar results were obtained for most of the other AD patients and HC subjects.
Figure 2 illustrates the average [18F]AV-45 time activity relationship (SUV units) from 0–90 min post dose for AD patients and HC subjects. [18F]AV-45 was rapidly distributed to the brain of both AD patients and HC subjects. The tracer was rapidly cleared from the cerebellum (nontarget/reference) VOI of both AD patients and HC subjects, but was selectively retained in cortical target regions, particularly the precuneus, of the AD patients.
Figure 2.

Mean time activity curves. Mean Precuneus, Cortical Average and Cerebellum Standard Uptake Values (SUV) are shown for cognitively healthy controls (HC, left panel) and patients with Alzheimer’s disease (AD, right panel). Subjects were scanned for approximately 90 minutes (horizontal axis represents the beginning of each imaging time point, e.g., 80–90 min)
Figure 3 shows the average cortical to cerebellum SUV ratio (SUVR) for AD patients and HC subjects for the 0–90 min period. Cortical average SUVRs relative to the cerebellum were higher in AD patients compared with those of HC subjects. The average cortical to cerebellar SUVR values in AD patients show continual substantial increases from time zero through 30 minutes post-administration, with only small changes thereafter, essentially reaching an asymptote by 40 to 50 minutes post injection. SUVRs in both AD patients and HC subjects were relatively constant between 45 and 90 minutes. Thus, the 10 minute period from 50–60 minutes was taken as a representative sample for the asymptotic period.
Figure 3.
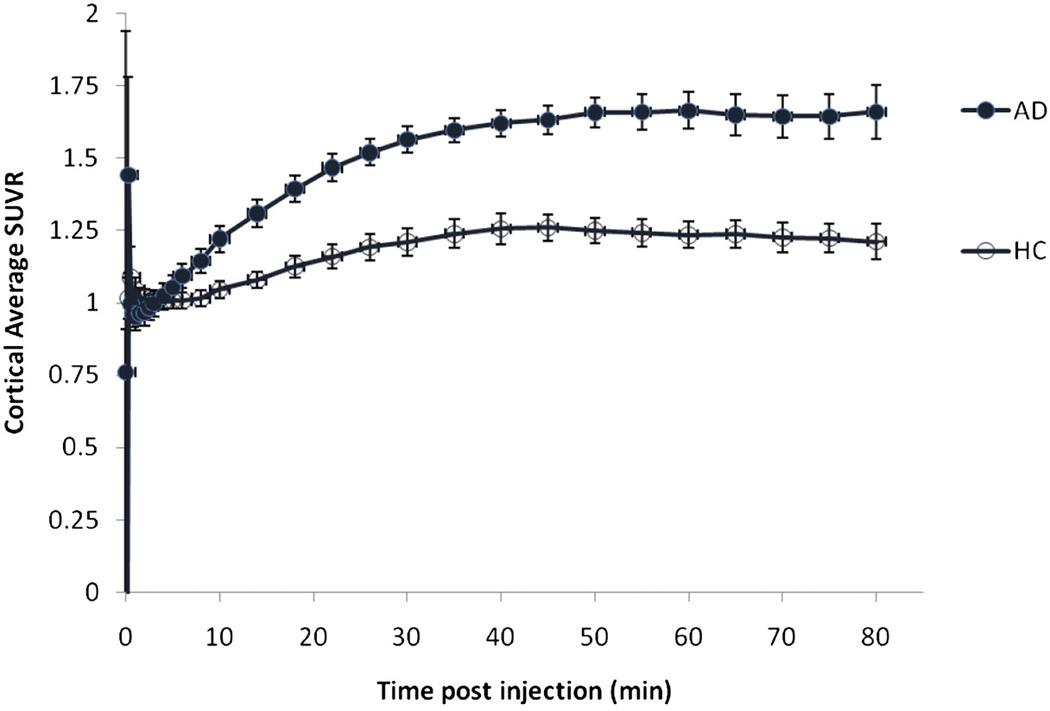
Mean cortical average SUVR for cognitively healthy controls (HC) and patients with Alzheimer’s disease (AD). As would be expected from the SUV time activity curves (Figure 2), the cortical target to cerebellum SUVRs for both AD patients and HC subjects approached asymptote at 50 minutes and remained essentially unchanged between 50 and 90 minutes post injection of [18F]AV-45. Subjects were scanned for approximately 90 minutes (horizontal axis represents the beginning of each imaging time point, e.g., 80–90 min).
Table 2 shows mean the SUVRs by cortical region for the 50–60 min time frame. The difference in tracer retention between patients with AD patients and HC subjects was greatest in the precuneus; SUVRs relative to the cerebellum were 1.86 +/− 0.24 and 1.31 +/− 0.27 for AD patients and HC subjects, respectively. In contrast, only a small, relatively inconsistent elevation in tracer retention was observed in the occipital cortex of AD patients. The overall cortical average SUVRs relative to the cerebellum were 1.67 +/− 0.18 and 1.25 +/− 0.18 for AD patients and HC subjects, respectively. For both AD patients and HC subjects, SUVRs relative to the centrum semiovale were lower than SUVRs relative to the cerebellum, but the pattern of separation between AD patients and HC subjects was similar to that seen with the cerebellar reference region.
Table 2.
Ratios of Standard Uptake Values (SUV) of Cortical Brain Region Relative to Cerebellum and to Centrum Semiovale for the 50–60 Minute Block – Evaluable Population
| SUVR 50–60 Minute Block (mean +/− SD) | ||||
|---|---|---|---|---|
| Relative to Cerebellum | Relative to Centrum Semiovale | |||
| Region | AD Patients | HC Subjects | AD Patients | HC Subjects |
| n=11 | n=15 | n=11 | n=15 | |
| Frontal Cortex | 1.67±0.21 | 1.20±0.30 | 1.13±0.29 | 0.68±0.24 |
| Temporal Cortex | 1.77±0.20 | 1.31±0.20 | 1.18±0.24 | 0.74±0.20 |
| Parietal Cortex | 1.57±0.27 | 1.17±0.19 | 1.05±0.26 | 0.67±0.17 |
| Anterior Cingulate | 1.79±0.3 | 1.30±0.31 | 1.19±0.28 | 0.74±0.26 |
| Posterior Cingulate | 1.65±0.19 | 1.31±0.21 | 1.11±0.27 | 0.74±0.13 |
| Precuneus | 1.85±0.24 | 1.30±0.27 | 1.25±0.37 | 0.74±0.23 |
| Occipital Cortex | 1.36±0.26 | 1.13±0.13 | 0.92±0.27 | 0.64±0.13 |
| Cortical Average | 1.67±0.18 | 1.25±0.18 | 1.12±0.26 | 0.71±0.18 |
Abbreviations: AD: Alzheimer’s disease; HC: Healthy control; SD: standard deviation.
Figure 4 shows the precuneus and cortical average SUVRs for the 50–60 minute timeframe for individual AD patients and HC subjects. Most of the HC values were below the range seen in the AD patients, regardless of subject age. However, in 2 HC subjects over 80 years of age, levels of tracer uptake were similar to that in AD patients, and 2 other HC subjects over 80 showed borderline high tracer uptake, particularly in the precuneus. Although none of the AD patients had cortical average SUVRs in the HC range, one subject did have relatively low levels of [18F]AV-45 binding in the frontal cortex (not shown) and precuneus. Interestingly, this patient had an atypical presentation, including prominent behavior symptoms, gait disturbance, mild cogwheeling and treatment for Parkinsonism.
Figure 4.

Precuneus (left panel) and cortical average (right panel) SUVR relative to cerebellum for individual AD patients and cognitively healthy controls for all 3 imaging sites.
Comparison of SUVR vs DVR
DVRs were measured in multiple brain regions for a subset of the subjects Across all centers, the DVR values for individual patients were highly correlated with the corresponding regional SUVR for all regions tested (Spearman’s ρ ranged from 0.58 for the occipital cortex to 0.88 for temporal cortex, p<0.01 in all cases
Radiolabeled Metabolite Analysis of [18F]AV-45
After an injection of [18F]AV-45, the total radioactivity in plasma and the fraction of plasma radioactivity accounted for by [18F]AV-45 was rapidly reduced. Plasma radioactivity was decreased by approximately 80% within 10 min and by approximately 90% within 20 min of injection. In addition to the parent, [18F]AV-45, three metabolite peaks were observed. These peaks were matched to cold reference standards and identified as [18F]AV-160 (desmethyl-[18F]AV-45), [18F]AV-267 (N-acetyl–[18F]AV-160), and an [18F]-Polar species, the identity of which has not been confirmed
See supplementary data for further results pertaining to DVR and SUVR relationships, metabolite analysis, radiation dosimetry and safety.
Whole Body Radiation Dosimetry
Although the number of subjects and whole body imaging time points was too few to provide definitive quantitative estimates of radiation dosimetry, preliminary results revealed no unexpected accumulation of tracer. The organs of excretion, particularly gallbladder, liver, intestines and urinary bladder received the greatest exposure.
Discussion
Sixteen (16) AD patients and 16 elderly HC subjects received [18F]AV-45, with usable imaging data for a total of 11 AD patients and 15 HC subjects . AD patients showed accumulation of [18F]AV-45 in grey matter cortical target areas expected to be high in amyloid deposition, such as the frontal cortex, temporal cortex and. Less consistent tracer accumulation was seen in the occipital cortex where amyloid deposition is thought to occur variably and later in the course of the disease. In contrast, HC subjects showed minimal tracer accumulation, predominantly in white matter areas. This pattern is similar to that previously reported for 11C-PIB (20,21) and [18F]BAY 94–9172 (9).
The highest SUVRs were observed in the precuneus of AD patients and the greatest difference between [18F]AV-45 activity in AD patients compared with HC subjects was observed in the precuneus and in the temporal cortex. This is consistent with the known localization of amyloid in these areas in post-mortem tissue (22), with recent literature suggesting the precuneus is involved in integrative functions including visual spatial coordination and working memory retrieval (23), and with results from other amyloid radiotracers (9, 24).
The brain kinetics for [18F]AV-45 also appear to be similar to those for [11C]PIB, but faster than those for other [18F]-labeled amyloid imaging agents such as [18F]BAY 94–9172 and [18F]GE-067. The SUV time activity curves for AD patients (but not HC subjects) showed a clear separation between cortical and cerebellar activity beginning around thirty minutes post injection. The average cortical to cerebellar SUVR values, as well as the average cortical to centrum semiovale SUVR values in AD patients showed continual substantial increases from time zero through 30 minutes post-administration, with only small changes thereafter, reaching a plateau by 40 to 50 minutes post injection, and remaining stable until at least 90 minutes post injection. In contrast, other [18F]-labeled amyloid imaging agents appear not to reach asymptote until 90 min or more post administration (9, 10). The present data suggest that short imaging times (5 to 10 minutes duration) conducted less than an hour after administration of [18F]AV-45 will be feasible for routine clinical use.
Although there were clear differences in mean cortical to cerebellar SUVR for AD patients vs. HC subjects, 2 of 15 HC subjects (13%) showed a pattern of tracer uptake similar to that in AD patients, and 2 other HC subjects showed borderline high tracer uptake, particularly in the precuneus. Mintun et al. (21) similarly observed AD-like uptake in 10% of control subjects and borderline high uptake in another 10% of control subjects imaged with [11C]PIB. The present findings are also consistent with literature reports suggesting that 13–45% of cognitively normal subjects have significant amyloid pathology at autopsy (25, 26, 27, 28). Mintun et al. (21) argued that elevated retention of PET amyloid imaging agents in otherwise cognitively normal elderly subjects might reflect preclinical AD pathological changes. However, longitudinal studies will ultimately be required to determine the significance of such findings for both [11C]PIB and [18F]AV-45.
Although none of the AD patients had cortical average SUVRs in the HC range, one presumed AD patient had a HC subject-like pattern of tracer uptake, particularly in the frontal cortex and precuneus. Interestingly, this patient had an unusual presentation, including prominent behavior symptoms, gait disturbance, mild cogwheeling and treatment for parkinsonism. These symptoms, together with the limited tracer uptake, may point to an alternative or additional etiology for the patient’s cognitive decline. On the other hand, although this presumed AD patient has an arguably atypical presentation, it would not be not unexpected to find low [18F]AV-45 binding/low amyloid burden in some clinically diagnosed AD patients, even with more typical presentations. Literature reports suggest that approximately 10–20% of patients diagnosed as having probable AD may fail to meet pathological criteria for AD at autopsy (29,30,31,32).
In order to test the validity of the SUVR analysis used for the present study, DVRs were measured in all brain regions for a subset of the subjects using an analogous but independent set of VOIs and a more sophisticated mathematical modeling approach previously described by Zhou et al (14). This approach has been successfully employed with [11C]PIB and has been useful in demonstrating subtle differences associated with mild cognitive impairment (MCI) (15). Despite the fact that slightly different VOIs were considered in the two approaches (the original Zhou et al. VOIs were used for the DVR analysis), the results from the DVR analysis were consistent and highly correlated with the results of the SUVR analysis. (See Table 3 and Suppl. Figures 2 and 3) DVRs in AD patients were significantly elevated in comparison to DVRs in HC subjects. Thus, both standard SUVRs during the representative imaging period (50–60 minutes post dose) as well as dynamic parametric mapping methods showed significant elevations in [18F]AV-45 in a number of brain regions of AD patients by comparison to HC subjects. These findings provide strong cross validation for the methods and results (and the VOIs) obtained via the SUVR analysis. In our companion paper, we (Rosenberg, et al, 2009, in preparation) will report on the relationship between behavioral and neuropsychological measures and [18F]AV-45 for both SUVs and some DVR measures.
Table 3.
Average and Standard Deviations of the Distribution volume ratios (DVR) in AD patients and HC subjects; JHU dataset only.
| AD Patients | HC Subjects | |||
|---|---|---|---|---|
| Regions | Average | SD | Average | SD |
| Frontal ** | 1.41 | 0.17 | 1.14 | 0.21 |
| Temporal ** | 1.37 | 0.13 | 1.14 | 0.12 |
| Parietal ¥ | 1.42 | 0.20 | 1.20 | 0.13 |
| Occipital ¥ | 1.31 | 0.20 | 1.09 | 0.12 |
| Fusiform Gyrus ** | 1.17 | 0.11 | 1.01 | 0.07 |
| Cingulate ** | 1.55 | 0.15 | 1.25 | 0.23 |
| Pons | 1.47 | 0.11 | 1.51 | 0.09 |
| Parahippocampus ¥ | 1.16 | 0.11 | 1.04 | 0.07 |
| Hippocampus | 1.09 | 0.17 | 1.06 | 0.07 |
| Insula ** | 1.41 | 0.15 | 1.16 | 0.17 |
| Putamen ¥ | 1.60 | 0.18 | 1.39 | 0.16 |
| Caudate Nucleus ¥ | 1.38 | 0.21 | 1.15 | 0.21 |
| Thalamus | 1.35 | 0.19 | 1.35 | 0.12 |
By simple t-test (no corrections for multiple comparisons) AD DVR was significantly greater than HC DVR, p < 0.05
AD DVR greater than HC DVR, 0.1< p >0.05
Tracer plasma kinetics and metabolism was also examined in this study. (see supplementary info) Although brain SUVs reached a plateau at 50–60 minutes of around 20% (in non target tissue) to 40% of initial levels (in amyloid containing cortical tissue of AD patients), plasma radioactivity was reduced to less than 10% of the initial level by 20 minutes post injection (Suppl. Figure 4). Because of the rapid clearance of total radioactivity from plasma, it seems unlikely that plasma levels of radioactive metabolite could be high enough to account for the observed tracer activity in the brain. For additional discussion, see supplementary information.
[18F]AV-45 was shown to be well-tolerated in the population studied. (see supplementary info) There were no serious adverse events or clinically significant changes in laboratory or ECG parameters. Additionally, whole body imaging revealed no unexpected accumulation of tracer.
A weakness of the present study is that the number of subjects and whole body imaging time points was too few to provide definitive quantitative estimates of radiation dosimetry. However, a subsequent study evaluated whole body exposure for up to 6 hours following administration of [18F]-AV-45. A preliminary report (33) confirmed the present finding that the organs of excretion, particularly gallbladder, liver, intestines and urinary bladder received the greatest radiation exposure.
A second potential weakness of the study is that 6 of 32 planned subjects were not included in the primary analysis. Data from the first HC were lost due to PET scanner problems; 1 AD withdrew consent , and 4 of 16 AD exhibited significant movement during the 90 min scanning. Because this was a first study in humans, designed to evaluate the potential of [18F]AV-45 for future development, the decision was made to focus only on the 26 images that could be accurately quantified with minimal movement artifact and attenuation error. Upon visual examination, the images of the 4 excluded AD were not atypical; but accurate quantification of these images was precluded by potential attenuation error.
These imaging failures illustrate the need for a simple and brief acquisition procedure when imaging AD patients in a community setting. In the present study, scans averaged over a 10 minute period beginning 50 minutes post injection were sufficient to reliably distinguish [18F]AV-45 binding in AD patients from HC subjects in each of the relevant cortical areas (Table 2). Additionally, Figure 3 suggests that scans as short as 5 minutes in duration could be effective. Moreover, because AD and HC SUVR values appear stable between 40 and 90 minutes, an opportunity may exist to reposition and repeat a scan if a patient moves or technical error occurs during the initial 10 minute scan.
Conclusion
[18F]AV-45 (Florbetapir F 18) was shown in this first study in humans to be well-tolerated with no serious adverse events. The cortical target regions of subjects with AD had higher uptake of [18F]AV-45 (Florbetapir F 18) over time compared with cognitively-normal HC subjects. The greatest increase in [uptake occurred in the precuneus and temporal cortex of AD subjects compared with HC. Scans 50–60 minutes after injection, produced reliable imaging results. Given it has a relatively long radioactive half-life, relatively rapid kinetics (requiring a short post-dose waiting period and short imaging durations), and a relatively long, stable plateau period (providing flexibility regarding timing of the image), [18F]AV-45 (Florbetapir F 18) may be a robust imaging tool and potentially well suited for use as a biomarker for AD in large multicenter treatment and natural history (e.g. ADNI) trials as well as for imaging in community settings.
Supplementary Material
Acknowledgments
This study was supported in part by AVID Pharmaceuticals, Philadelphia, PA and for JHU cohort in part by NIH Grants K24DA000412 (DFW), MH078175 (DFW), AA012839 (DFW). The study was presented in part at the Society for Nuclear Medicine annual meeting in June 2008 and the World Congress of Molecular Imaging in July 2008. Special thanks to Joel Ross, MD and Steven Edsell, MD, principalinvestigators at the Memory Enhancement Center and the Community health center, respectively, Weiguo Ye, Mohab Alexander, Jeffery Galecki, Maria Thomas, Melanie Charlotte, and Cynthia Hawes for technical support and recruitment; Hiroto Kuwabara, MD, PhD, for assistance with the use of his data analysis software; and Olivier Rousset, PhD for scientific discussions. Thanks to M. Stabin, PhD, of Vanderbilt University for radiation dosimetry calculations.
Footnotes
Financial Disclosure: This work was performed under contract with Avid Radiopharmaceuticals Inc., Philadelphia, PA and was supported in part by NIH Grant K24DA000412, MH078175, AA012839, (DFW)
Additional Disclosures: JHU employees are also associated with phase III contracts (Pfizer, Lilly) with therapeutic AD drugs employing [18F]AV-45 as an outcome measure. No other financial disclosures for JHU employees.
A. D. Joshi, D. M. Skovronsky, and M. J. Pontecorvo are Avid employees. H. F. Kung is a scientific advisor and shareholder of Avid.
Reference List
- 1.Selkoe DJ. Defining molecular targets to prevent Alzheimer disease. Arch Neurol. 2005;62(2):192–195. doi: 10.1001/archneur.62.2.192. [DOI] [PubMed] [Google Scholar]
- 2.Hyman BT, Trojanowski JQ. Consensus recommendations for the postmortem diagnosis of Alzheimer disease from the National Institute on Aging and the Reagan Institute Working Group on diagnostic criteria for the neuropathological assessment of Alzheimer disease. J Neuropathol Exp Neurol. 1997;56(10):1095–1097. doi: 10.1097/00005072-199710000-00002. [DOI] [PubMed] [Google Scholar]
- 3.Mirra SS, Heyman A, McKeel D, et al. The Consortium to Establish a Registry for Alzheimer's Disease (CERAD). Part II. Standardization of the neuropathologic assessment of Alzheimer's disease. Neurology. 1991;41(4):479–486. doi: 10.1212/wnl.41.4.479. [DOI] [PubMed] [Google Scholar]
- 4.Hock C, Konietzko U, Streffer JR, et al. Antibodies against beta-amyloid slow cognitive decline in Alzheimer's disease. Neuron. 2003;38(4):547–554. doi: 10.1016/s0896-6273(03)00294-0. [DOI] [PubMed] [Google Scholar]
- 5.Pike KE, Savage G, Villemagne VL, et al. Beta-amyloid imaging and memory in non-demented individuals: evidence for preclinical Alzheimer's disease. Brain. 2007;130(Pt 11):2837–2844. doi: 10.1093/brain/awm238. [DOI] [PubMed] [Google Scholar]
- 6.Fagan AM, Roe CM, Xiong C, Mintun MA, Morris JC, Holtzman DM. Cerebrospinal fluid tau/beta-amyloid(42) ratio as a prediction of cognitive decline in nondemented older adults. Arch Neurol. 2007;64(3):343–349. doi: 10.1001/archneur.64.3.noc60123. [DOI] [PubMed] [Google Scholar]
- 7.Klunk WE, Wang Y, Huang GF, Debnath ML, Holt DP, Mathis CA. Uncharged thioflavin-T derivatives bind to amyloid-beta protein with high affinity and readily enter the brain. Life Sci. 2001;69(13):1471–1484. doi: 10.1016/s0024-3205(01)01232-2. [DOI] [PubMed] [Google Scholar]
- 8.Small GW, Kepe V, Ercoli LM, et al. PET of brain amyloid and tau in mild cognitive impairment. N Engl J Med. 2006;355(25):2652–2663. doi: 10.1056/NEJMoa054625. [DOI] [PubMed] [Google Scholar]
- 9.Rowe CC, Ackerman U, Browne W, et al. Imaging of amyloid beta in Alzheimer's disease with 18F-BAY94-9172, a novel PET tracer: proof of mechanism. Lancet Neurol. 2008;7(2):129–135. doi: 10.1016/S1474-4422(08)70001-2. [DOI] [PubMed] [Google Scholar]
- 10.Koole M, Lewis DM, Buckley C, et al. Whole-body biodistribution and radiation dosimetry of 18F-GE067: a radioligand for in vivo brain amyloid imaging. J Nucl Med. 2009;50(5):818–822. doi: 10.2967/jnumed.108.060756. [DOI] [PubMed] [Google Scholar]
- 11.Choi SR, Golding G, Zhuang Z-P, et al. Preclinical properties of 18F-AV-45: a PET imaging agent for Abeta plaques in theb brain. J.Nucl.Med. 2009 doi: 10.2967/jnumed.109.065284. (in press) [DOI] [PMC free article] [PubMed] [Google Scholar]
- 12.Research consent for cognitively impaired adults: recommendations for institutional review boards and investigators. Alzheimer Dis Assoc Disord. 2004;18(3):171–175. doi: 10.1097/01.wad.0000137520.23370.56. [DOI] [PubMed] [Google Scholar]
- 13.Folstein MF, Folstein SE, McHugh PR. "Mini-mental state". A practical method for grading the cognitive state of patients for the clinician. J Psychiatr Res. 1975;12(3):189–198. doi: 10.1016/0022-3956(75)90026-6. [DOI] [PubMed] [Google Scholar]
- 14.Hilton J, Yokoi F, Dannals RF, Ravert HT, Szabo Z, Wong DF. Column-switching HPLC for the analysis of plasma in PET imaging studies. Nucl Med Biol. 2000;27(6):627–630. doi: 10.1016/s0969-8051(00)00125-6. [DOI] [PubMed] [Google Scholar]
- 15.Zhou Y, Endres CJ, Brasic JR, Huang SC, Wong DF. Linear regression with spatial constraint to generate parametric images of ligand-receptor dynamic PET studies with a simplified reference tissue model. Neuroimage. 2003;18(4):975–989. doi: 10.1016/s1053-8119(03)00017-x. [DOI] [PubMed] [Google Scholar]
- 16.Zhou Y, Resnick SM, Ye W, et al. Using a reference tissue model with spatial constraint to quantify [11C]Pittsburgh compound B PET for early diagnosis of Alzheimer's disease. Neuroimage. 2007;36(2):298–312. doi: 10.1016/j.neuroimage.2007.03.004. [DOI] [PMC free article] [PubMed] [Google Scholar]
- 17.Foster D, Barret P. Developing and testing integrated multicompartment models to describe a single-input multiple-output study using the SAAM II software system. Proc. Sixth International Radiopharmaceutical Dosimetry Symposium, Oak Ridge Institute for Science and Education; 1998. [DOI] [PubMed] [Google Scholar]
- 18.Stabin MG, Siegel JA. Physical models and dose factors for use in internal dose assessment. Health Phys. 2003;85:294–310. doi: 10.1097/00004032-200309000-00006. [DOI] [PubMed] [Google Scholar]
- 19.Stabin MG, Sparks RB, Crowe E. OLINDA/EXM: The Second-Generation Personal Computer Software for Internal Dose Assessment in Nuclear Medicine. J.Nucl.Med. 2005;46:1023–1027. [PubMed] [Google Scholar]
- 20.Lopresti BJ, Klunk WE, Mathis CA, et al. Simplified quantification of Pittsburgh Compound B amyloid imaging PET studies: a comparative analysis. J Nucl Med. 2005;46(12):1959–1972. [PubMed] [Google Scholar]
- 21.Mintun MA, Larossa GN, Sheline YI, et al. [11C]PIB in a nondemented population: potential antecedent marker of Alzheimer disease. Neurology. 2006;67(3):446–452. doi: 10.1212/01.wnl.0000228230.26044.a4. [DOI] [PubMed] [Google Scholar]
- 22.Braak H, Braak E. Staging of Alzheimer-related cortical destruction. Int Psychogeriatr. 1997;9(Suppl 1):257–261. [PubMed] [Google Scholar]
- 23.Cavanna AE, Trimble MR. The precuneus: a review of its functional anatomy and behavioral correlates. Brain. 2006;129(Pt 3):564–583. doi: 10.1093/brain/awl004. [DOI] [PubMed] [Google Scholar]
- 24.Ziolko SK, Weissfeld LA, Klunk WE, et al. Evaluation of voxel-based methods for the statistical analysis of PIB PET amyloid imaging studies in Alzheimer's disease. Neuroimage. 2006;33(1):94–102. doi: 10.1016/j.neuroimage.2006.05.063. [DOI] [PubMed] [Google Scholar]
- 25.Schmitt FA, Davis DG, Wekstein DR, Smith CD, Ashford JW, Markesbery WR. "Preclinical" AD revisited: neuropathology of cognitively normal older adults. Neurology. 2000;55(3):370–376. doi: 10.1212/wnl.55.3.370. [DOI] [PubMed] [Google Scholar]
- 26.Price JL, Morris JC. Tangles and plaques in nondemented aging and "preclinical" Alzheimer's disease. Ann Neurol. 1999;45(3):358–368. doi: 10.1002/1531-8249(199903)45:3<358::aid-ana12>3.0.co;2-x. [DOI] [PubMed] [Google Scholar]
- 27.Knopman DS, Parisi JE, Salviati A, et al. Neuropathology of cognitively normal elderly. J Neuropathol Exp Neurol. 2003;62(11):1087–1095. doi: 10.1093/jnen/62.11.1087. [DOI] [PubMed] [Google Scholar]
- 28.Hulette CM, Welsh-Bohmer KA, Murray MG, Saunders AM, Mash DC, McIntyre LM. Neuropathological and neuropsychological changes in "normal" aging: evidence for preclinical Alzheimer disease in cognitively normal individuals. J Neuropathol Exp Neurol. 1998;57(12):1168–1174. doi: 10.1097/00005072-199812000-00009. [DOI] [PubMed] [Google Scholar]
- 29.Gearing M, Mirra SS, Hedreen JC, Sumi SM, Hansen LA, Heyman A. The Consortium to Establish a Registry for Alzheimer's Disease (CERAD). Part X. Neuropathology confirmation of the clinical diagnosis of Alzheimer's disease. Neurology. 1995;45(3 Pt 1):461–466. doi: 10.1212/wnl.45.3.461. [DOI] [PubMed] [Google Scholar]
- 30.Lim A, Tsuang D, Kukull W, et al. Clinico-neuropathological correlation of Alzheimer's disease in a community-based case series. J Am Geriatr Soc. 1999;47(5):564–569. doi: 10.1111/j.1532-5415.1999.tb02571.x. [DOI] [PubMed] [Google Scholar]
- 31.Mok W, Chow TW, Zheng L, Mack WJ, Miller C. Clinicopathological concordance of dementia diagnoses by community versus tertiary care clinicians. Am J Alzheimers Dis Other Demen. 2004;19(3):161–165. doi: 10.1177/153331750401900309. [DOI] [PMC free article] [PubMed] [Google Scholar]
- 32.Pearl GS. Diagnosis of Alzheimer's disease in a community hospital-based brain bank program. South Med J. 1997;90(7):720–722. doi: 10.1097/00007611-199707000-00013. [DOI] [PubMed] [Google Scholar]
- 33.Adler LP, Wolodzko J, Stabin M, McNelis T, Gammage LL, Joshi A. “Radiation Dosimetry of 18FAV-45 measured by PET/CT in humans”. Journal of Nuclear Medicine. 2008 May;Vol 49(Supplement 1):283. [Google Scholar]
Associated Data
This section collects any data citations, data availability statements, or supplementary materials included in this article.