

Mammalian cell cycle entry is controlled at the restriction point by a bistable and resettable switch, which is shown to emerge from a minimal gene circuit containing a mutual-inhibition feedback loop between Rb and E2F modules, coupled with a feed-forward loop between Myc and E2F modules.
Keywords: bistable switch, cell cycle checkpoint, design principle, Rb–E2F pathway, robustness
Abstract
Precise control of cell proliferation is fundamental to tissue homeostasis and differentiation. Mammalian cells commit to proliferation at the restriction point (R-point). It has long been recognized that the R-point is tightly regulated by the Rb–E2F signaling pathway. Our recent work has further demonstrated that this regulation is mediated by a bistable switch mechanism. Nevertheless, the essential regulatory features in the Rb–E2F pathway that create this switching property have not been defined. Here we analyzed a library of gene circuits comprising all possible link combinations in a simplified Rb–E2F network. We identified a minimal circuit that is able to generate robust, resettable bistability. This minimal circuit contains a feed-forward loop coupled with a mutual-inhibition feedback loop, which forms an AND-gate control of the E2F activation. Underscoring its importance, experimental disruption of this circuit abolishes maintenance of the activated E2F state, supporting its importance for the bistability of the Rb–E2F system. Our findings suggested basic design principles for the robust control of the bistable cell cycle entry at the R-point.
Introduction
The Rb–E2F pathway regulates the initiation of DNA replication and plays a critical role in cell proliferation (Nevins, 1992; La Thangue, 1994; Weinberg, 1995; Bartek et al, 1996; Dyson, 1998; Trimarchi and Lees, 2002; Attwooll et al, 2004). Its importance is further corroborated by findings that the RB–E2F pathway is deregulated in almost all cancer cells (Nevins, 2001; Weinberg, 2007). Recently, we have demonstrated experimentally that the Rb–E2F pathway controls the R-point by functioning as a bistable switch (Yao et al, 2008). This switch converts graded growth signals into an all-or-none activation of E2F. Once switched ON by strong growth stimulation, the hysteretic E2F activity remains ON even when the growth stimulation is diminished. This long-lasting E2F activity drives the completion of the cell cycle after the R-point (Yao et al, 2008).
Interestingly, the Rb–E2F bistable switch is resettable. That is, as far as the steady state is concerned, the final E2F level eventually returns to a monostable OFF state under a low-serum condition (Yao et al, 2008). This resettability is intrinsic to the Rb–E2F network and does not require downstream regulatory activities (Supplementary Figure S1, also see Supplementary information). This resettability of the Rb–E2F bistable switch is a steady-state property, which should not be confused with the temporal irreversibility of cell cycle progression after the R-point. Resettable bistable switches, by creating a wide hysteresis loop, can drive irreversible cellular processes in the temporal domain, as demonstrated previously on mitotic entry in frog eggs (Pomerening et al, 2003; Sha et al, 2003). The resettable bistability of the Rb–E2F switch provides a control mechanism for the cell growth response, which is disrupted by oncogenic lesions such as ablation of Rb family proteins (Dannenberg et al, 2000).
The resettable bistability of the Rb–E2F switch provides a mechanistic explanation of the R-point control of normal cell proliferation and quiescence (Yao et al, 2008). However, how does the Rb–E2F pathway generate such a switching property? Finding the answer could help us to better understand the control mechanism underlying cell cycle entry, which is likely conserved across various cell types while disrupted in most, if not all, cancer cells. To this end, mathematical models have been created to examine potential bistable mechanisms underlying the R-point control (Thron, 1997; Aguda and Tang, 1999; Hatzimanikatis et al, 1999; Qu et al, 2003; Novak and Tyson, 2004; Yao et al, 2008). However, these studies have not attempted to examine the essential regulatory features that create resettable bistability in mammalian cell cycle entry.
In this study, we modeled and identified the basic gene circuit underlying resettable Rb–E2F bistable switch by the criterion of robustness. Robustness is a property of a system to maintain its functionality against perturbations, such as cellular noise, genetic variation, and environmental changes (Kitano, 2004; Stelling et al, 2004). Biological systems often exhibit robustness as a fundamental characteristic (Barkai and Leibler, 1997; Alon et al, 1999; Little et al, 1999; von Dassow et al, 2000; Eldar et al, 2002; Rao et al, 2004; Feinerman et al, 2008; Wang et al, 2008; Krantz et al, 2009). The Rb–E2F bistable switch is also robustly observed under different cell culture conditions (Yao et al, 2008), consistent with its critical roles for the R-point control. Therefore, our starting hypothesis is that among all possible circuit combinations in the Rb–E2F network, the actual control circuit underlying the resettable bistability should be able to generate such switching property robustly.
By modeling all 768 possible gene circuits derived from a simplified Rb–E2F network, we identified a minimal circuit that is able to generate robust, resettable bistability. Consisting of a coupled positive-feedback loop and a feed-forward motif, this circuit exhibits resettable bistability against a wide range of parametric and structural perturbations. Its unique characteristics reveal basic design features of the Rb–E2F bistable switch, which is commonly disrupted in cancer development.
Results and discussion
Model simplification and construction
The Rb–E2F pathway is a complex signaling network (Figure 1A). It consists of intertwined transcriptional controls, kinase cascades, and microRNA regulations (Blagosklonny and Pardee, 2002; Sears and Nevins, 2002). To formulate a mathematically tractable system, we coarse-grained the system to reduce network complexity, while keeping its essential regulatory features. To this end, we combined redundant and overlapping cellular activities and collapsed linear signaling cascades (Figure 1). For example, all E2F activators (E2F1, 2, and 3) were combined into one node EE, and all Rb family proteins (Rb, p107, and p130) were combined into another node RP. The linear signaling cascade consisting of Ras, Myc and CycD/cdk4,6 was collapsed into the node MD; the cascade consisting of E2F and CycE/cdk2 was collapsed into the node EE. Overlapping links between collapsed network modules were also combined. For example, the two original activation links (from Myc to E2F1, 2, 3, and from Myc to cdc25A and CycE/cdk2) were combined into one link #7 (from MD to EE); the two mutual-inhibition loops (between Rb family proteins and E2F activators, and between p27 and CycE/cdk2) were combined into one mutual-inhibition loop between RP and EE (5–6) (Figure 1). This coarse-graining removed intermediate signaling steps, which could reduce accuracy of simulated temporal dynamics. It would not, however, significantly affect steady-state properties of the system (as seen in (Ma et al, 2006), also see ‘Time scale’ in Materials and methods). This result makes the coarse-graining suitable for our investigation of the bistability of the Rb–E2F switch (Figure 1C).
Figure 1.

The Rb–E2F network. (A) A detailed Rb–E2F signaling network (modified from Blagosklonny and Pardee, 2002; Sears and Nevins, 2002) that controls the G1/S transition of mammalian cell cycle. Gray-shaded ovals indicate overlapping or intermediate signaling activities to be lumped. Circled numbers indicate indexes of the regulatory links (Supplementary Table S1). (B) A simplified Rb–E2F network. Positive regulatory links are shown in green and negative regulatory links in red. Link indexes are the same as in (A). (C) The Rb–E2F bistable switch. Once the system at the quiescence state (E2F-OFF state) is stimulated beyond the R-point, it will stay at the proliferation state (E2F-ON state) even in the absence of continuous stimulation.
The coarse-graining resulted in a simplified network containing three nodes and ten links (Figure 1B and Supplementary Table S1). Each node represents the combined (post)transcriptional and (post)translational activities of the corresponding subnetwork (gray shaded in Figure 1A); each link represents the lumped, overlapping regulatory interactions between two neighboring nodes. The choice of the three-node simplification was mainly dictated by the structure of the Rb–E2F pathway, especially the locations at which network modules can be collapsed (containing linear links). In addition, the three-node simplification (one input node, one output node, and one regulatory node) achieved a balance between the needs to reduce network complexity and to maintain its essential regulatory properties. This balance is similarly noted in a recent study on adaptation networks (Ma et al, 2009).
Next, we constructed a library of 768 mathematical models that encompassed all possible link combinations in the simplified three-node Rb–E2F network (see Materials and methods). We also generated 20 000 parameter sets by randomly sampling parameter values within biologically feasible ranges (see Materials and methods). These random parameter sets served as surrogates of varying cellular activities across different cell types and cellular environments. We note that 20 000 parameter sets were sufficient to obtain convergent rankings of model robustness in our studies (Supplementary Table S2). Here, we define the robustness of a model by the number of parameter sets (of the 20 000 tested sets of parameters) that allow the model to generate desired switching characteristics.
The most robust bistable model consists of all four positive-feedback loops
As discussed earlier, the Rb–E2F switch exhibits two salient characteristics: bistability (conditions #1 & 2, Figure 2A inset) and resettability (condition #3, Figure 2A inset). First, we wished to identify regulatory functions that underlie robust bistability. Because the dynamics of E2F activation could vary among different cell types and growth conditions, we focused on qualitative aspects of bistability, and did not impose specific constraints on the location, width, and amplitude of bistable regions. That said, we tested and confirmed that applying these constraints (e.g., width of the bistable region) did not affect the model predictions (Supplementary Table S3). Each of the 768 gene circuits was analyzed against the same collection of 20 000 parameter sets. Many circuits were found able to generate bistability (Figure 2B and Supplementary Table S4A).
Figure 2.

Robust models for bistability and resettable bistability. (A) Identification of robust models in generating desired switching properties, at each combination of circuit design (Cn) and parameter set (Pn). Inset: constraints to identify switching properties. S, serum input; EEss, the steady-state level of EE. Red and green curves indicate EEss dose–responses simulated from initial conditions of quiescence and proliferation, respectively. See Materials and methods for details. (B) Matrix presentation of model robustness. Shown is the two-way clustering result of 768 gene circuits by 20 000 random parameter sets. Red and blue colors indicate positive and negative for bistability, respectively. (C) The most robust model for bistability, 2–3–5–6–7–9b. (D) Minimal models for bistability. (Left) Ranked distribution of the robustness of minimal models in generating bistability. (Right) The top 5 minimal models for bistability. The type of logic gate and the correspondingly regulated node are indicated under each circuit. See text for details. (E) Minimal models for resettable bistability. (Left) Ranked distribution of the robustness of minimal models in generating resettable bistability. (Right) The top 2 minimal models for resettable bistability. The type of logic gate, the type of involved positive feedback, and the correspondingly regulated node are indicated under each circuit. See text for details.
We found that the most robust circuit to generate bistability was 2–3–5–6–7–9b (Figure 2C; note that the input link #1 was omitted when referring to all gene circuits). This circuit contains all the four positive-feedback loops in the simplified Rb–E2F network (Figure 1B, dashed box). This result is consistent with the notion that involving multiple positive-feedback loops could boost robustness of bistable systems (Ferrell, 2008).
The gene circuit 2–3–5–6–7–9b generated bistability in 12 907 of the 20 000 random parameter sets (Supplementary Table S4A). However, only 10 of these 12 907 parameter sets required all the six links of 2–3–5–6–7–9b to create bistability; for the remaining 12 897 parameter sets, certain subcircuits (e.g., 3–5–6, 2–3–6, 2–7, 7–9b) were already sufficient for bistability (data not shown). Therefore, not all links in the circuit 2–3–5–6–7–9b were equally important for creating bistability.
Top minimal models for bistability consists of OR/NOR-gate-type positive feedbacks
To better understand the basic control mechanism underlying the Rb–E2F bistable switch, we searched for ‘minimal models’ that are able to generate bistability. At each of the 20 000 parameter sets, we identified corresponding minimal models that fulfill two criteria: (a) they are able to generate bistability; and (b) they do not contain non-essential links for such property. That is, if a circuit is a minimal model with one set of parameters, all of its included links would be essential, and none of its subcircuits would be able to generate bistability for the same parameter set. Note that the identification of minimal models is parameter dependent. For a given parameter set, there could be more than one minimal model. For example, as shown in Supplementary Table S5, three models (7–9a, 5–6–7–9b, and 3–5–6) can all serve as minimal models at the given parameter set to generate bistability. Also, a minimal model defined by one parameter set may not be ‘minimal’ under another parameter set. For example, one of the above-mentioned minimal models, 5–6–7–9b, can be further reduced to 7–9b at 5324 other parameter sets, while still being able to generate bistability (Supplementary Table S4B).
For the purpose of this study, we focus on the robust minimal models (i.e., those circuits that serve as minimal models with the largest numbers of tested parameter sets, Supplementary Table S4B). From this perspective, the most robust minimal model in generating bistability was 3–5–6. This circuit contains a positive-feedback loop between EE and RP (Figure 2D) and functions as a minimal model in generating bistability with 8351 of the 20 000 random parameter sets (Supplementary Table S4B). In addition to 3–5–6, three other minimal models (2–3–6, 2–7, 7–9b) were similarly robust in generating bistability. In contrast, all other minimal models had at least three-fold weaker robustness in generating bistability (Figure 2D and Supplementary Table S4B).
All the top four minimal models for bistability share one common feature: each model contains an OR/NOR-gate-type positive feedback loop (Figure 2D). For example, in the circuit 3–5–6, which contains a mutual-inhibition-type positive feedback loop between RP and EE, the synthesis rate of RP is  , or in the Boolean form: RP=MD NOR EE. In the circuit 2–3–6, which contains a positive-feedback loop between MD and EE, the synthesis rate of MD is
  , or MD=S OR EE.
Top minimal models for resettable bistability consists of AND-gate-type positive feedbacks
We next investigated whether the switching dynamics of the four minimal models identified above were resettable. That is, when the growth input is removed completely, the steady state of the system output EE should return to the OFF state (see constraint #3 in Figure 2A inset). The most robust minimal model for bistability, 3–5–6, performed poorly with this criterion. Among the 8351 bistable switches generated with this circuit (Supplementary Table S4B), only 12.4% were resettable. The other three robust minimal models for bistability (identified above) generated even smaller percentages of resettable bistable switches: 11.8% for 2–3–6; 6.3% for 2–7, and 3.4% for 7–9b.
We found that much fewer model choices in the Rb–E2F network were able to generate resettable bistability robustly (comparing Supplementary Table S6A with S4A). To better understand the basic control mechanism underlying the resettable bistability in the Rb–E2F network, we again searched for corresponding ‘minimal models’. At each of the tested 20 000 parameter sets, minimal models were identified that fulfill two criteria: (a) they are able to generate resettable bistability; and (b) they do not contain non-essential links for such property (i.e., none of their subcircuits would be able to generate resettable bistability given the same parameter set).
A circuit, 3–5–6–7, was found to be the most robust minimal model in generating resettable bistability. Among all model choices, this circuit served as a minimal model for resettable bistability with the largest number of tested parameter sets (Figure 2E, Supplementary Table S6B). The gene circuit 3–5–6–7 contains a positive-feedback loop coupled with a feed-forward loop, which forms an AND-gate control (between the link #7 and the positive-feedback loop 5–6) of the system output EE. Specifically, in this circuit, synthesis rate of EE is  , or in Boolean form: EE=MD AND (NOT RP). The second most robust minimal model to generate resettable bistability was 7–9a, which also contains an AND-gate control of EE (between the link #7 and the positive-feedback loop #9a, Figure 2E). This gene circuit 7–9a, however, was about two-fold less robust than 3–5–6–7 in creating resettable bistability (Figure 2E and Supplementary Table S6B).
Basic design principles underlie a robust Rb–E2F switch
Previous studies have demonstrated that positive feedback is a necessary condition for bistability (Gardner et al, 2000; Ferrell, 2002; Tyson et al, 2003; Ozbudak et al, 2004; Tan et al, 2009). The simplified Rb–E2F network contains four positive-feedback loops, 2–7, 2–3–6, 5–6, and 9 (9a/dominant link or 9b/additive link, Supplementary Table S1; Figure 1). Of all minimal models derived from these four positive feedback loops, only one minimal model (3–5–6–7), however, was robust in generating resettable bistability. What are the unique characteristics of this circuit?
First, we note that an AND-gate-type positive feedback loop is critical for the resettability of generated bistable switches. Although all OR/NOR-gate-based positive-feedback circuits in the Rb–E2F network could robustly create bistability (Figure 2D), most of the resulting switches were non-resettable. This poor resettability was due to the lack of a dominant control of system output EE by the input S. For example, in circuits 2–3–6 and 2–7 (Figure 2D), the OR-gate regulation of MD can be described by:
 |
When βMD is sufficiently large, once the positive feedback was established and EE reached a high level, removal of S would not shut OFF MD for the majority of parameter space. This would result in non-resettable bistability in EE. For this reason, we found that the most robust circuits for resettable bistable switches were all derived from the two AND-gate-type minimal models in the Rb–E2F network, 3–5–6–7 and 7–9a (Supplementary Figure S2). In both models, the system output EE is under an AND-gate regulation involving a dominant control of EE by the system input S, which facilitates the resettability of the generated bistable switches.
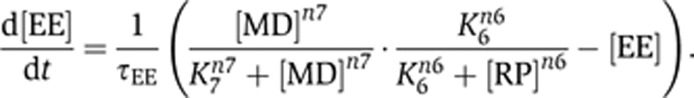
Second, we note that a mutual-inhibition-type positive feedback loop is critical for the robustness of the resettable bistability. This requirement is evident by comparing the circuits 3–5–6–7 and 7–9a. Both circuits contain an AND-gate regulation of the system output EE (between the link #7 and a positive-feedback loop), but the circuit 3–5–6–7 was much more robust than 7–9a in generating resettable bistability (Figure 2E). In the model 7–9a, a positive-feedback loop was created via EE auto-activation (link #9), and the activation rate of EE can be described as:
 |
In this case, the EE activation was dependent on a high level of EE itself, which however cannot reach a high level without first being activated. This dilemma limited the model robustness.
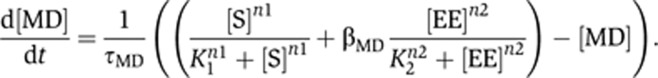
In contrast, the positive feedback in the model 3–5–6–7 was mediated by mutual inhibition (5–6), and the activation rate of EE can be described as:
 |
In this case, the EE activation can be easily achieved by reducing the level of RP through the link #3, which is one arm of the feed-forward motif (Figure 2E). Interestingly, this mutual-inhibition circuit structure (5–6) appears to be conserved in the regulatory network of the yeast Start point, where the same circuitry is implemented with non-homologous genes to generate a similar bistable switch (Charvin et al, 2010). This commonality makes sense given that this mutual-inhibition circuit generates robust bistability, which is necessary for the proper control of cell cycle entry.
Altogether, our analysis suggested that the unique circuit design of 3–5–6–7, containing both a mutual-inhibition-type positive feedback and an AND-gate control of the system output EE, is responsible for generating resettable bistability robustly against parameter variations. This unique circuit design may explain the basic regulatory features underlying the Rb–E2F bistable switch.
Disrupting the gene circuit 3–5–6–7 abolishes the Rb–E2F bistable switch
If the circuit 3–5–6–7 accounts for the origin of the Rb–E2F bistable switch, disruption of this circuit would abolish the corresponding switching properties. To test this hypothesis, we experimentally perturbed the circuit 3–5–6–7 by inhibiting the Cyclin E/Cdk2 activity (node EE, Figure 3A). This would block the mutual-inhibitionfeedback loop 5–6, which was predicted in above analysis to be essential for the Rb–E2F bistable switch.
Figure 3.

Experimental disruption of the gene circuit 3–5–6–7 abolishes the Rb–E2F bistable switch. (A) The Cdk2 inhibitor CVT-313 selectively blocks the mutual-inhibition feedback loop 5–6, but not the other three positive-feedback loops (9, 2–3–6, and 2–7). (B) Experimental protocol of serum-pulse stimulation and Cdk2 inhibition. At time 0, cells were serum-starved and at quiescence. See Materials and methods for details. (C) The influence of Cdk2 inhibition on E2F bistability. Each curve represents the histogram of the E2F–d2GFP distribution from approximately 5000 cells. The Cdk2 inhibitor dose and sample harvest time are as indicated. The dashed lines connecting the high and low E2F–d2GFP modes are for the guide of eyes.
In our experiment, we first fully turned ON the Rb–E2F bistable switch in cells. To this end, serum-starved, quiescent E2F–d2GFP reporter cells (see Materials and methods) were stimulated with a strong serum pulse (20% serum for 5 h, Figure 3B) that was sufficient to activate the Rb–E2F bistable switch in the majority of cell population (Yao et al, 2008). By the 5th hour, E2F began to accumulate while its level was still close to the OFF state (Figure 3C). Cells were then switched to a low-serum medium (0.3% serum). Because of the hysteresis associated with the Rb–E2F switch, E2F continued to accumulate even in the absence of strong serum stimulation, and reached its ON state in most cells by the 20th hour (Figure 3C).
We then tested whether disruption of the mutual-inhibition feedback loop 5–6 by inhibiting the Cyclin E/Cdk2 activity would affect E2F bistability. To this end, we utilized a small chemical inhibitor of Cdk2 (CVT-313, see Materials and methods). This inhibitor can specifically block the cyclin-dependent kinase activity of Cdk2 (with an IC50 of 430-fold lower than that for Cdk4; Brooks et al, 1997), and thus reduce the strength of the link #5 (Figure 3A). Increasing doses of Cdk2 inhibitor CVT-313 were added to the culture at the 20th hour, after E2F reached the ON state (Figure 3B). The maximum dose (5 μM) of CVT-313 applied in this experiment was still subtoxic to the E2F–d2GFP cells; it did not fully arrest cell proliferation even after 3 days under otherwise normal growth condition (data not shown).
In the absence of the Cdk2 inhibitor, E2F level at the 43rd hour still maintained at the ON state in the low-serum medium in most cells (which were isolated from downstream regulations by synchronizing at G2/M with nocodazole; Figure 3C). This result demonstrates the strong intrinsic bistability of the Rb–E2F switch with intact mutual-inhibition loop 5–6. With increasing doses of the Cdk2 inhibitor, E2F level in fewer and fewer cells could still maintain at the ON state under the same low-serum condition (Figure 3C). With 5 μM of the Cdk2 inhibitor, E2F level in the majority of cell population returned to the OFF-state. A similar result was also observed in cells treated with different serum-pulse stimulation but the same Cdk2 inhibition (Supplementary Figure S3). These results indicate that the disruption of the mutual-inhibition loop 5–6 by the Cdk2 inhibitor can indeed abolish the maintenance of E2F bistability.
Our results are consistent with the model prediction that the gene circuit 3–5–6–7 is essential for a functional Rb–E2F bistable switch. That is, when the mutual-inhibition loop 5–6 was blocked by inhibiting the Cyclin E/Cdk2 activity, although the other positive-feedback loops (2–7, 2–3–6, and 9, Figure 3A) were still present in the Rb–E2F network, they were not sufficient to sustain the E2F-ON state in the absence of growth stimulation. Our study also suggests that the Cyclin E/Cdk2 activity, instead of being required for a cell to reach the R-point (Ekholm et al, 2001; Martinsson et al, 2005), is necessary for maintaining the activated Rb–E2F bistable switch (and thus, temporally irreversible cell cycle progression after the R-point). In addition, our experimental results support the notion that the Rb–E2F bistable switch is intrinsically resettable. That is, besides inhibiting Cyclin E/Cdk2, the Cdk2 inhibitor also inhibited Cyclin A/Cdk2 (Brooks et al, 1997) and thus its negative feedback on E2F (Krek et al, 1994). In the absence of the Cyclin A/Cdk2 activity, the disruption of the mutual-inhibition loop 5–6 alone was sufficient to reset the E2F level to the OFF-state, demonstrating the intrinsic resettability of the Rb–E2F bistable switch.
The circuit 3–5–6–7 exhibits high structural flexibility
Finally, we found that the circuit 3–5–6–7 exhibited high structural flexibility in generating a resettable Rb–E2F bistable switch. Structural flexibility refers to the property of a system to maintain its functionality, despite alterations in its network topology (Kitano, 2004; Stelling et al, 2004). Here we defined topological neighbors of a gene circuit as those that can be obtained by one link addition or removal (Figure 4A). We then estimated the structural flexibility of a given gene circuit by the average robustness of its topological neighbors in creating a resettable Rb–E2F bistable switch.
Figure 4.

The gene circuit 3–5–6–7 exhibits high structural flexibility. (A) Structural flexibility of the gene circuit 3–5–6–7. Each direct topological neighbor of 3–5–6–7 is shown with its robustness (number in parentheses) in generating resettable bistability. (B) The correlation between structural flexibility (Y axis) and robustness (X axis) of all gene circuits in creating resettable bistability. (C) Top 10 models in structural flexibility. All models were derived from the same circuit 3–5–6–7, with corresponding link additions shown by the arrows. Number in parentheses indicates the structural flexibility of each model. Number above the oval node indicates the rank of structural flexibility. (D) Interconnected gene circuits derived from models 3–5–6–7 and 7–9a. Each node represents one gene circuit. Each edge connects direct topological neighbors (models with one-link variation). Shown in each graph are all gene circuits with up to two-link variations from the red-circled node (circuit 3–5–6–7 or 7–9a). The diameter of each node is proportional to the structural flexibility of the corresponding gene circuit. The layout of the nodes does not have specific meaning.
When we ranked the 768 gene circuits derived from the Rb–E2F network by their calculated structural flexibility (Supplementary Table S7), we found that there existed a tight correlation (ρ=0.87) between the structural flexibility of a given gene circuit to its robustness (against parameter variations) in generating resettable bistability (Figure 4B). This result makes intuitive sense, as certain structural alterations can be considered as extreme forms of parametric perturbations: e.g., removing a dominant activation link (e.g., link #7) is equivalent to setting the corresponding rate constant K to 0 (Table I).
Table 1. Mathematical models of the simplified Rb–E2F network.

|
We found that the circuit 3–5–6–7 and its derivatives held all the top ranks in structural flexibility (Figure 4C). In fact, gene circuits with one- or two-link variations from the circuit 3–5–6–7 formed an interconnected network that was highly enriched for gene circuits with strong structural flexibility (Figure 4D, comparing the 3–5–6–7-based versus 7–9a-based networks). This interconnected network of structurally flexible circuits could facilitate the system evolvability (Kirschner and Gerhart, 1998; de Visser et al, 2003; Little, 2010). That is, gene circuits responsible for the Rb–E2F switch may evolve continuously for new functionalities (with the additional or removal of regulatory links), while often still being able to maintain its essential property of resettable bistability. Although the specific evolutionary trajectory cannot be inferred by analyzing the formed Rb–E2F switch, the robustness of the system could aid in the initiation and maintenance of this desired property during evolution.
Conclusion
In this study, we sought to identify the basic gene circuit underlying the resettable Rb–E2F bistable switch, which controls mammalian cell cycle entry (Yao et al, 2008). To this end, we constructed and analyzed a library of mathematical models that encompassed all possible circuit designs derived from a simplified Rb–E2F network. We identified one minimal circuit that was uniquely robust in generating resettable bistability. This minimal circuit 3–5–6–7 consists of a mutual-inhibition feedback loop and a feed-forward motif, forming an AND-gate control of the system output E2F. Our analysis suggested that the feed-forward loop with an AND-gate control is critical for the resettability of the generated bistable switch, and the mutual-inhibition feedback loop is critical for parametric robustness of bistability. Consistently, constitutive Myc expression, which insulates the feed-forward loop from the extracellular growth signals, was found to inhibit cell cycle exit and cell differentiation (Bogenmann et al, 1995; Foley et al, 1998); targeted disruption of the mutual-inhibition feedback loop was found to abolish the bistability in the Rb–E2F network (Figure 3). This unique circuit topology of 3–5–6–7 also contributed to its strong structural flexibility in creating a resettable bistable switch, which could facilitate the system evolvability. Altogether, our study suggested that the gene circuit 3–5–6–7 primarily accounts for the origin of the resettable bistability in the Rb–E2F network for the proper R-point control. Consistent with this notion, the gene circuit 3–5–6–7 appears targeted and disrupted by frequent mutations in human cancers (e.g., loss of function of Rb and p16, and overexpression of CycD/cdk4, Supplementary Figure S4).
We identified the basic regulatory features underlying the resettable Rb–E2F bistable switch by the criterion of robustness. Biological systems, however, need to balance between robustness and other desired functionalities. In fact, the complete Rb–E2F network (Figure 1B) did not exhibit the highest robustness in creating resettable bistability against parameter variations. We suggest that the minimal gene circuit 3–5–6–7 defines the basic qualitative property of the Rb–E2F bistable switch. Additional regulatory activities could then perform quantitative fine-tuning of the bistability (e.g., the precise location, width, amplitude of its bistable region), the timing of its switching dynamics, or the introduction of other types of dynamic responses (O'Donnell et al, 2005; Qian and Cooper, 2008; Pickering et al, 2009; Lee et al, 2010; Wong et al, 2011). These regulatory links are likely systematically optimized to balance between precision and robustness, to create switching characteristics for the proper control of cell cycle entry in different cell types adapted in their specific growth environments.
Materials and methods
The ODE model library
Our simplified Rb–E2F network contains three nodes and ten regulatory links. All links were modeled using Michaelis–Menten-type functions. Non-dimensionalization was carried out to reduce the number of required parameters as in Ma et al (2006)—see Supplementary Table S10 for details. For example, considering a node A that is regulated by a positive auto-regulation, we have  . Let
. Let  ,
,  and
and  , we get
  . Similarly, all regulatory links have either the form An/(Kn+An) (positive regulation) or Kn/(Kn+An) (negative regulation), which can be described by two parameters (n and K) and one variable (A). Each link was modeled as either a dominant or an additive link based on its characteristic as described in the literature (please refer to Supplementary Table S1 for details).
To construct a model library comprising all link combinations in the simplified Rb–E2F network, each of the links #2–10 (between the node MD—receiver of the system input S, and the node EE—system output) could be either present or absent in a given model. In addition, link #9 had two possible forms when present, plus its absence form, resulting in a total of three states. Therefore, a total of 28*3=768 models were generated. See Table I for details of the models.
Parameters
A collection of 20 000 parameter sets was generated to test model robustness. Each parameter set contained a combination of 26 parameters: K1−10, n1−10, τMD, τRP, and τEE, βMD, βRP, and βEE (Table I). Parameters were uniformly sampled in log scale in the following ranges: K1−10, 0.01–1; n1−10, 1–10; τMD, τRP, and τEE, 0.2–20 (h); βMD, βRP, and βEE, 0.1–10. The parameter ranges were chosen based on previous modeling study on the Rb–E2F pathway (Yao et al, 2008). We also tested and confirmed that the choice of different parameter ranges did not affect the final result—e.g., when the range of K1−10 (102, 0.01–1) was further expanded to 104 (0.001–10), the same model 3–5–6–7 was identified as the most robust minimal model for resettable bistability (Supplementary Table S8).
Time scale
To test whether the network coarse-graining would affect the steady-state bistable behavior of the system, we focused on a specific case where more realistically, contradicting signs of regulations could act at different time scales on a given node (i.e., links #7 and #8 acting on MD, and links #9 and #10 acting on EE). To this end, 20 000 parameter sets were generated as above, but each with two additional parameters (τMDi and τEEi) that correspond to the half-life of a linker node (MDi or EEi) introduced in the middle of link #8 and link #10, respectively (Supplementary Table S12). Both added parameters were uniformly sampled in log scale in the range of 0.2–20 (h), which created variable time delays in the dynamics of link #8 and link #10 (in comparison with link #7 and link #9, respectively). Model simulations were repeated with this new collection of parameter sets, which resulted in the same top models for robust Rb–E2F bistable switch (Supplementary Table S9).
Simulation
For each model with a given parameter set, the EE steady state [EE]ss was simulated using 25 growth input levels [S] that were uniformly distributed in the log scale between 0.01 and 20 (percent of serum, covering the conditions from serum starvation to saturation; Figure 2A inset). At each growth input level, simulations were carried out using two initial conditions, corresponding to the quiescence state (EE-OFF: [EE]=[MD]=0.01, [RP]=11) and the proliferation state (EE-ON: [EE]=[MD]=11, [RP]=0.01). We note that the maximum possible value for the ON state of a node was 11 (Table I), and we assumed that the corresponding OFF-state value was over 1000-fold lower than the ON-state value. All simulations were carried out by using the deterministic LSODA method in the COPASI program (Hoops et al, 2006), with model simulation time of 1000 h to ensure that the system reaches steady state.
Determination of bistability and resettability
Three criteria were applied to identify the desired switching properties (Figure 2A inset).
Being a switch. [EE]ss-max−[EE]ss-min>λ. [EE]ss-max and [EE]ss-min denote the maximum and minimum values of the EE steady state simulated from the initial condition EE-OFF, respectively; λ=0.1.
Being bistable. Let Δ[EE]ss=[EE]ss(EE-ON)−[EE]ss(EE-OFF) as the difference between the two steady-state trajectories starting from the EE-ON and EE-OFF initial conditions. A model was considered bistable if Δ[EE]ss⩾([EE]ss-max−[EE]ss-min)*0.1 for at least two of the 25 input levels tested (except for the saturation level [S]max=20, where the system should be monostable), or Δ[EE]ss⩾([EE]ss-max−[EE]ss-min)*0.2 for at least one of the input levels above.
Being resettable. Δ[EE]ss → 0 when [S] → 0.
A model was considered as a bistable switch if criteria 1 and 2 were met, and it was considered as a resettable bistable switch if all the three criteria were met. Perl scripts, written ‘in-house,’ were used to implement the three criteria above, analyze simulation results, and identify the desired switching properties.
Minimal models
At a given parameter set, when multiple models can generate the desired switching behavior, the minimal models were identified by the criterion of ‘link essentiality’. In a minimal model, if any link was removed, the desired switching property would not hold. In a non-minimal model, at least one link could be removed without disrupting the desired switching property. See Supplementary Table S5 for an example. Perl scripts, written ‘in-house,’ were used to analyze simulation results and identify the corresponding minimal models at each parameter set.
GFP reporter cell line and Cdk2 inhibition
The E2F–d2GFP reporter cell line was derived from a single cell clone (#23) as described previously (Yao et al, 2008). Cells were regularly maintained in Dulbecco's Modified Eagle's Medium (DMEM; No. 31053, Gibco/Invitrogen) supplemented with 10% bovine growth serum (BGS, from Hyclone) and puromycin (1.0 μg/ml). In the Cdk2 inhibition experiment, cells were first synchronized at the quiescent state by serum starvation (0.02% BGS) for 2 days, then stimulated with high serum (20% BGS)-containing DMEM for 5 h. Following the serum pulse, cells were washed twice with DMEM and switched to low-serum (0.3% BGS) condition. The Cdk2 inhibitor CVT-313 (#238803, EMD/CalBiochem, San Diego, CA) was added to the medium at the 20th hour at indicated concentrations. Between the 20th and 43rd hour, cells were synchronized at the G2/M phase by nocodazole (0.1 μg/ml). Cells were harvested at indicated time points and subjected to flow cytometry.
Flow cytometry
For experiment overview and flow sample description, please see Results section (Disrupting the gene circuit 3–5–6–7 abolishes bistability) and Materials and methods section (GFP reporter cell line and Cdk2 inhibition) for details. Data were acquired using a Guava easyCyte 8HT Flow Cytometry System (#0500-4008, Millipore, Billerica, MA) unless otherwise noted. The light source to detect the GFP signal in samples was a 488 nm laser (75 mW), and the emission filter used was a 525 band-pass filter with a 30 nm band width. The signal height was digitalized. Raw data were output in FCS format and are available upon request. Data were analyzed using FlowJo analysis software (version 7.6.3) from Tree Star Inc. (Ashland, OR). No fluorescence compensation was performed.
Approximately 5000 gated cells were assayed at each test condition. Gating was performed by applying the ‘autogating tool’ (http://www.flowjo.com/v8/html/autogate.html) in FlowJo, onto the main cell population in the FSC × SSC (forward by side scattering) plot.
Supplementary Material
Supplementary Tables (S1-S12), Supplementary Figures (S1-S4)
Acknowledgments
We thank Joshua Socolar, Nicolas Buchler, Jeffrey Chang, and Tae Jun Lee for helpful discussions. This work was partially supported by the National Institutes of Health (1P50GM081883) and a David and Lucile Packard Fellowship (LY), Lane Fellowship (CT), and start-up support from the University of Arizona (GY).
Author contributions: GY and CT conceived the project. GY performed the mathematical modeling and experiments. CT assisted with modeling analysis. GY, CT, and LY interpreted the results. GY, LY, CT, JRN, and MW contributed to the writing and the revision of the manuscript.
Footnotes
The authors declare that they have no conflict of interest.
References
- Aguda BD, Tang Y (1999) The kinetic origins of the restriction point in the mammalian cell cycle. Cell Prolif 32: 321–335 [DOI] [PMC free article] [PubMed] [Google Scholar]
- Alon U, Surette MG, Barkai N, Leibler S (1999) Robustness in bacterial chemotaxis. Nature 397: 168–171 [DOI] [PubMed] [Google Scholar]
- Attwooll C, Lazzerini Denchi E, Helin K (2004) The E2F family: specific functions and overlapping interests. EMBO J 23: 4709–4716 [DOI] [PMC free article] [PubMed] [Google Scholar]
- Barkai N, Leibler S (1997) Robustness in simple biochemical networks. Nature 387: 913–917 [DOI] [PubMed] [Google Scholar]
- Bartek J, Bartkova J, Lukas J (1996) The retinoblastoma protein pathway and the restriction point. Curr Opin Cell Biol 8: 805–814 [DOI] [PubMed] [Google Scholar]
- Blagosklonny MV, Pardee AB (2002) The restriction point of the cell cycle. Cell Cycle 1: 103–110 [PubMed] [Google Scholar]
- Bogenmann E, Torres M, Matsushima H (1995) Constitutive N-myc gene expression inhibits trkA mediated neuronal differentiation. Oncogene 10: 1915–1925 [PubMed] [Google Scholar]
- Brooks EE, Gray NS, Joly A, Kerwar SS, Lum R, Mackman RL, Norman TC, Rosete J, Rowe M, Schow SR, Schultz PG, Wang X, Wick MM, Shiffman D (1997) CVT-313, a specific and potent inhibitor of CDK2 that prevents neointimal proliferation. J Biol Chem 272: 29207–29211 [DOI] [PubMed] [Google Scholar]
- Charvin G, Oikonomou C, Siggia ED, Cross FR (2010) Origin of irreversibility of cell cycle start in budding yeast. PLoS Biol 8: e1000284. [DOI] [PMC free article] [PubMed] [Google Scholar]
- Dannenberg JH, van Rossum A, Schuijff L, te Riele H (2000) Ablation of the retinoblastoma gene family deregulates G(1) control causing immortalization and increased cell turnover under growth-restricting conditions. Genes Dev 14: 3051–3064 [DOI] [PMC free article] [PubMed] [Google Scholar]
- de Visser JA, Hermisson J, Wagner GP, Ancel Meyers L, Bagheri-Chaichian H, Blanchard JL, Chao L, Cheverud JM, Elena SF, Fontana W, Gibson G, Hansen TF, Krakauer D, Lewontin RC, Ofria C, Rice SH, von Dassow G, Wagner A, Whitlock MC (2003) Perspective: evolution and detection of genetic robustness. Evolution 57: 1959–1972 [DOI] [PubMed] [Google Scholar]
- Dyson N (1998) The regulation of E2F by pRB-family proteins. Genes Dev 12: 2245–2262 [DOI] [PubMed] [Google Scholar]
- Ekholm SV, Zickert P, Reed SI, Zetterberg A (2001) Accumulation of cyclin E is not a prerequisite for passage through the restriction point. Mol Cell Biol 21: 3256–3265 [DOI] [PMC free article] [PubMed] [Google Scholar]
- Eldar A, Dorfman R, Weiss D, Ashe H, Shilo BZ, Barkai N (2002) Robustness of the BMP morphogen gradient in Drosophila embryonic patterning. Nature 419: 304–308 [DOI] [PubMed] [Google Scholar]
- Feinerman O, Veiga J, Dorfman JR, Germain RN, Altan-Bonnet G (2008) Variability and robustness in T cell activation from regulated heterogeneity in protein levels. Science 321: 1081–1084 [DOI] [PMC free article] [PubMed] [Google Scholar]
- Ferrell JE Jr (2002) Self-perpetuating states in signal transduction: positive feedback, double-negative feedback and bistability. Curr Opin Cell Biol 14: 140–148 [DOI] [PubMed] [Google Scholar]
- Ferrell JE Jr (2008) Feedback regulation of opposing enzymes generates robust, all-or-none bistable responses. Curr Biol 18: R244–R245 [DOI] [PMC free article] [PubMed] [Google Scholar]
- Foley KP, McArthur GA, Queva C, Hurlin PJ, Soriano P, Eisenman RN (1998) Targeted disruption of the MYC antagonist MAD1 inhibits cell cycle exit during granulocyte differentiation. EMBO J 17: 774–785 [DOI] [PMC free article] [PubMed] [Google Scholar]
- Gardner TS, Cantor CR, Collins JJ (2000) Construction of a genetic toggle switch in Escherichia coli. Nature 403: 339–342 [DOI] [PubMed] [Google Scholar]
- Hatzimanikatis V, Lee KH, Bailey JE (1999) A mathematical description of regulation of the G1-S transition of the mammalian cell cycle. Biotechnol Bioeng 65: 631–637 [DOI] [PubMed] [Google Scholar]
- Hoops S, Sahle S, Gauges R, Lee C, Pahle J, Simus N, Singhal M, Xu L, Mendes P, Kummer U (2006) COPASI—a COmplex PAthway SImulator. Bioinformatics 22: 3067–3074 [DOI] [PubMed] [Google Scholar]
- Kirschner M, Gerhart J (1998) Evolvability. Proc Natl Acad Sci USA 95: 8420–8427 [DOI] [PMC free article] [PubMed] [Google Scholar]
- Kitano H (2004) Biological robustness. Nat Rev Genet 5: 826–837 [DOI] [PubMed] [Google Scholar]
- Krantz M, Ahmadpour D, Ottosson LG, Warringer J, Waltermann C, Nordlander B, Klipp E, Blomberg A, Hohmann S, Kitano H (2009) Robustness and fragility in the yeast high osmolarity glycerol (HOG) signal-transduction pathway. Mol Syst Biol 5: 281. [DOI] [PMC free article] [PubMed] [Google Scholar]
- Krek W, Ewen ME, Shirodkar S, Arany Z, Kaelin WG Jr, Livingston DM (1994) Negative regulation of the growth-promoting transcription factor E2F-1 by a stably bound cyclin A-dependent protein kinase. Cell 78: 161–172 [DOI] [PubMed] [Google Scholar]
- La Thangue NB (1994) DRTF1/E2F: an expanding family of heterodimeric transcription factors implicated in cell-cycle control. Trends Biochem Sci 19: 108–114 [DOI] [PubMed] [Google Scholar]
- Lee T, Yao G, Bennett DC, Nevins JR, You L (2010) Stochastic E2F activation and reconciliation of phenomenological cell-cycle models. PLoS Biol 8: e1000488. [DOI] [PMC free article] [PubMed] [Google Scholar]
- Little JW (2010) Evolution of complex gene regulatory circuits by addition of refinements. Curr Biol 20: R724–R734 [DOI] [PubMed] [Google Scholar]
- Little JW, Shepley DP, Wert DW (1999) Robustness of a gene regulatory circuit. EMBO J 18: 4299–4307 [DOI] [PMC free article] [PubMed] [Google Scholar]
- Ma W, Lai L, Ouyang Q, Tang C (2006) Robustness and modular design of the Drosophila segment polarity network. Mol Syst Biol 2: 70. [DOI] [PMC free article] [PubMed] [Google Scholar]
- Ma W, Trusina A, El-Samad H, Lim WA, Tang C (2009) Defining network topologies that can achieve biochemical adaptation. Cell 138: 760–773 [DOI] [PMC free article] [PubMed] [Google Scholar]
- Martinsson HS, Starborg M, Erlandsson F, Zetterberg A (2005) Single cell analysis of G1 check points-the relationship between the restriction point and phosphorylation of pRb. Exp Cell Res 305: 383–391 [DOI] [PubMed] [Google Scholar]
- Nevins JR (1992) E2F: a link between the Rb tumor suppressor protein and viral oncoproteins. Science 258: 424–429 [DOI] [PubMed] [Google Scholar]
- Nevins JR (2001) The Rb/E2F pathway and cancer. Hum Mol Genet 10: 699–703 [DOI] [PubMed] [Google Scholar]
- Novak B, Tyson JJ (2004) A model for restriction point control of the mammalian cell cycle. J Theor Biol 230: 563–579 [DOI] [PubMed] [Google Scholar]
- O'Donnell KA, Wentzel EA, Zeller KI, Dang CV, Mendell JT (2005) c-Myc-regulated microRNAs modulate E2F1 expression. Nature 435: 839–843 [DOI] [PubMed] [Google Scholar]
- Ozbudak EM, Thattai M, Lim HN, Shraiman BI, Van Oudenaarden A (2004) Multistability in the lactose utilization network of Escherichia coli. Nature 427: 737–740 [DOI] [PubMed] [Google Scholar]
- Pickering MT, Stadler BM, Kowalik TF (2009) miR-17 and miR-20a temper an E2F1-induced G1 checkpoint to regulate cell cycle progression. Oncogene 28: 140–145 [DOI] [PMC free article] [PubMed] [Google Scholar]
- Pomerening JR, Sontag ED, Ferrell JE Jr (2003) Building a cell cycle oscillator: hysteresis and bistability in the activation of Cdc2. Nat Cell Biol 5: 346–351 [DOI] [PubMed] [Google Scholar]
- Qian H, Cooper JA (2008) Temporal cooperativity and sensitivity amplification in biological signal transduction. Biochemistry 47: 2211–2220 [DOI] [PubMed] [Google Scholar]
- Qu Z, MacLellan WR, Weiss JN (2003) Dynamics of the cell cycle: checkpoints, sizers, and timers. Biophys J 85: 3600–3611 [DOI] [PMC free article] [PubMed] [Google Scholar]
- Rao CV, Kirby JR, Arkin AP (2004) Design and diversity in bacterial chemotaxis: a comparative study in Escherichia coli and Bacillus subtilis. PLoS Biol 2: E49. [DOI] [PMC free article] [PubMed] [Google Scholar]
- Sears RC, Nevins JR (2002) Signaling networks that link cell proliferation and cell fate. J Biol Chem 277: 11617–11620 [DOI] [PubMed] [Google Scholar]
- Sha W, Moore J, Chen K, Lassaletta AD, Yi CS, Tyson JJ, Sible JC (2003) Hysteresis drives cell-cycle transitions in Xenopus laevis egg extracts. [see comment]. Proc Natl Acad Sci USA 100: 975–980 [DOI] [PMC free article] [PubMed] [Google Scholar]
- Stelling J, Sauer U, Szallasi Z, Doyle FJ III, Doyle J (2004) Robustness of cellular functions. Cell 118: 675–685 [DOI] [PubMed] [Google Scholar]
- Tan C, Marguet P, You L (2009) Emergent bistability by a growth-modulating positive feedback circuit. Nat Chem Biol 5: 842–848 [DOI] [PMC free article] [PubMed] [Google Scholar]
- Thron CD (1997) Bistable biochemical switching and the control of the events of the cell cycle. Oncogene 15: 317–325 [DOI] [PubMed] [Google Scholar]
- Trimarchi JM, Lees JA (2002) Sibling rivalry in the E2F family. Nat Rev Mol Cell Biol 3: 11–20 [DOI] [PubMed] [Google Scholar]
- Tyson JJ, Chen KC, Novak B (2003) Sniffers, buzzers, toggles and blinkers: dynamics of regulatory and signaling pathways in the cell. Curr Opin Cell Biol 15: 221–231 [DOI] [PubMed] [Google Scholar]
- von Dassow G, Meir E, Munro EM, Odell GM (2000) The segment polarity network is a robust developmental module. Nature 406: 188–192 [DOI] [PubMed] [Google Scholar]
- Wang J, Xu L, Wang E (2008) Potential landscape and flux framework of nonequilibrium networks: robustness, dissipation, and coherence of biochemical oscillations. Proc Natl Acad Sci USA 105: 12271–12276 [DOI] [PMC free article] [PubMed] [Google Scholar]
- Weinberg RA (1995) The retinoblastoma protein and cell cycle control. Cell 81: 323–330 [DOI] [PubMed] [Google Scholar]
- Weinberg RA (2007) The Biology of Cancer. New York: Garland Science [Google Scholar]
- Wong JV, Yao G, Nevins JR, You L (2011) Viral-mediated noisy gene expression reveals biphasic E2f1 response to MYC. Mol Cell 41: 275–285 [DOI] [PMC free article] [PubMed] [Google Scholar]
- Yao G, Lee TJ, Mori S, Nevins JR, You L (2008) A bistable Rb-E2F switch underlies the restriction point. Nat Cell Biol 10: 476–482 [DOI] [PubMed] [Google Scholar]
Associated Data
This section collects any data citations, data availability statements, or supplementary materials included in this article.
Supplementary Materials
Supplementary Tables (S1-S12), Supplementary Figures (S1-S4)