Abstract
The purpose of fetal magnetoencephalography (fMEG) is to record and analyze fetal brain activity. Unavoidably, these recordings consist of a complex mixture of bio-magnetic signals from both mother and fetus. The acquired data include biological signals that are related to maternal and fetal heart function as well as fetal gross body and breathing movements. Since fetal breathing generates a significant source of bio-magnetic interference during these recordings, the goal of this study was to identify and quantify the signatures pertaining to fetal breathing movements (FBM). The fMEG signals were captured using superconducting quantum interference devices (SQUIDs) The existence of FBM was verified and recorded concurrently by an ultrasound-based video technique. This simultaneous recording is challenging since SQUIDs are extremely sensitive to magnetic signals and highly susceptible to interference from electronic equipment. For each recording, an ultrasound-FBM (UFBM) signal was extracted by tracing the displacement of the boundary defined by the fetal thorax frame by frame. The start of each FBM was identified by using the peak points of the UFBM signal. The bio-magnetic signals associated with FBM were obtained by averaging the bio-magnetic signals time locked to the FBMs. The results showed the existence of a distinctive sinusoidal signal pattern of FBM in fMEG data.
Keywords: fetal breathing movement, bio-magnetic signal, fetal magnetoencephalography, ultrasound
1. Introduction
Magnetoencephalography (MEG) is widely used to study magnetic fields generated by the electrical activity of the human brain and can also be applied to fetal neurological health assessment (Lowery et al 2008, 2009). The fetal MEG (fMEG) signals are often contaminated with other bio-magnetic signals such as fetal heart, gross-body and fetal breathing movement (FBM). Prior to this study, the bio-magnetic characteristics of FBM had not been assessed. This lack of pertinent data limited the ability to attenuate FBM signals for data analysis of fMEG recordings.
In clinical studies, fetal movements are typically observed by ultrasonography, which shows FBMs as soft diaphragmatic movements characterized by the smooth periodic displacement of the thorax and abdomen. During pregnancy, gas exchange occurs between the placenta and fetus and therefore pulmonary respiration is not necessary for fetal survival. However, FBMs are an integrated part of the maturation of the respiratory system and essential for continuous breathing and gas exchange after the delivery. Unlike post-natal respiration, which is continuous, fetal breathing is usually observed as fast episodic movements with irregular amplitude and rate. Due to its intermittent nature, FBM acts as an interfering factor for fetal neurological signals acquired through fMEG (Soni et al 2007).
SARA (SQUID array for reproductive assessment) is an fMEG recording device that is installed at the University of Arkansas for Medical Sciences (UAMS). The 151 sensor array of superconducting quantum interference devices (SQUIDs) capture the bio-magnetic signal related to the electrophysiological activities of the fetus and the mother (Sternickel and Braginski 2006). The measurements are completely non-invasive and can offer high temporal signal resolution (in the range of milliseconds).
The primary objective of this study was to identify and quantify the signature of bio-magnetic signals corresponding to the FBMs in fMEG recordings. The existence of the FBM was verified by an ultrasound-based video technique. The simultaneous recording of fMEG and ultrasound data is challenging since SQUIDs are extremely sensitive to magnetic signals and highly susceptible to interference from electronic equipment. In this study, the interfering noise was minimized by using a battery-operated portable ultrasound device and a mechanical transducer holder. The following sections describe the noise elimination and signal-processing steps. Finally, the results demonstrate the existence of a distinctive FBM signal pattern in fMEG data.
2. Methodology
2.1. Noise estimation and elimination
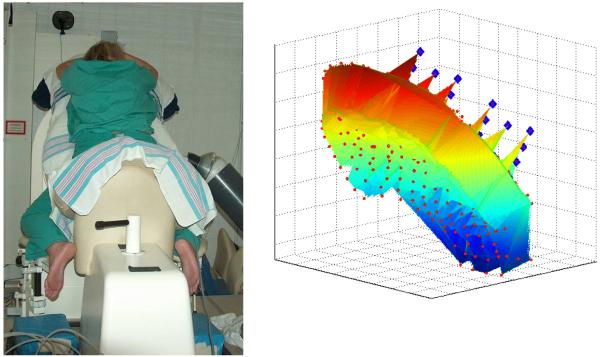
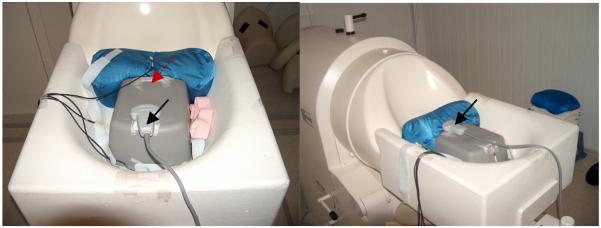
The ultrasound recordings of the FBMs were performed using the Sonosite 180 Plus portable ultrasound device (SonoSite, Inc., Bothell, WA). The magnetic noise measurements were made by using the SARA reference magnetometers (figure 1). The SARA system has 151 sensors spaced 3 cm apart from each other on a concave shaped surface that is 850 cm2 in area. This array covers the maternal abdomen from the pubic symphysis to the uterine fundus, and laterally from left kidney to right kidney. The study environment was isolated from external magnetic fields by the magnetically shielded room (Vacuumschmelze, Hanau, Germany). Typically, portable ultrasound devices have two major components: electronics box and transducer. For this study, magnetic field changes introduced by the transducer were measured in two different locations (Loc 1, 2) (figure 2). At each location the transducer was positioned in three orthogonal orientations: pointing toward Dewar lying flat, pointing left lying flat, and pointing left lying on the right side of the transducer (orientation 1, 2, and 3, respectively). For each location and orientation, three measurements of 1 s duration were recorded at a sampling rate of 312.5 Hz. In order to reduce the low-frequency interference the transducer was degaussed with a hand-held demagnetizer and experiments were repeated.
Figure 1.
The SARA device and the sensors. Left: SARA device, the mechanical arm and the mother during recording. Right: the SARA sensors. The red dots show the position of the pickup-coils of the 151 gradiometers and the blue diamonds close to the top right are the pickup-coils of the gradiometer and magnetometers used for reference channel noise cancellation.
Figure 2.
Left: locations 1 (top) and 2 (bottom) marked by the arrows. Right: ultrasound transducer at the first location directed toward the Dewar (orientation 1) marked by the arrow.
Each measurement was done according to the following procedure: initially the transducer was moved away from the magnetometers (farthest possible point inside the shielded room referred as base-point approximately three meters away from the SARA) and the magnetic field was measured. Then the transducer was moved to the location and positioned in a predefined orientation. The difference between the magnetic fields measured at the base point and the measurement location was assumed as the magnetic field created by the transducer at that location and orientation.
2.2. Data acquisition and processing
The overall system had three components: fMEG acquisition system, image acquisition system, and synchronization system. The fMEG signals were captured with the SARA device. NTSC output of the Sonosite 180 plus portable ultrasound device was connected to a Dazzle video creator platinum external USB video capture card to digitize and record ultrasound video. Video was saved in MPEG format with 30 frames per second and 640 × 480 pixel resolution. A third computer was used to create pulses that were used to precisely synchronize video recordings with fMEG measurements. Inter pulse interval (IPI) varied around 3 s with 0.5 s randomization (3 ± 0.5 s). Pulse delivery was controlled by the DOS operating system based STIM software (Neurosoft, EL Paso, TX). Pulses were recorded in the sound channel in the video recordings and a stimulus channel of the SARA recordings. Simultaneous ultrasound and fMEG recordings were obtained from two fetuses between 35 and 37 weeks of gestation. The study was explained to each mother and signed consent was obtained. None of them had any complication during pregnancy. The Institutional Review Board of UAMS approved the study. To hold the ultrasound transducer rigidly in a fixed location and orientation, the ultrasound transducer was attached to the non-magnetic mechanical arm and located on the right side of the mother at least 6 cm away from the nearest SQUID sensor. The duration of recordings was 30 min. Time-frequency analysis was performed using Stockwell transform (Stockwell et al 1996).
2.3. Post-signal processing
Post-signal processing was performed in two steps. The first step involved processing the ultrasound recordings. Each frame of the ultrasound recordings was filtered using the STICKS filter (Czerwinski et al 1999) for speckle noise elimination. The fetal thorax is a long continuous and smooth surface. A kernel size of 17 and thickness of 1 was chosen by visual inspection because it was short enough that it correlated well with the fetal thorax surface, introduced little blurring effect for the boundary, and eliminated much of the speckle noise. The fetal thorax boundary was enhanced using a horizontal Sobel filter. A filter size of 11 × 11 was chosen empirically. The subsequent frame was then converted to a binary image using a threshold value obtained by Otsu’s method (Otsu 1979). Outline of the fetal thorax was acquired using a four-connectivity boundary trace algorithm. The movement signal was extracted by tracing the displacement of 100 or more pixels on the boundary defined by the fetal thorax frame by frame. This provided a time series sampled at the video frame rate that represented the temporal behavior of the fetal thorax. Typically, this signal was contaminated with periodic maternal breathing artifact that was observed within the frequency band of 0.25–0.35 Hz. The ultrasound-FBM signal (UFBM) was obtained by filtering the time series using a fourth-order Butterworth band-pass filter with zero phase distortion and a pass band of 0.5–10 Hz. All image-processing steps were performed using Matlab 7.1 (Mathworks, Natick, MA).
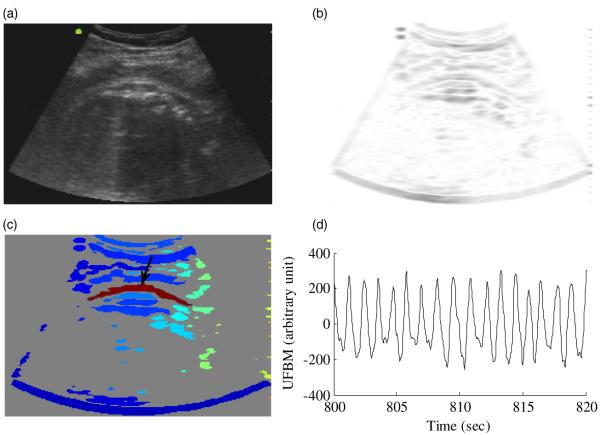
During the recordings the mother’s abdomen was covered by the sensors of the SARA device and the ultrasound transducer was placed on the left or right side of the mother close to her kidneys. Typically, visibility of the fetal thorax was limited. The described image-processing algorithm was used because it provided the possibility of observing FBMs in noisy ultrasound recordings even with partially observable fetal thorax. Figure 3(a) shows a single frame of the ultrasound recording obtained from subject 1. The same frame after speckle noise reduction and edge enhancement is shown in figure 3(b). The fetal thorax is highlighted with red in figure 3(c), and figure 3(d) shows the UFBM signal obtained after the filtering process.
Figure 3.
Image-processing steps. (a) Ultrasound image obtained from subject 1. (b) After speckle noise reduction and edge enhancement. (c) After boundary trace. The fetal thorax is highlighted with red. (d) Ultrasound-FBM (UFBM) signal obtained after the filtering process.
The second step was the fMEG signal processing. A third-order synthetic gradiometer noise cancellation (Vrba and Robinson 2001) was used to attenuate ultrasound interference. Maternal heartbeat R markers were identified with an adaptive Hilbert-based QRS detection algorithm (Ulusar et al 2009) using Matlab and placed in the fMEG data. The maternal heart signal was attenuated using the markers and the orthogonal projection technique (Vrba et al 2004). The cardiac signal space vectors are derived from the averaged signals resulting in minimal remaining interference to contaminate the vectors. This method has been routinely applied in all our studies and has been shown to be an optimal method for the fMEG compared to other methods such as independent component analysis (McCubbin et al 2006). Finally, the signals were filtered by using the fourth-order Butterworth 0.5 Hz high-pass filter. The filtered signal was designated as fMEG-mMCG.
2.4. Identifying the SARA sensors that contain FBM
The coherence estimate is the cross correlation between two signals in frequency domain, a frequency specific measure of the coupling. The magnitude squared coherence (MSC) estimate using Welch’s averaged, modified periodogram method is defined as the ratio of the square of the magnitude of the cross-spectral estimate to the product of the power spectral estimate of the two signals as follows:
| (1) |
where i and j are the channels, f is the frequency, X is the Fourier transform of the signal, N defines the number of segments into which the signal is divided. It provides a normalized measure of the coherence for the frequency f and may have any value between 0 (no coherence) and 1 (perfect coherence).
In order to indentify the fMEG (SARA) sensors that contain the FBM, MSC was performed between the UFBM and fMEG-mMCG signals. As FBM is an intermittent phenomenon, short time windows of 1 min duration were used to insure a good compromise between the frequency resolution and reliable estimate of the coherence. The UFBM signal was up-sampled from 30 to 312.5 Hz using spline interpolation to match the sampling rate of the fMEG. In each window, the fMEG-mMCG signal and the UFBM were divided into 4 s segments (N = 1250) with a 50% overlap between segments. Prior to the spectral computation, the data in each segment were tapered with Hamming window.
3. Results
The operation of the ultrasound device in close proximity to the SQUID sensors created two types of noise: high-frequency (>15 Hz) interferences due to the operation of the ultrasound electronics and a low-frequency (<0.5 Hz) interference due to the transducer movement. The high-frequency interferences were periodic, observable over all the recordings and were specific to the device and the model (16.7 and 20 Hz for Sonosite 180 Plus). The position and orientation change of the transducer did not make any difference in both amplitude and interference frequencies. The low-frequency interference was intermittent, typically between 0.2 and 0.35 Hz and originated from the movements of the transducer. The amplitude was related to the permanent magnetic moment of the transducer, distance from the SQUID sensor, and the amount of movement of the transducer. No significant difference was observed for the magnetic moment magnitudes before and after degaussing (10.18 × 10⁻⁴ Am2 and 10.82 × 10⁻⁴ Am2, respectively).
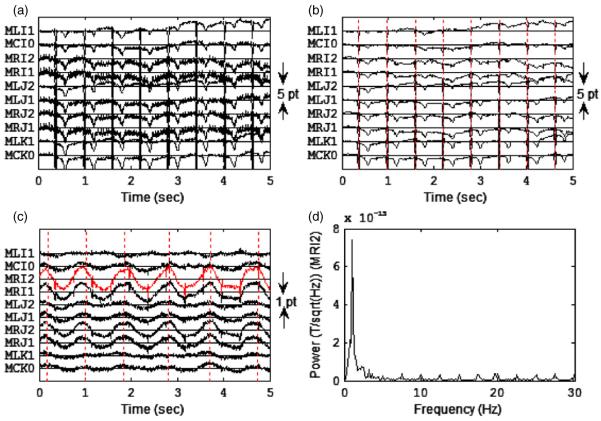
An example of the multichannel tracing of the raw fMEG signals from a 35 week old fetus (subject 2) is shown in figure 4. The amplitude of the periodic interference varied across the sensor array (figure 4(a)). The mechanical arm was effective in reducing the low-frequency interference. The generation of the third-order synthetic gradiometers attenuated the interference of both low- and high-frequency interferences (figure 4(b)). After maternal cardiac signals were attenuated and signals high-pass filtered with a 0.5 Hz cut-off frequency, a low-frequency waveform was observed consistent with the FBM marker points in some channels such as MRI2. Also, the fetal cardiac R waves were seen as periodic spikes (figure 4(c)). The power spectrum of recording in figure 4(c) showed a low-frequency activity around 1.1 Hz which is consistent with the breathing movement (figure 4(d)). The low spectral power in the high-frequency region (>15 Hz) indicated that the filtering process effectively attenuated the interferences.
Figure 4.
(a) Multichannel tracing of the raw fMEG signals observed from a subject (subject 2) at 35 weeks. Ten channels close to the center of the sensor array are shown. (b) Recording in (a) after the third-order reference channel filtering. Vertical lines indicate the R waves of the maternal cardiac cycles. (c) Signals in (b) after maternal cardiac signals were attenuated using the orthogonal projection technique and were filtered by using the fourth-order Butterworth 0.5 Hz high-pass filter. Vertical lines indicate the start of each breath obtained from UFBM signal processing. In some channels a low-frequency periodic signal was observed during the breathing. (d) Power spectrum of the signal obtained by the MRI2 channel in (c).
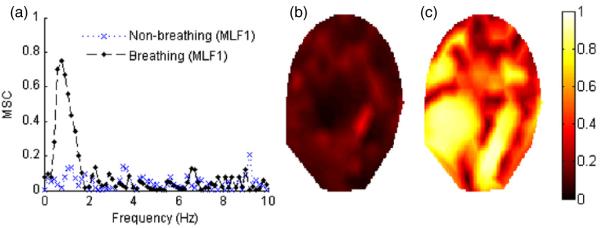
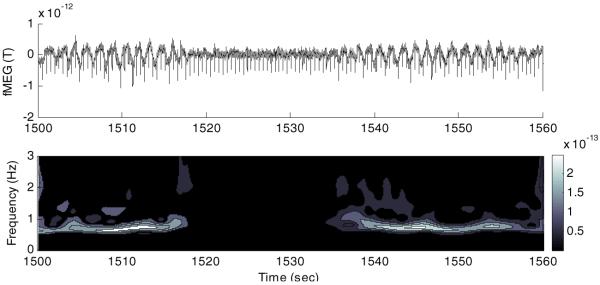
The MSC method was effective for identifying the sensors containing the FBMs. Figure 5(a) illustrates MSC as a function of the frequency plot between the fMEG-mMCG signal obtained by the MLF1 sensor and UFBM for subject 1 during breathing and non-breathing episodes. During a breathing episode, high MSC values were observed in the frequencies between 0.5 and 2 Hz with the peak value of 0.74 at 0.76 Hz. An example of the maximum MSC values for each sensor during non-breathing and breathing episodes is shown in figures 5(b) and (c), respectively. Periodic low-frequency fluctuations in the temporal signal and a distinctive power change in the fetal breathing frequency band (0.5–1.5 Hz) were observed during breathing episodes (figure 6).
Figure 5.
(a) MSC-frequency plot for subject 1 (MLF1 sensor and UFBM signal) during breathing and non-breathing periods are shown. (b) and (c) represent the contour plots corresponding to the distribution of the maximum MSC values calculated for the frequencies between 0.5 and 2 Hz for 151 sensors during 1 min non-breathing and breathing episodes, respectively.
Figure 6.
Top figure shows the fMEG-mMCG signal captured with the MLF1 channel from subject 1. The downward spikes are fetal cardiac cycle R waves. Periodic low-frequency fluctuations were observed during breathing and disappeared after 1518 s when the fetus stopped breathing. After 1536 s, fetus started breathing again. Bottom figure shows time-frequency representation of the signal.
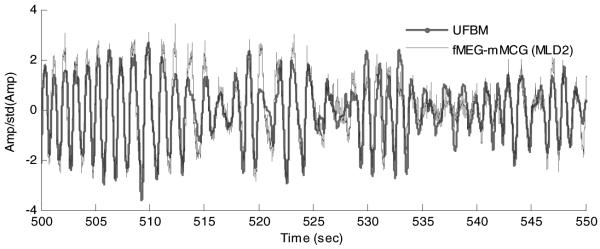
Similarly, figure 7 illustrates the fMEG-mMCG signal with the highest MSC value obtained by the MLD2 channel of SARA and the ultrasound signal observed for the times between 500th and 550th s. The signals were normalized with the standard deviations. A high degree of Pearson’s correlation between two signals was observed (r = 0.8738 and p < 0.0001).
Figure 7.
UFBM and fMEG-mMCG signals obtained from subject 2. The amplitudes were normalized with the signals’ standard deviations.
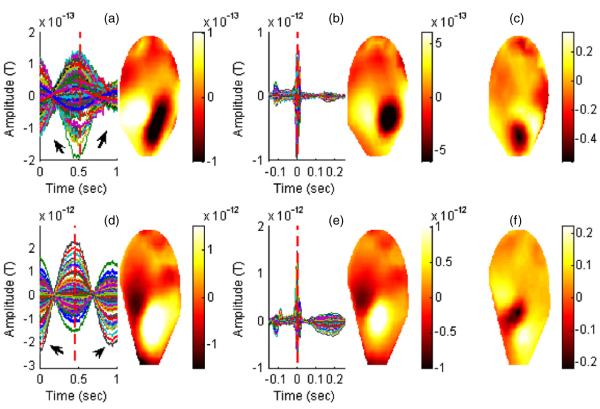
The averaged waveforms and the corresponding magnetic field distributions for the FBM and the cardiac cycle of the subjects are shown in figure 8. The averaged FBM waveforms were obtained from 30 consecutive breaths time locked to the minima points of the UFBM signal. The averaged cardiac cycle signals were obtained from 70 and 77 heartbeats, respectively, time locked to the peak of the R wave. The averaged FBM signals exhibited a low-frequency (around 1 Hz) waveform with different amplitudes which may be due to the distance as the bio-magnetic signal strength measured by the first-order gradiometers is proportional to the forth power of the distance. The visual inspection of the magnetic field distributions corresponding to the FBMs when compared to the magnetic field distributions of the cardiac signals indicated overlapping dipolar sources. In addition, normalized difference maps were produced. This observation provided additional confirmation that the detected FBM signals were centered around the chest area of the fetus.
Figure 8.
Averaged FBM and the cardiac cycle waveforms derived from the fMEG-mMCG signals are shown for subject 1 in (a) and (b) and subject 2 (d) and (e). The contour plots correspond to the distribution of the magnetic fields for the averaged waveforms in the sensor domain at the time point shown by the vertical red line; (c) and (f) show the normalized difference map (FBM minus cardiac cycle).
4. Discussion
The bio-magnetic waveforms associated with FBMs showed a distinctive sinusoidal pattern in the fMEG data. The UFBM signal was obtained by observing the displacement of the fetal thorax. The similarity of the bio-magnetic waveform and the ultrasound signal indicated that the bio-magnetic signal may be a result of physical movement due to the respiratory effort. The magnetic field distribution during breathing indicated that the signals were located in the proximity of the fetal heart. The resulting FBM bio-magnetic signals could have possibly originated from the movement of a single organ such as the fetal diaphragm, lungs or heart, or the collective movement of the organs in the chest cavity.
Further, this study proved that simultaneous operation of ultrasound and SQUID is possible for the FBM observations. There are mainly two reasons for this. First, the FBM movement has a distinct and well-known frequency (0.5–1.5 Hz) that did not overlap with the maternal breathing movements (0.25–0.35 Hz), other fetal gross body movements and the interference originating from the battery operated ultrasound electronics (>15 Hz). Also, the mechanical arm minimized the ultrasound transducer’s movements.
Apart from the study by Zhao et al (2007), there has been no other reported study that has performed simultaneous ultrasound and fMEG recordings. Their main focus was to show the feasibility of performing simultaneous ultrasound fetal heart and fetal magnetocardiography recording. Despite the background interference from ultrasound, the study demonstrated that it is possible to extract heart signals. However, detecting FBMs in bio-magnetic signals is challenging in many ways. The fetal bio-magnetic heart signals are more consistent and have a well-established signature as opposed to FBM signals which are intermittent and its bio-magnetic signature has never been quantified and verified before using simultaneous ultrasound recordings.
The detection and quantification of fetal breathing signals in bio-magnetic data provides information on segments where breathing artifacts occur in fetal brain data which can be discarded from the analysis or else attenuated to the level of background activity so as to reliably study the brain signals. In past investigations, FBM has been studied extensively to determine its potential use as a sensitive indicator for conditions such as fetal distress and hypoxia. However, results of these studies did not provide conclusive evidence (Nijhuis 2003). SQUID technology gives the opportunity to observe bio-magnetic signals pertinent to FBMs concurrent with simultaneous recording of other electrophysiological parameters like fetal brain and heart. Occurrence of FBM in bio-magnetic data can also be used as one of the parameters to assess the fetal well-being in conjunction with a fetal neurological assessment protocol (Lowery et al 2008) which includes a panel of measures of the bio-magnetic signals from the fetal brain, heart and fetal movements.
In summary, this study is the first that has identified the bio-magnetic signal patterns associated with the FBMs and verified their existence with simultaneous ultrasound measurements. The next step would be to utilize the pertinent features of the bio-magnetic FBM signals and apply it to a large number of fetal MEG data sets to identify segments of FBMs. Further, simultaneous ultrasound-fMEG recording can be used to provide a non-invasive technique for measuring event and position related bio-magnetic signal correlations. Finally, the potential of use of the simultaneous measurement of FBM along with other bio-magnetic parameters of fetal brain and heart can be explored in an effort to provide a better means of assessment of fetal well-being and characterization of the typical and atypical fetal maturation.
Acknowledgment
The authors would like to acknowledge Jessica Temple and Maureen Ware for their contribution in subject recruitment, and UALR GIT machine shop for engineering support. This research has been supported by NINDS grant 5R01NS036277-10 and 1 R01 EB007826-01A1.
References
- Czerwinski R, Jones D, O’Brien W. Detection of lines and boundaries in speckle images-application to medical ultrasound. IEEE Trans. Med. Imag. 1999;18:126–36. doi: 10.1109/42.759114. [DOI] [PubMed] [Google Scholar]
- Lowery CL, Govindan RB, Murphy P, Eswaran H. Assessing cardiac and neurological maturation during the intrauterine period. Semin. Perinatol. 2008;32:263–8. doi: 10.1053/j.semperi.2008.04.006. [DOI] [PMC free article] [PubMed] [Google Scholar]
- Lowery CL, Govindan RB, Preissl H, Murphy P, Eswaran H. Fetal neurological assessment using noninvasive magnetoencephalography. Clin. Perinatol. 2009;36:701–9. doi: 10.1016/j.clp.2009.07.003. [DOI] [PMC free article] [PubMed] [Google Scholar]
- Nijhuis JG. Fetal behavior. Neurobiol. Aging. 2003;24(Suppl. 1):S41–6. doi: 10.1016/s0197-4580(03)00054-x. discussion S47–9, S51–2. [DOI] [PubMed] [Google Scholar]
- McCubbin J, Robinson SE, Cropp R, Moiseev A, Vrba J, Murphy P, Preissl H, Eswaran H. Optimal reduction of MCG in fetal MEG recordings. IEEE Trans. Biomed. Eng. 2006;53:1720–4. doi: 10.1109/TBME.2006.876619. [DOI] [PubMed] [Google Scholar]
- Otsu N. A threshold selection method from gray-level histograms. IEEE Trans. Syst. Man. Cybern. 1979;9:62–6. [Google Scholar]
- Soni P, Chan Y, Eswaran H, Wilson JD, Murphy P, Lowery CL. Spatial-temporal analysis of fetal bio-magnetic signals. J. Neurosci. Methods. 2007;162:333–45. doi: 10.1016/j.jneumeth.2006.12.015. [DOI] [PMC free article] [PubMed] [Google Scholar]
- Sternickel K, Braginski AI. Biomagnetism using SQUIDs: status and perspectives. Supercond. Sci. Technol. 2006;19:S160–71. [Google Scholar]
- Stockwell R, Mansinha L, Lowe R. Localization of the complex spectrum: the S transform. IEEE Trans. Signal Process. 1996;44:998–1001. [Google Scholar]
- Ulusar U, Govindan RB, Wilson JD, Lowery CL, Preissl H, Eswaran H. Adaptive rule based fetal QRS complex detection using Hilbert transform. IEEE Eng. Med. Biol. Soc. 2009;2009:4666–9. doi: 10.1109/IEMBS.2009.5334180. [DOI] [PMC free article] [PubMed] [Google Scholar]
- Vrba J, Robinson SE, McCubbin J, Lowery CL, Eswaran H, Wilson JD, Murphy P, Preissl H. Fetal MEG redistribution by projection operators. IEEE Trans. Biomed. Eng. 2004;51:1207–18. doi: 10.1109/TBME.2004.827265. [DOI] [PubMed] [Google Scholar]
- Vrba J, Robinson SE. Signal processing in magnetoencephalography. Methods. 2001;25:249–71. doi: 10.1006/meth.2001.1238. [DOI] [PubMed] [Google Scholar]
- Zhao H, Chen M, Van Veen BD, Strasburger JF, Wakai RT. Simultaneous fetal magnetocardiography and ultrasound/Doppler imaging. Supercond. Sci. Technol. 2007;54:1167–71. doi: 10.1109/TBME.2006.889198. [DOI] [PubMed] [Google Scholar]


