

Abstract
Motivation: Identification of somatic DNA copy number alterations (CNAs) and significant consensus events (SCEs) in cancer genomes is a main task in discovering potential cancer-driving genes such as oncogenes and tumor suppressors. The recent development of SNP array technology has facilitated studies on copy number changes at a genome-wide scale with high resolution. However, existing copy number analysis methods are oblivious to normal cell contamination and cannot distinguish between contributions of cancerous and normal cells to the measured copy number signals. This contamination could significantly confound downstream analysis of CNAs and affect the power to detect SCEs in clinical samples.
Results: We report here a statistically principled in silico approach, Bayesian Analysis of COpy number Mixtures (BACOM), to accurately estimate genomic deletion type and normal tissue contamination, and accordingly recover the true copy number profile in cancer cells. We tested the proposed method on two simulated datasets, two prostate cancer datasets and The Cancer Genome Atlas high-grade ovarian dataset, and obtained very promising results supported by the ground truth and biological plausibility. Moreover, based on a large number of comparative simulation studies, the proposed method gives significantly improved power to detect SCEs after in silico correction of normal tissue contamination. We develop a cross-platform open-source Java application that implements the whole pipeline of copy number analysis of heterogeneous cancer tissues including relevant processing steps. We also provide an R interface, bacomR, for running BACOM within the R environment, making it straightforward to include in existing data pipelines.
Availability: The cross-platform, stand-alone Java application, BACOM, the R interface, bacomR, all source code and the simulation data used in this article are freely available at authors' web site: http://www.cbil.ece.vt.edu/software.htm.
Contact: yuewang@vt.edu
Supplementary Information: Supplementary data are available at Bioinformatics online.
1 INTRODUCTION
DNA copy number change is an important form of structural variation in the human genome. Somatic copy number alterations (CNAs) are key genetic events in the development and progression of human cancers, and frequently contribute to tumorigenesis (Pollack et al., 2002). The coverage of copy number changes varies from a few hundred to several million nucleotide bases, and somatic CNAs in tumors exhibit highly complex patterns. The advance of oligonucleotide-based single nucleotide polymorphism (SNP) arrays provides a high-density and allelic-specific genomic profile and enables researchers to study copy number changes on a genome-wide scale. For instance, Affymetrix offers several DNA analysis arrays for SNP genotyping and copy number variation (CNV) analysis, and the newest Affymetrix Genome-Wide Human SNP Array 6.0 features 1.8 million genetic markers, including more than 906 600 SNPs and more than 946 000 probes for detecting CNVs or CNAs.
Quantitative analysis of somatic CNAs has found broad application in cancer research. Although molecular analysis of tumors in their native tissue environment provides the most accurate picture of their in vivo state, tissue samples often consist of mixed cancer and normal cells, and accordingly, the observed SNP intensity signals are the weighted sum of the copy numbers contributed from both cancer and normal cells. This tissue heterogeneity inherited in the measured copy number signals could significantly confound subsequent marker identification and molecular diagnosis rooted in cancer cells, e.g. true copy number estimation, consensus region detection, CNA association studies and detection of loss of heterozygosity and homozygous deletion. Experimental methods for minimizing normal cell contamination, such as cell enrichment or purification, are prohibitively expensive, inconvenient and prone to errors (Clarke et al., 2008).
Here we ask whether it is possible to computationally correct normal tissue contamination by estimating the proportions of normal and cancer cells and recovering the true copy number profiles of cancer cells, based on the observed SNP intensity signals from cell mixtures. Albeit with limited success, some initial efforts have been recently made to address the impact of normal tissue contamination in copy number analysis (Assie et al., 2008; Lamy et al., 2007; Nancarrow et al., 2007; Peiffer et al., 2006) or to estimate the fraction of normal cells in tumor samples (Goransson et al., 2009; Yamamoto et al., 2007). Nancarrow et al. (2007) developed a visual inspection toolkit that allows users to determine the presence of stromal contamination. Yamamoto et al. (2007) and Goransson et al. (2009) proposed computational methods to estimate the proportion of normal cells by matching to the experimental or simulated histograms of different mixtures. However, given the fact that the noise level in the raw copy number data is often quite high and varies from sample to sample, neither visual inspection nor simulated histogram matching will be able to produce an accurate and stable estimate of the fraction of normal cells in the tumor sample. An additional limitation associated with these methods is the lack of rigorous statistical principles in driving algorithm development.
In this study, we report a statistically principled in silico approach to accurately detect genomic deletion type, estimate normal tissue contamination and accordingly recover the true copy number profile in cancer cells. By exploiting the allele-specific information provided by SNP arrays, we introduce a series of definitions and theorems to illustrate the detectability and its conditions, and propose a Bayesian Analysis of COpy number Mixtures (BACOM) method. The BACOM algorithm is based on a statistical mixture model for copy number deletion segments in heterogeneous tumor samples, whose parameters are estimated using Bayesian differentiation between hemizygous deletion (hemi-deletion, where one allele is absent) and homozygous deletion (homo-deletion, where both alleles are absent) and plug-in sample averaging. Subsequently, the weighted average of estimated normal tissue fraction coefficients across multiple segments is used to estimate the true copy numbers rooted in cancer cells across all loci on the genome. As shown in the Section 4, this method not only produces cancer-specific copy number profiles but also substantially improves significant consensus events (SCEs) detection power.
To better serve the research community, we have developed a cross-platform Java application, which implements the whole pipeline of copy number analysis of heterogeneous cancer tissues. The BACOM software instantiates the algorithms described in this report and other necessary processing steps. To take advantage of many widely used packages in R to perform DNA copy number analysis and R's powerful and versatile visualization capabilities, we also provide an R interface, bacomR, that enables users to smoothly incorporate BACOM into their specific copy number analysis or to integrate BACOM with other R or Bioconductor packages. We expect this newly developed software to be a useful tool in routine copy number analysis of heterogeneous tissues.
2 THEORY AND METHOD
We first discuss a deletion-focused latent variable model for the copy number signal in heterogeneous tumor samples. Then, we propose a Bayesian approach to statistically characterize distinctive copy number signals due to homo-deletion or hemi-deletion, supported by a novel summary statistic derived from allele-specific information. Next, we estimate the fraction of normal cells in the sample based on the deletion type-specific segments, and subsequently recover the cancer-specific DNA copy number profile. Figure 1 gives the flowchart of BACOM consisting of three major steps: (i) inference of deletion types, (ii) estimation of the normal tissue fraction and (iii) recovery of the copy number profile in cancer cells.
Fig. 1.

The flow chart of BACOM.
2.1 Copy number signal model
Supplementary Figure S17 shows SNP array intensity signals that serve as the raw data to study copy number changes, where observed non-integer copy numbers suggest the presence of normal cells in the tumor sample. In heterogeneous tumor samples, the measured array intensity is a mixture of DNA copy number signals from both normal and cancer cells, given mathematically by
| (1) |
where Xi is the observed DNA copy number signal at locus i, α is the unknown fraction of normal cell subpopulation in the sample and Xnormal,i and Xcancer,i are the unknown latent DNA copy number signals in normal and cancer cells at locus i, respectively. It should be noted that, in model (1), we have chosen not to consider CNVs in normal cells, because these are much rarer than CNAs in cancer cells.
Since human somatic cells are diploid, the expected DNA copy number at locus i in normal cells is two, i.e. E[Xnormal,i]=2. In contrast, if there is a homo-deletion or hemi-deletion at locus i in cancer cells, then the expected DNA copy number becomes zero or one, i.e. E[Xcancer,i]=0 or 1. By focusing on deletion-only CNA loci and taking the expectations on both sides of Equation (1), we have
| (2) |
Equation (2) indicates that, as a function of normal cell fraction α, the expected copy number at a deletion locus depends on the deletion type and is distinctive except when α=1. Inspired by this observation, we propose to explore a statistically principled solution (detectability): if a Bayesian hypothesis test can be constructed to differentiate between homo-deletion and hemi-deletion segments based on allele-specific signals, we could, in principle, estimate α by the sample average over the deletion segments.
2.2 Inference of deletion type
Affymetrix SNP chips provide both allele-specific signals (A allele and B allele) and their summed intensity (observed DNA copy number signal). If we denote the signals of alleles A and B at locus i by XA,i and XB,i, respectively, then the observed DNA copy number signal Xi in model (1) can be rewritten as
| (3) |
To fully exploit allele-specific information readily provided by the SNP arrays and associated genotype calling algorithms, our method will focus solely on AB genotype (not considering AA or BB genotypes). For a length-L homo/hemi-deletion segment {Xi|i=1,2,…,L}, we make the following realistic assumption on the allele-specific signals.
Assumption 1. —
For a length-L homo/hemi-deletion segment {Xi|i=1,2,…,L}, each of the allele-specific signals XA,i and XB,i are independently distributed Gaussian random variables with distinct means but common variance, σ2, for i=1,2,…,L.
It should be noted that XA,i and XB,i are not statistically independent but, rather often correlated, referred to as the cross-talk between alleles A and B (Bengtsson et al., 2008). Thus, under Assumption 1, the observed copy number signals Xi are independent and identically distributed random variables following a normal distribution N(μA+B,σ2A+B) whose mean μA+B and variance σ2A+B can be readily estimated by using the observed signals Xi for i=1,2,…,L.
To statistically differentiate between hemi-deletion and homo-deletion, we define a novel summary statistic, given mathematically by the following newly defined random variable
| (4) |
where σA−B2 is the variance of XA,i−XB,i. Under Assumption 1, it can be shown that Y follows either a non-central or a standard χ2 distribution, depending upon the deletion type. We, therefore, present the following two lemmas with proofs to show that the key parameter associated with these χ2 distributions can be estimated using signals Xi, XA,i and XB,i.
Lemma 1. —
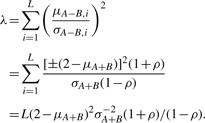
Suppose that, within a length-L hemi-deletion segment, each of the allele-specific signals XA,i and XB,i are independently distributed Gaussian random variables with distinct means and common variance. Then, the summary statistic random variable Y defined in (4) follows an L degrees of freedom non-central χ2 distribution with non-centrality parameter λ=L(2−μA+B)2σA+B−2(1+ρ)/(1−ρ), where ρ is the correlation coefficient between XA,i and XB,i.
Proof. —
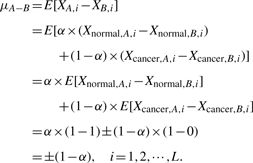
Applying Equation (1) to the loci within a hemi-deletion segment, where one of the alleles (but not both) is deleted, we have, for i=1,2,…,L
While from Equation (2), we have μA+B=E[Xi]=1+α which implies α=μA+B−1.
Thus, μA−B can be expressed in terms of μA+B as
Furthermore, Assumption 1 implies that
Although direct estimation of σA−B2 is a non-trivial task, simple mathematical manipulation shows that σA−B2 can be expressed in terms of σA+B2 as
By the definition of the non-centrality parameter λ and Equation (4), we conclude
Accordingly, the conditional L degrees of freedom non-central χ2 distribution of Y under hemi-deletion is given by
(5) where Γ denotes the Gamma function.
Q.E.D.
Lemma 2. —
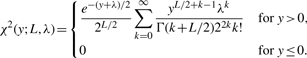
Suppose that, within a length-L homo-deletion segment, each of the allele-specific signals XA,i and XB,i are independently distributed Gaussian random variables with distinct means and common variance. Then, the summary statistic random variable Y defined in (4) follows an L degrees of freedom standard χ2 distribution.
Proof. —
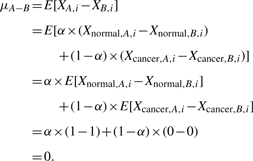
Applying Equation (1) to the loci within a homo-deletion segment, where both alleles are deleted, we have, for i=1,2,…,L
Thus, Equation (4) implies that, under homo-deletion, the summary statistic random variable Y defined in (4) follows an L degrees of freedom standard χ2 distribution, given by
(6) where Γ denotes the Gamma function.
Q.E.D.
Lemmas 1 and 2 suggest the possibility of constructing a Bayesian hypothesis testing strategy to differentiate between the two deletion types (i.e. hemi-deletion and homo-deletion). The novel and powerful feature of this approach is that the parameter value of the underlying deletion type-conditioned probability density function can be readily estimated using the available signals Xi, XA,i and XB,i without the knowledge of the deletion type associated with Xi, XA,i and XB,i. Furthermore, having determined the deletion type-conditioned probability density functions, we can then identify the deletion type of the segment using Bayesian hypothesis testing. The conclusion is summarized in the following theorem.
Theorem 1 (deletion-type identifiability) —
Suppose that, within a length-L deletion segment, each of the allele-specific signals XA,i and XB,i are independently distributed Gaussian random variables with distinct means and common variance. Then, the summary statistic random variable Y=σA−B−2∑i=1L(XA,i−XB,i)2 follows an L degrees of freedom χ2 distribution under homo-deletion, and a non-central L degrees of freedom χ2 distribution under hemi-deletion, with a parameter that can be estimated based on signals XA,i and XB,i. Accordingly, the segment deletion type can be optimally determined by Bayesian hypothesis testing.
Proof. —
From Lemma 1, the summary statistic random variable Y under hemi-deletion follows an L degrees of freedom non-central χ2 distribution. From Lemma 2, the summary statistic random variable Y under homo-deletion follows an L degrees of freedom standard χ2 distribution. Again, from Lemma 1, we have
which can be estimated using readily available signals.
Then, a straightforward application of Bayesian hypothesis testing implies that the deletion type of the segment can be optimally determined by
(7) where P(·|·) denotes the posterior probability of the segment deletion type given the observed segment signals.
Q.E.D.
2.3 Implementation of BACOM algorithm
We now complete the description of the BACOM algorithm by considering the estimation of the model parameters μA+B, σA+B and ρ. Note that μA+B and σA+B are segment specific. For each segment, they can be readily estimated from the observed copy number signals by
| (8) |
| (9) |
Moreover, we assume that ρ is identical across all the loci within one subject profile, and hence we conveniently estimate its value based on only the signals at the Nnormal loci within all normal segments, as given by
| (10) |
| (11) |
Having determined the parameters of the deletion-type conditional models, we can infer the type of each deletion segment by applying Bayesian hypothesis testing based on (7). Subsequently, we can estimate the fraction of normal cells in the sample specified by (2), i.e., αj=μj−1 for hemi-deletion and αj=μj/2 for homo−deletion, where μj is the sample average of the copy number signals of the j-th deletion segment. Moreover, assume that there are K deletion segments, we can calculate the ensemble estimate of the normal cell proportion via segment-length weighted average
| (12) |
where Lj is the length of the j-th deletion segment.
Finally, the estimated normal cell fraction can be used to recover the true copy numbers in cancer cells in the sample. Since Xnormal,i=2 and based on (1), it is straightforward to estimate the DNA copy number of pure cancer cells by
| (13) |
3 BACOM SOFTWARE
3.1 Stand-alone Java application
To better serve the research community, we developed a cross-platform and open-source BACOM Java application, which implements the entire pipeline of copy number change analysis for heterogeneous cancer tissues (Supplementary Material). The BACOM software instantiates not only the novel algorithms described here but also other relevant processing steps, including extraction of raw copy number signals from CEL files, iterative data normalization, identification of AB loci, copy number detection and segmentation, probe sets annotation, differentiation of deletion types, estimation of the normal tissue fraction and correction of normal tissue contamination. Interested readers can freely download the software and source code at http://www.cbil.ece.vt.edu/software.htm.
3.2 Running BACOM in R environment
To take advantage of many widely used packages in R and its associated powerful and versatile visualization capabilities, we also implemented an R interface, bacomR, that enables users to smoothly incorporate BACOM into their routine copy number analysis pipeline or integrate BACOM with other R or Bioconductor packages. Users can use their preferred methods to perform routine tasks such as array normalization and DNA copy number segmentation and estimation, while using the newly added BACOM to estimate the normal cell fraction and subsequently recover the true copy number profiles in pure cancer cells.
4 RESULTS
4.1 Simulation studies
We first consider a realistic synthetic dataset from a mixture of normal and simulated cancer copy number profiles, as shown in Figure 2a. The cancer copy number profile is simulated based on the real DNA copy number profile of a normal tissue sample assayed on the Affymetrix Genome-Wide 6.0 SNP array, consisting of two simulated four-copy amplification segments and one simulated hemi-deletion segment. The normal and cancer copy number profiles are numerically mixed based on known proportions to produce the observed copy number signal. Since there is only one deletion segment (loci 25k~30k), it is theoretically impossible to tell the deletion type by examining the observed copy number signal, given the fact that the cancer copy number signal has been severely contaminated by a normal copy number signal. The single deletion inclusion in this dataset has been chosen in order to illustrate the unsupervised learning ability of BACOM in determining deletion types.
Fig. 2.

The DNA copy number profile and Bayesian analysis of the deletion segment of the simulation dataset 1 when α=0.7. (A) Copy number profile and correction results. (B) Bayesian analysis to determine the deletion type of the deletion segment.
To determine the deletion type, we first estimate the posterior probability models of the summary statistic using allele-specific signals provided by SNP chips, and plot the observed value of the summary statistic associated with the deletion segment, shown in Figure 2b. The plot clearly suggests the hemi-deletion type of the deletion segment. We then estimate the normal tissue fraction in the sample based on the sample average of the deletion segment α=μA+B−1. This leads to an estimate of α=0.692 and the accordingly corrected cancer copy number profile shown in Figure 2a. The results show the effectiveness of the BACOM approach in that the deletion type is correctly determined, the estimated normal tissue fraction is very close to the true value α=0.7 and the recovered amplification signals indicate the two expected four-copy segments.
As an example of a more complex simulation, we consider a dataset from a mixture of normal and simulated cancer copy number profiles, as shown in Figure 3a. The cancer copy number profile includes one homo-deletion, two hemi-deletions and three different amplification (copy numbers 3, 4 and 5) segments. The simulated cancer copy number signal, with a total of six altered copy number segments, not only retains the statistical characteristics of real SNP array intensity data, but also provides a more complete picture of copy number alterations and genomic instability in cancer cells. Once again, the normal and cancer copy number profiles are numerically mixed based on known proportions to produce the observed copy number signal. The multiple type-deletion inclusions in this dataset have been chosen in order to illustrate the consistency and applicability of BACOM in estimating normal tissue fraction and cancer-associated copy number alterations.
Fig. 3.

The DNA copy number profile and Bayesian analysis of deletion segments of the simulation dataset 2 when α = 0.7. (A) Copy number profile and correction results. (B) Bayesian analysis to determine the deletion types of the three deletion segments.
We first estimate separately the individual normal tissue fractions αj from one homo-deletion and two hemi-deletion segments, where the posterior probability models and observed values of the summary statistic associated with the deletion segments are shown in Figure 3b. We then use the average value  to recover the cancer-associated copy number profile, shown in Figure 3a, where the solid line segments are the recovered cancer-associated copy number changes. We tested BACOM on six simulation datasets with different α values, as given in Table 1. The BACOM approach again achieved very promising results in which the deletion types are correctly determined, the estimated normal tissue fractions from different deletion segments are highly consistent, with the average value very close to the true value and the recovered signals of all six deletion and amplification segments indicate the expected integer-valued copy number changes. Table 1 summarizes the experimental results from all 12 simulated copy number profiles.
Table 1.
Estimation results on two simulation datasets
| Dataset 1 |
Dataset 2 |
|||||
|---|---|---|---|---|---|---|
| α |  |
α1 |  |
α1 | α1 | α3 |
| 0.3 | 0.291 | 0.291 | 0.293 | 0.285 | 0.286 | 0.293 |
| 0.4 | 0.391 | 0.391 | 0.393 | 0.385 | 0.386 | 0.393 |
| 0.5 | 0.491 | 0.491 | 0.493 | 0.485 | 0.486 | 0.493 |
| 0.6 | 0.591 | 0.591 | 0.592 | 0.585 | 0.585 | 0.593 |
| 0.7 | 0.693 | 0.693 | 0.692 | 0.691 | 0.685 | 0.685 |
| 0.8 | 0.793 | 0.793 | 0.792 | 0.785 | 0.785 | 0.793 |
4.2 Analysis of real DNA copy number data
To test the applicability of our proposed method, we consider a real copy number profile for a prostate cancer sample assayed on the Affymetrix SNP 500K array. We first applied the BACOM algorithm to estimate the fraction of normal cell population in the sample, resulting in  , which indicates significant normal tissue contamination. We then used the estimated
  value to recover cancer-specific copy number signal by Equation (13). The resulting corrected copy number profile for Chromosome 10 is shown in Figure 4, where dotted signals are the mixed copy number signals arising from the tumor sample with blue-colored regions being the detected deletion segments, green solid lines are the normal copy number segments and blue solid lines are the corrected cancer-specific deletion segments. In this experiment, our analysis readily reveals and distinguishes both deletion types and their occurred genomic locations. It is worth noting that BACOM algorithm identified a homo-deletion segment around locus 18 500 in Chromosome 10, that contains the well-known tumor suppressor gene PTEN.
Fig. 4.

The DNA copy number profile of Chromosome 10 in a prostate cancer sample assayed on Affymetrix SNP 500K platform.
As an example of a somewhat independent verification, we applied the BACOM algorithm to the copy number profile of another prostate cancer sample assayed on the Affymetrix Genome-Wide 6.0 platform ((Liu et al., 2009)). The estimated fraction of normal cells in the sample is  and the results of similar analyses are given in Figure 5. Different from the previous example, this copy number profile contains two amplification segments that are purple colored. Denoted by red solid lines, the corrected copy numbers of amplification segments are integer valued, consistent with our theoretical expectation. This observation serves as a convincing validation of the proposed method, since the normal cell fraction
  was independently estimated from only deletion segments.
Fig. 5.

The DNA copy number profile of Chromosome 17 in a prostate cancer sample assayed on Affymetrix Genome-Wide 6.0.
To further assess the applicability of BACOM, we report results on additional 55 prostate samples and The Cancer Genome Atlas high-grade ovarian cancer dataset, showing a considerable range of variation in normal cell contamination (36–70%) and co-deletion of two tumor suppressor genes—TP53 and BRCA1 (Supplementary Table S2 and Figs S3–S10).
4.3 Impact on detecting significant consensus events
Somatic copy number alterations in genomes underlie almost all human cancers. One of the systematic efforts to characterize cancer genomes is to identify significant consensus events (SCEs) from random background aberrations. To test the utility of our method to address an important biological question, we applied BACOM together with genomic identification of significant targets in cancer (GISTIC) (Beroukhim et al., 2007) to specifically designed copy number simulation datasets. Each sample (3000 loci) contains both normal copy number and various deletion/amplification segments (150~250 loci). The consensus events at certain loci are inserted into the base profile according to a specified frequency, while random background aberrations are simulated with randomly assigned length and loci. Simulation parameters include sample size, consensus frequency and normal cell fraction. We generated 1000 simulation datasets for each combinatorial parameter setting, resulting in a total of 20 000 simulation datasets, each containing 30~90 samples.
Next, for each of the mixed copy number profiles, we recovered cancer-specific copy numbers by BACOM. To detect SCEs from both mixed and deconvolved copy number profiles, we applied GISTIC, a statistical method that calculates a score that is based on both the amplitude and frequency of copy number changes at each position, using a semi-exact approach to determine the significance. To analyze the impact of correcting normal tissue contamination on detecting SCEs, we calculated power based on GISTIC outcomes and ground truth. Comparative experimental results, given in Figure 6, consistently show significantly improved power using deconvolved cancer-specific profiles (see more discussion and results in the Supplementary Material).
Fig. 6.
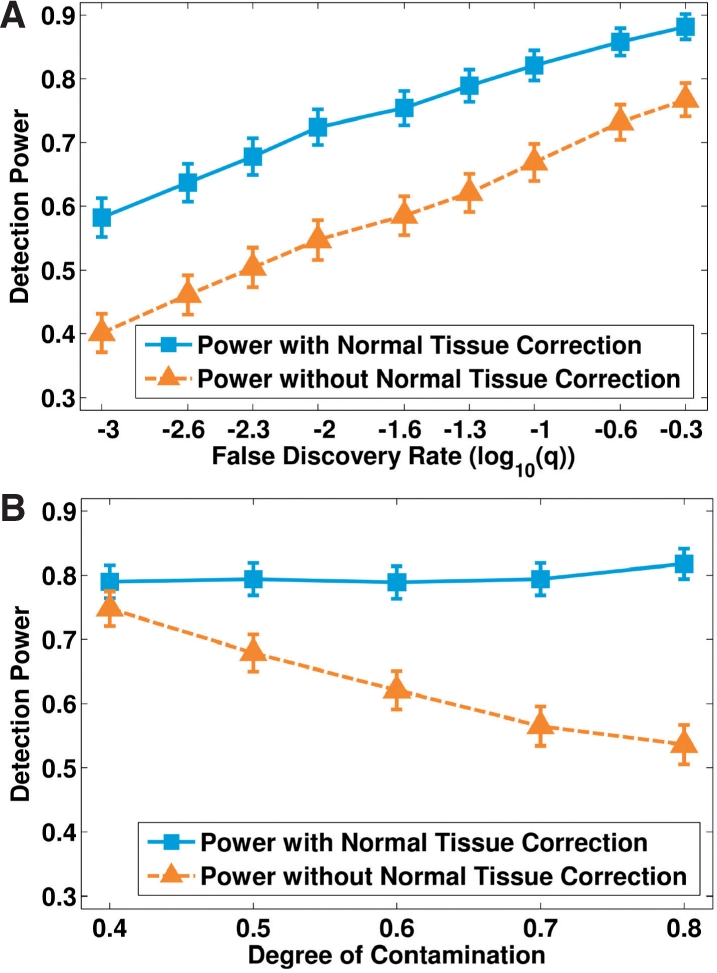
A comparison of the power to detect significant consensus events with and without correction of the normal tissue contamination, along (A) different false discovery rates (FDRs) and (B) different degrees of contamination.
5 CONCLUSIONS AND DISCUSSIONS
In this article, we report a statistically principled in silico approach to estimate copy number deletion types and normal tissue contamination, and to extract the true copy number profile in cancer cells. The BACOM algorithm utilizes the allele-specific information provided by SNP chips to differentiate between hemi-deletion and homo-deletion and subsequently estimates the fraction of normal cells in tissues. We tested the proposed method on two simulated datasets, two prostate cancer datasets and The Cancer Genome Atlas high-grade ovarian dataset, and obtained highly promising results. We expect the newly developed BACOM software to be a useful tool in copy number analysis of heterogeneous tissues.
There are some questions worth further exploration. Specifically, so far we have focused on normal tissue contamination by assuming a homogeneous cancer cell population, while in reality, cancer cells are often clonally heterogeneous leading to cancer subtypes. The ability to further dissect genomic heterogeneity of cancer cells is of great interest and will facilitate pathogenesis studies with far-reaching clinical implications.
In addition to heterogeneity of copy number, more mutations in cancer cells are expected and may have some unknown implications. However, since the summary statistic was defined on the whole deletion segment and the final normal tissue fraction was estimated using segment-length weighted average over multiple deletion segments, such mutations will only have negligible effects on the estimation accuracy as long as the mutations are sporadic compared with copy number alterations. In our experiments on real datasets, we have not observed any major effects caused by such mutations.
In relation to earlier work, the use of allele-specific signals is shared by Goransson et al. for developing a histogram match-based CNNLOH method (Goransson et al., 2009). Besides high computational complexity in histogram simulation and matching, the mechanism for evaluating observed histogram is prone to high estimation bias and variance as CNNLOH uses truncated, evenly weighted and coarse histograms in winner-take-all selection among chromosomes. We have conducted a comprehensive simulation study to compare the performance of CNNLOH and BACOM. Experimental results consistently show that BACOM outperforms CNNLOH in terms of much lower estimation bias and variance, as well as dramatically reduced computation time (see more discussions and results in Supplementary Material).
Funding: US National Institutes of Health under Grants (EB000830, CA109872, CA129080 and CA103937) in part.
Conflict of Interest: none declared.
REFERENCES
- Assie G., et al. SNP arrays in heterogeneous tissue: Highly accurate collection of both germline and somatic genetic information from unpaired single tumor samples. Am. J. Hum. Genet. 2008;82:903–915. doi: 10.1016/j.ajhg.2008.01.012. [DOI] [PMC free article] [PubMed] [Google Scholar]
- Bengtsson H., et al. Estimation and assessment of raw copy numbers at the single locus level. Bioinformatics. 2008;24:759–767. doi: 10.1093/bioinformatics/btn016. [DOI] [PubMed] [Google Scholar]
- Beroukhim R., et al. Assessing the significance of chromosomal aberrations in cancer: methodology and application to glioma. Proc. Natl Acad. Sci. USA. 2007;104:20007–20012. doi: 10.1073/pnas.0710052104. [DOI] [PMC free article] [PubMed] [Google Scholar]
- Clarke R., et al. The properties of high-dimensional data spaces: implications for exploring gene and protein expression data. Nat. Rev. Cancer. 2008;8:37–49. doi: 10.1038/nrc2294. [DOI] [PMC free article] [PubMed] [Google Scholar]
- Goransson H., et al. Quantification of normal cell fraction and copy number neutral LOH in clinical lung cancer samples using SNP array data. PLoS One. 2009;4:e6057. doi: 10.1371/journal.pone.0006057. [DOI] [PMC free article] [PubMed] [Google Scholar]
- Lamy A hidden Markov model to estimate population mixture and allelic copy-numbers in cancers using Affymetrix SNP arrays. BMC Bioinformatics. 2007;8:434. doi: 10.1186/1471-2105-8-434. [DOI] [PMC free article] [PubMed] [Google Scholar]
- Liu W., et al. Copy number analysis indicates monoclonal origin of lethal metastatic prostate cancer. Nat. Med. 2009;15:559–565. doi: 10.1038/nm.1944. [DOI] [PMC free article] [PubMed] [Google Scholar]
- Nancarrow D.J., et al. SiDCoN: a tool to aid scoring of DNA copy number changes in SNP chip data. PLoS One. 2007;2:e1093. doi: 10.1371/journal.pone.0001093. [DOI] [PMC free article] [PubMed] [Google Scholar]
- Peiffer D.A., et al. High-resolution genomic profiling of chromosomal aberrations using infinium whole-genome genotyping. Genome Res. 2006;16:1136–1148. doi: 10.1101/gr.5402306. [DOI] [PMC free article] [PubMed] [Google Scholar]
- Pollack J.R., et al. Microarray analysis reveals a major direct role of DNA copy number alteration in the transcriptional program of human breast tumors. Proc. Natl Acad. Sci. USA. 2002;99:12963–12968. doi: 10.1073/pnas.162471999. [DOI] [PMC free article] [PubMed] [Google Scholar]
- Yamamoto G., et al. Highly sensitive method for genomewide detection of allelic composition in nonpaired, primary tumor specimens by use of Affymetrix single-nucleotide-polymorphism genotyping microarrays. Am. J. Hum. Genet. 2007;81:114–126. doi: 10.1086/518809. [DOI] [PMC free article] [PubMed] [Google Scholar]