Abstract
In this paper we have shown that electrode polarization impedance (EPI) can be separated from measured tissue impedance as long as the characteristic frequencies of EPI and tissue are not too close, so that the EPI is largely displayed as a separate dispersion. In 2-electrode measurements the EPI and sample are physically connected in series, and commonly modelled by equivalent components in series. We have calculated the parallel equivalent elements and converted the series connected EPI and sample to a parallel admittance model. By curve fitting on the converted model we have shown that this provides a new method for estimating the EPI with enhanced accuracy compared to similar techniques used on the impedance model.
Keywords: Admittance model, cole-equation, curve fitting, multiple dispersions.
INTRODUCTION
By converting the impedance values from the series connected sample and electrode polarization impedance (EPI – also commonly abbreviated by ZEP) to a parallel admittance model, we have introduced a new method for estimation of the EPI contribution in a set of measurement data. An impedance is commonly represented by a resistance (R) and a reactance (X) as is the imaginary unit). For a given value of R and X, an equivalent admittance (Y=G+jB) can be found by the right choice of conductance (G) and susceptance (B) [1].
EPI is a common problem in low frequency electrical bioimpedance measurements [1-12] and probably one of the mostly discussed topics in these types of investigations.
The EPI becomes more pronounced in highly conductive media [2-5] or when using small electrodes [2]. In Kalvøy et al. we even found influence from EPI above 100 kHz in measurements on sub-mm2 needle electrodes [6]. Together with the dependency of frequency and electrode properties like material [7], radius [2] and shape [13], the EPI has also been shown to be dependent on the measured sample [2, 4, 7] and current density [2]. Due to the influence from this variety of factors the EPI is not easily separated from the sample properties in an impedance measurement.
Schwan [2] résumés the history of the EPI research since it was first described over a century ago. Among others he refers to different models for describing the behaviour of the EPI. The most common models are:
A frequency dependent resistor and capacitor in series (Rp(ω) and Cp(ω), where ω=2πf is the angular frequency) [2, 8]
A frequency dependent resistor and capacitor in parallel [9]
A permittivity model similar to the Cole-Cole equation [2, 9]
All of these are expected to be connected in series with the sample under investigation.
Different techniques for reduction or correction of the EPI influence on impedance measurement have been proposed over the years. Schwan [2] tabulates seven of these methods. We have listed an expanded version of his table including references to examples and descriptions in Table 1.
Table 1.
Methods for Reduction or Correction of Parasitic Electrode Properties
| Method: | Description: | Used and Explained by: | |
|---|---|---|---|
| A. | Mathematical subtraction | Estimate EPI from modelling and subtract from measurement data | [1, 2, 4, 7, 8, 11] |
| B. | Electrode distance variation | Eliminate homogenous sample contribution by measuring with different distances between the electrodes | [2, 12] |
| C. | Substitution method | Sample is substituted with a calibration solution with known properties to estimate the EPI | [2, 3, 9, 11] |
| D. | 4-electrode | Separate electrode pairs for excitation and pick-up eliminate current in the pick-up electrodes and the EPI is not included in the measurement. | [15, 16] |
| E. | Increased current density | Current density above the linear region may reduce the EPI significantly | [2, p 282, 12] |
| F. | Electrode modification | Modification of electrode properties for enhanced quality and less EPI | [1, 2, 7, 11] |
| G. | Reduction of sample conductivity | EPI is less pronounced in low conductive media measurements | [2] |
| H. | Electrode-less excitation by magnetic induction | The electrodes and their parasitic properties can be avoided by using a coil and magnetic induction for excitation and measurement. | [11, 17] |
| I. | Coupling fluid | The electrodes can be moved out of the current field or be enlarged by using a conductive coupling fluid to establish contact to the sample | [5] |
Intuitively the best approach is to modify the measurement setup to reduce or eliminate the effect from EPI before measuring. Methods D, F and H are of such a character, and one rule of thumb could be to always consider these methods and evaluate measurement setups in pilot studies before resources are used on further collection of data. Probably because method H has limited relevance for other samples than suspensions, method D and F are the most used among these three. Except for method A, D and F, the other methods need special arrangements or have other limitations that often make them inadequate in the clinic and measurements in vivo. Since some applications need special electrode arrangement and the sensitivity and spatial resolution of the measurements are dependent of the electrode setup, method D and F are not always feasible, and many investigators end up with method A and the challenging task of subtracting the EPI from their sample data.
Before extracting the sample data from the measurement results, a thorough understanding of the measurement system and the main factors contributing to the result must be obtained. The need to establish a proper equivalent circuit is almost indisputable. Examples of EPI-models are found above; i) – v). Brodi et al. [4] argue for the CPE as a more realistic model of the EPI than Cp(ω) – Rp(ω). Raicu et al. [8] and Stoneman et al. [11] use a CPE alone as model to reduce the number of elements that describe the EPI. As discussed above these models can, if properly fitted to measurement data, be given similar properties at most frequencies, but at DC they fail as realistic models.
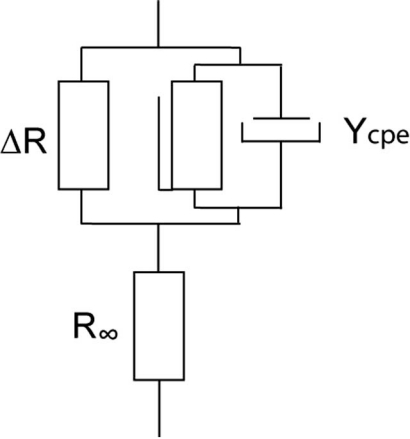
A more general model including DC conductance is obtained by adding a resistance (∆R) in parallel with the CPE. In modelling measurement data an impedance in series (R∞) with the CPE is needed to avoid a decrease towards an unrealistic zero impedance as frequency increases. Cole [14] developed his empirical equation from fitting to a large series of measurements, and it has since been widely used as a more general model for a single-dispersion system.
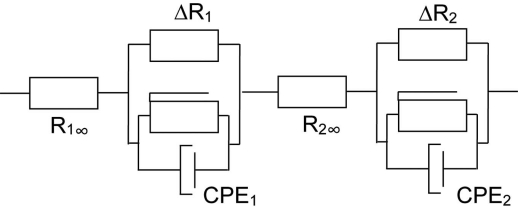
In principle a Cole-Cole (permittivity) equation [18] could also describe the EPI, but the lack of DC-conductance makes this model less suited than the Cole equation. By combining the circuit in Fig. (1) with an electric model of the measured object connected in series (e.g. Fig. 2), we have a very general model able to simulate the behaviour of most measuring setups. As a general approach we here used a system with two dispersions simulated with two Cole elements in series (Fig. 2). In principle a method suited to separate two dispersions can also be used to separate dispersions one by one in a more complex system with multiple dispersions.
Fig. (1).
This equivalent model is compatible with Cole’s empirical equation, and is commonly used to describe typical EPI properties ([1]).
Fig. (2).
Two Cole elements (subscript 1 and 2) in series used to simulate a system with two dispersions.
| (1) |
Reducing the resistances in series to one component will not influence the simulation, and we simplify by setting in Eq. 1.
Since we here used a model with two dispersions (Cole elements iii)) in series, a representation in impedance parameters (Eq. 1 and Fig. 2) is common. The impedance model parameters are converging towards their smallest modulus at high frequencies (HF – defined by ω>>τ1 and τ2). At low frequencies (LF – defined by ω<<τ1 and τ2) the impedance modulus can become very large or diverge to very high impedance at DC. An admittance model has the opposite characteristics, and converges to a finite modulus at DC. Hence, it seems like a good idea to transform the impedance parameters of the series circuit in Fig. (2) to an equivalent admittance model, which does not diverge at the frequencies where the EPI is most dominant. To evaluate a new method to extract tissue and EPI properties from a set of measurement data we have simulated the dispersions of the circuit presented in Fig. (2) in this study.
MATERIALS AND METHODS
Simulations
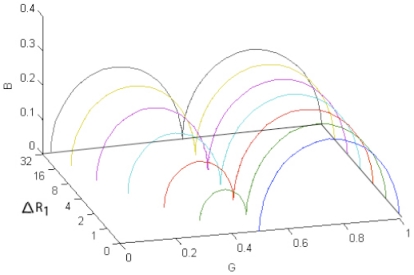
Two Cole elements in series (Fig. 2 and Eq. 1) were used as model in mathematical simulations of a general system of two dispersions. Time constants with large differences (τ1=0.00001 and τ2=1) and values of the constants in Eq. 1 were chosen to obtain two dispersions without overlap. Impedance Wessel-plots of real and imaginary component of the resulting complex impedance were made for different values of ΔR1 while the other variables were kept unchanged. Resistances in the range between 0 and 32 Ω were used in the distribution found in Fig. (5). Equivalent admittance values were calculated and compared in a similar admittance Wessel-plot with conductance (G) and suseptance (B) values on the axis. The next step was to make similar admittance Wessel-plots for different time constants in one of the CPEs while all resistance values were kept unchanged. This was done by setting τ2=1 and varying τ1 from 0.00001 to 1000 in steps of one decade.
Fig. (5).
Admittance model Wessel-plot of two dispersions for different ΔR1.
Theoretical Analysis
For a current carrying electrode the impedance of the measured tissue and the EPI is physically in series. We have here used the circuit in Fig. (2) and eq. 1 to model these two impedances as Cole-elements in series by assigning the subscript “1” for EPI and “2” for tissue. Each of the two elements will, if plotted separately, produce depressed circular arcs in the complex Wessel plane. If two or more elements are in series, the net arc will in general be a superposition of the elements, and differ from the arcs of the separate contributions. However, if the characteristic time constants of each of the elements are sufficiently different, we will retrieve separate dispersions in the Wessel plane, and thus EPI can be subtracted from measurement data without subtracting also data from the tissue under consideration. This can be shown by the following:
Assume that the characteristic time constant of tissue, τ2, differs substantially from that of the EPI, τ1 (which usually is rather high compared to τ2), i.e. that τ1>> τ2. The admittance of the two Cole elements is then given by:
| (2) |
If tissue measurements are performed in the frequency range much higher than the characteristic frequency of the EPI, and where the measurement frequency is of the order of (2πτ2)-1 the admittance then is:
| (3) |
Where we now have assumed R2∞>>R1∞, meaning that the EPI at very high frequencies can be neglected compared to the corresponding tissue impedance. This assumption is reasonable, and has earlier been shown among others in studies of EPI [1, p 266, 7] as well as in electrode modelling where the EPI is modelled so that one of the branches in the equivalent circuit is a capacitor alone, resulting in a shunt at high frequencies [1, p 50]. As the double layer between electrode and tissue is very thin, the capacitance in the EPI equivalent circuit will be very large which further reduces the influence of R1∞.
Thus, it is clear that characteristic tissue impedance data can, under the conditions described above, be found by fitting measurement data to one single Cole element without influence from EPI, or to state it differently: as if the EPI was not at all present.
Model Measurements
The EPI-correction method was tested in practice by doing measurements on a cucumber. A comparison to the simulated data was obtained by selection of a one dispersion sample influenced by EPI. From earlier measurements we have found that cucumbers display one distinct dispersion with a characteristic frequency around 50 kHz. Cucumbers are also easy to handle as a measurement object and since it can be cut in different lengths with minimal change in cross section, it is well suited for the “distance variation technique” (B in Table 1). A fresh cucumber was cut to 60 mm length. The plastic wrapping was kept on the long side to avoid the cucumber to dry out during the measurements.
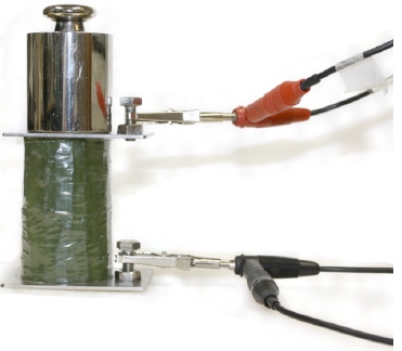
The cucumber was placed upright on the table with a stainless steel plate electrode (50 x 65 mm) covering the cross section on each end. A 500 grams weight was placed on top of the upper electrode plate to provide a firm pressure and secure stable contact at the electrode interfaces. A Solarton 1260/1294 impedance measurement system was connected in the 2-electrode setup shown in Fig. (3) and frequency sweeps from 10 mHz to 1 MHz were done with a controlled potential of 30 mV rms.
Fig. (3).
2-electrode measurement setup showing cucumber (60 mm), stainless steel electrodes (50 mm x 65 mm), weight (500 g) and connection leads.
The electrodes were given three different treatments to obtain different influence from EPI in the measurements. First sweep was with dry electrodes, the second was with saline (NaCl 0.9 %) wetted electrodes and the third was after a firm wipe of silicone high vacuum grease on the electrode surface.
RESULTS
Simulations
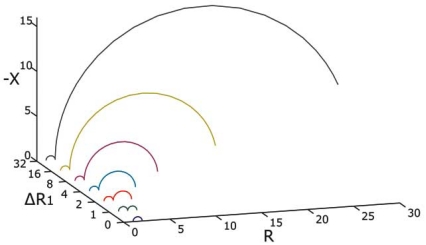
The simulations based on our model in eq. 1 gave two circular segments in the Wessel-plots as expected. For the impedance model in Fig. (4) the HF dispersion became an almost complete segment ending near the real axis on both sides. The LF segment tended to diverge towards very high values for the lowest frequencies as the ∆R1 increased. Very low simulation frequencies had to be used to determine the circular shape. We also note that the simulations produce two separate arcs as the characteristic time constants of the EPI and tissue impedance are very different.
Fig. (4).
Impedance model Wessel-plot of two dispersions plotted for different ΔR1.
For the admittance model plotted in Fig. (5) both dispersions gave almost complete segments ending close to the real axis, and as the ∆R1 increased the admittance converged towards zero at the lowest frequencies. Both dispersions could easily be fitted to a Cole segment, and subtraction of a parasitic LF can be done with enhanced precision in this model compared to the same data plotted in the impedance model (Fig. 4).
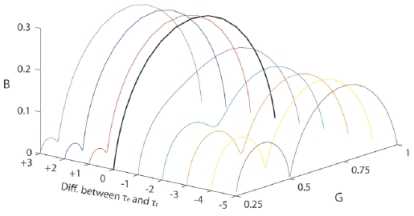
Data in Figs. (4 and 5) were simulated with time constants τ1=1 and τ2=0.00001 resulting in a 5 decades difference. The resultant admittance Wessel-plot for different values of τ1 is illustrated in (Fig. 6) (all other values chosen as the red ΔR1=2 line in (Fig. 5) and kept constant).
Fig. (6).
Admittance Wessel-plot for different values of τ1.
The dispersions melt together as the time constants become equal. Davey et al. [9] also showed this in their (Fig. 8), which corresponded to a -1 decade in time constant (purple line).
Fig. (8).
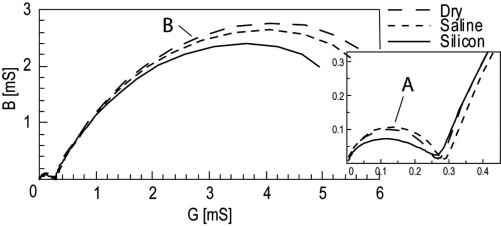
Admittance model Wessel-plot of in vitro measurement data. Segment A: EPI, Segment B: Sample. Details from the LF tail inserted.
Example Measurements
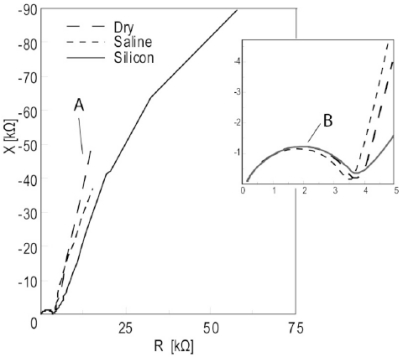
The results from the in vitro model measurements are plotted in Figs. (7 and 8). The LF segment (A) corresponding to the EPI was not possible to estimate by curve fitting to a Cole element with high accuracy in the impedance model Wessel-plot. In the admittance model Wessel-plot nearly complete arcs of circular segments were found for the A segment.
Fig. (7).
Impedance model Wessel-plot of in vitro measurement data. Segment A: EPI, Segment B: Sample. Details from the HF tail inserted.
DISCUSSION
In this paper we have shown, analytically as well as experimentally, that EPI can be separated from tissue measurements as long as the characteristic frequencies of tissue and EPI are not too close, so that the EPI is given as a separate dispersion in the Wessel plane.
EPI is a poorly controllable parasitic element with various properties. Small changes in contact area, humidity, roughness or treatment of the electrode interface can give large variations between measurements. The cucumber model has α-dispersion in about the same frequency range as found in muscle tissue in vivo [19], and a relatively frequency independent modulus and low phase angle at LF. The rigid structure and stable electric properties over time makes it very suitable as a model for reproducible measurement. By using a stable sample and three different preparations of the electrode surface, we aimed for a setup where all variations in the measurement data were caused by the variations in electrode properties causing the EPI. From interpretation of the simulations and analysis we expected the B segments in Figs. (7 and 8) to be close to identical for all three measurements. Since the admittance decreased for each measurement, the in vitro results were not in complete accordance with the expected. Since the admittance decreased chronologically and each measurement took about 50 minutes our guess is that the cucumber was affected by the storage in room temperature, and that drying of the cucumber between each measurement caused the decreased admittance.
As seen in the simulation results the LF tail converges towards a small value in the admittance model giving an enhanced accuracy during curve fitting compared to the impedance model. In the in vitro data the benefits of the admittance Wessel-plots were even more pronounced. Segment A in the impedance model (Fig. 7) almost looked like straight lines for the dry and saline wetted electrodes. If curve fitting to a circular arc can be done, the accuracy of the result will probably be very poor. The same data plotted in the admittance model (Fig. 8) gave almost complete arcs.
The admittance plots for variation in time constant (Fig. 6) illustrate the limitation due to similarity of the time constants. As the difference in time constant between the EPI and sample decreases below 2-3 decades the accuracy of our method also decreases. This is in accordance with Raicu et al. [8] and Stoneman et al. [11] who commented that separation methods will not yield if the measured sample has dispersion in the same frequency range as the EPI. Geometrical considerations should also be done. If one or more of the electrodes are small compared to the tissue surface where they are placed, there will be a constrictive zone in the tissue side of the electrode tissue interface. This constrictive zone will have an enhanced current density compared to the rest of the tissue, resulting in an increased impedance contribution from this volume [1]. Hence, the electrode and tissue geometry will be reflected in the measurement at all frequencies even if the EPI is removed. The electrode plates used in the present measurements were made larger than the cucumber cross section to secure contact over the whole cross section resulting in homogenous current density through the whole sample.
Brodi et al. [4] focused on using solely a CPE and used a Cole-Cole plot to fit their suspension data. This can be regarded as a method not far from ours. In our opinion they used a Cole-Cole permittivity equation to fit to the measurement data, and through their equations they showed that a CPE can be used to describe their results. They only indirectly used the CPE model, which would have been a straight line through origin in their permittivity plot. Since the difference in method only is the dependency of the frequency through B=ωC= ωεkg (where kg is a geometrical constant measured in meters eg. kg for a parallel plate capacitor is A/L), their method will have some of the same benefits as ours.
CONCLUSION
Converting impedances connected in series to a parallel admittance model is an effective method for estimation of EPI or other LF properties by curve fitting in Wessel-plots. The divergence towards a low value at LF in the admittance model will in most cases give an enhanced accuracy compared to a similar technique used on an impedance model. As other methods the accuracy decreases as the separation of time constants of the EPI and dispersions in the sample decreases. The method is only limited by the requirement of at least two decades difference in characteristic time constant needed for separation of the circular elements.
REFERENCES
- 1.Grimnes S, Martinsen Ø G, editors. Bioimpedance & Bioelectricity Basics. Second Edition. San Diego: Academic Press; 2008. [Google Scholar]
- 2.Schwan H P. “Linear and nonlinear electrode polarization and biological materials”. Ann. Biomed. Eng. 1992;20:269–88. doi: 10.1007/BF02368531. [DOI] [PubMed] [Google Scholar]
- 3.Gabriel S, Lau R W, Gabriel C. “The dielectric properties of biological tissues: II. Measurement in the frequency range 10 Hz to 20 GHz”. Phys. Med. Biol. 1996;41:2251–69. doi: 10.1088/0031-9155/41/11/002. [DOI] [PubMed] [Google Scholar]
- 4.Bordi F, Cametti C, Gili T. “Reduction of the contribution of electrode polarization effects in the radiowave dielectric measurements of highly conductive biological cell suspensions”. Bioelectrochem. 2001;54:53–61. doi: 10.1016/s1567-5394(01)00110-4. [DOI] [PubMed] [Google Scholar]
- 5.Schwan H P. “Alternating current electrode polarization”. Biophysik. 1966 May;3:181–201. doi: 10.1007/BF01191612. [DOI] [PubMed] [Google Scholar]
- 6.Kalvøy H, Tronstad C, Nordbotten B, Grimnes S, Martinsen Ø G. “Electrical impedance of stainless steel needle electrodes”. Ann. Biomed. Eng. 2010;38:2371–82. doi: 10.1007/s10439-010-9989-2. [DOI] [PubMed] [Google Scholar]
- 7.Mirtaheri P, Grimnes S, Martinsen Ø G. “Electrode polarization impedance in weak NaCl aqueous solutions”. IEEE Trans. Biomed. Eng. 2005;52(12) doi: 10.1109/TBME.2005.857639. [DOI] [PubMed] [Google Scholar]
- 8.Raicu V, Saibara T, Irimajiri A. “Dielectric properties of rat liver in vivo: a noninvasive approach using an open-ended coaxial probe at audio/radio frequencies”. Bioelectrochem. Bioener. 1998;47:325–32. [Google Scholar]
- 9.Davey C L, Markx G H, Kell D B. “Substitution and spreadsheet methods for analysing dielectric spectra of biological systems”. Eur. Biophys. J. 1990;18:255–65. [Google Scholar]
- 10.McAdams E T, Lackermeier A, McLaughlin J A, Macken D, Jossinet J. “The linear and non-linear electrical properties of the electrode-electrolyte interface”. Biosens. Bioelec. 1995;10:67–74. [Google Scholar]
- 11.Stoneman M R, Kosempa M, Gregory W D, Gregory C W, Marx J J, Mikkelson W, Tjoe J, Raicu V. “Correction of electrode polarization contributions to the dielectric properties of normal and cancerous breast tissues at audio/radiofrequencies”. Phys. Med. Boil. 2007;52:6589–604. doi: 10.1088/0031-9155/52/22/003. [DOI] [PubMed] [Google Scholar]
- 12.Geddes L A, Da Costa C P, Wise G. “The impedance of stainless steel electrodes”. Med. Biol. Eng. 1971;9:511–21. doi: 10.1007/BF02474708. [DOI] [PubMed] [Google Scholar]
- 13.Liu S H. “Fractal model for the ac response for a rough interface”. Phys. Rev. Lett. 1985;55:529–32. doi: 10.1103/PhysRevLett.55.529. [DOI] [PubMed] [Google Scholar]
- 14.Cole K S, Cole R H. “Dispersion and absorption in dielectrics. I. Alternating current characteristics”. J. Chem. Pys. 1941;9:341–51. [Google Scholar]
- 15.Schwan H P, Ferris C D. “Four electrode null techniques”. Rev. Sci. Instrum. 1968;39:481–5. [Google Scholar]
- 16.Grimnes S, Martinsen Ø G. “Sources of error in tetrapolar impedance measurements on biomaterials and other ionic conductors”. J. Phys. D. App. Phys. 2007;40:9–14. [Google Scholar]
- 17.Scharfetter H, Casañas R, Rosell J. “Biological tissue characterization by magnetic induction spectroscopy (MIS): Requirements and limitations”. IEEE Trans. BME. 2003;50:870–80. doi: 10.1109/TBME.2003.813533. [DOI] [PubMed] [Google Scholar]
- 18.Cole K S, Cole R H. “Dispersion and absorption in dielectrics. I. Alternating current characteristics”, J. Chem. Pys. 1941;9:341–51. [Google Scholar]
- 19.Kalvøy H, Frich L, Grimnes S, Martinsen Ø G, Hol P K, Stubbhaug A. “Impedance based tissue discrimination for needle guidance”. Physiol. Meas. 2009;30:129–40. doi: 10.1088/0967-3334/30/2/002. [DOI] [PubMed] [Google Scholar]


