Abstract
Foxp3+ regulatory T cells (Tregs) originate in the thymus, but the Treg phenotype can also be induced in peripheral lymphoid organs or in vitro by stimulation of conventional CD4+ T cells with IL-2 and TGF-β. There have been divergent reports on the suppressive capacity of these TGF-Treg cells. We find that TGF-Tregs derived from diabetes-prone NOD mice, although expressing normal Foxp3 levels, are uniquely defective in suppressive activity, whereas TGF-Tregs from control strains (B6g7) or ex vivo Tregs from NOD mice all function normally. Most Treg-typical transcripts were shared by NOD or B6g7 TGF-Tregs, except for a small group of differentially expressed genes, including genes relevant for suppressive activity (Lrrc32, Ctla4, and Cd73). Many of these transcripts form a coregulated cluster in a broader analysis of T-cell differentiation. The defect does not map to idd3 or idd5 regions. Whereas Treg cells from NOD mice are normal in spleen and lymph nodes, the NOD defect is observed in locations that have been tied to pathogenesis of diabetes (small intestine lamina propria and pancreatic lymph node). Thus, a genetic defect uniquely affects a specific Treg subpopulation in NOD mice, in a manner consistent with a role in determining diabetes susceptibility.
Foxp3+regulatory T cells (Tregs) are crucial for the maintenance of lymphoid homeostasis and self-tolerance. Several lines of evidence indicate that Tregs play an important role in controlling the development of type-1 diabetes (T1D). In the NOD mouse model, transfer of Tregs can protect from diabetes, whether in NOD mice or in T-cell receptor (TCR) transgenic systems derived therefrom (1–4). Conversely, genetic deficiencies that reduce Treg numbers result in accelerated autoimmune diabetes (1, 5).
It is now commonly recognized that there is no intrinsic defect in number or frequency of Tregs in the lymphoid organs of NOD mice (6–8). From a functional standpoint, several groups reported a slight defect in the performance of NOD Tregs in standard in vitro suppression assays (9, 10), although this was not universally observed (6, 11). In a recent report, we also found a slight defect in this assay when performed with T cells from NOD mice, but showed that the defect lies in an overactivity of NOD conventional CD4+ T cells (Tconv), rather than in the Tregs (12); similar findings were reported in human patients with T1D (13).
Most Foxp3+ Treg cells found in secondary lymphoid organs originate in the thymus, but a Foxp3+ phenotype can also result from “conversion” of mature Foxp3− CD4+ cells (Tconv) in a variety of conditions in vivo: chronic suboptimal stimulation by agonist peptide, exposure to agonist administered orally, during lymphopenia-driven homeostatic expansion, or in response to infection with helminths (14–18). These Tregs induced in vivo (iTreg) cells were as effective as ex vivo Tregs in several functional assays. They were also quite similar to, although distinguishable from, bulk Tregs from lymphoid organs in regard to their transcriptional signatures (17). The gut-associated lymphoid tissue may be a privileged site for peripheral induction of Foxp3+ Tregs, perhaps promoted by TGF-β and retinoic acid produced by gut-associated dendridic cells (DCs) (19–21), although this preferential conversion in the gut is not necessarily the rule (15, 22). Recent observations indicate that gut microbes may also elicit particular populations of Foxp3+ Tregs (23).
Besides in vivo-generated iTregs, Foxp3+ Tregs can be induced in vitro by TCR-mediated activation of naive T cells in the presence of TGF-β and IL-2 (24) (hereafter “TGF-Tregs”). There has been some debate as to the functionality and relevance of these in vitro-generated Foxp3+ cells. Although they show robust Foxp3 expression, it is very unstable because of, or reflected by, incomplete CpG demethylation at the Foxp3 locus (25). In addition, TGF-Tregs lack a fraction of the signature genes that distinguish Treg cells (26). From a functional standpoint, radically different results have been reported for TGF-Tregs, ranging from highly efficacious (24, 27–29) to largely ineffective (25, 26). In our hands, very little suppressive activity could be found with TGF-Tregs derived from our diabetes-related experimental mice (whether transgenic or nontransgenic) (26).
However, quite serendipitously, we found that these results could be ascribed to the genetic background: Whereas TGF-Tregs derived from NOD mice were functionally very inefficient, parallel cultures from other genetic backgrounds yielded very effective TGF-Tregs. Follow-up functional and genetic analyses revealed a defect in NOD Treg function that was not apparent from the analysis of bulk lymphoid Tregs, but that may be important in a Treg subpopulation functionally relevant for controlling the autoimmune response.
Results
NOD-Derived TGF-Tregs Are Functionally Impaired.
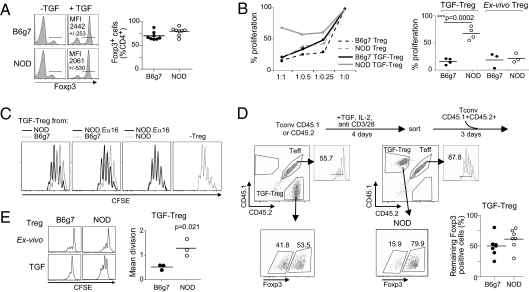
As introduced above, contradictory findings regarding the functionality of in vitro-induced TGF-Tregs have been reported. While continuing to investigate putative defects in NOD Tregs, we made an observation that may account for certain of these discrepancies. As our studies focus on T1D, we always used T cells derived from mice of the NOD genetic background. However, comparing donors of two genetic backgrounds in the same experiment yielded the surprising result depicted in Fig. 1. Carefully sorted CD25− naive Tconv cells from NOD and B6.H2g7 (B6g7) mice were activated in parallel with anti-CD3/28 beads, IL-2, and TGF-β, under standard conditions for Foxp3 induction (24). Foxp3 expression was induced by TGF-β with very similar efficacy, measured as either the fraction of Foxp3+ cells or the mean Foxp3 expression level (Fig. 1A). These TGF-Tregs were then tested in a standard in vitro suppression assay for their ability to inhibit the proliferation of naive CD4+ T cells activated with anti-CD3 monoclonal antibody (mAb), uncovering a strong disparity in functional activity. TGF-Tregs from B6g7 mice were quite effective in this suppression assay, but analogous cells from NOD mice were not; ex vivo Tregs from both origins were equally effective in our and others’ previous results (Fig. 1B). The TGF-Tregs derived from the NOD.Eα16 strain, genetically identical to NOD mice but protected from insulitis by an MHC class II Eα transgene, were also inefficient suppressors (Fig. 1C), indicating that the functional defect in NOD TGF-Tregs does not reflect a secondary effect of autoimmunity. The defect was observed irrespective of the source of T-cell targets (Fig. S1).
Fig. 1.
Lower functional efficacy of TGF-Tregs from NOD mice. (A) Foxp3 staining of naive T cells from NOD and B6g7 mice cultured in absence (−TGF) or presence of TGF-β (+TGF). Mean fluorescence intensity (MFI) was calculated. (B) Proliferation of T effector cells (Teff) at titrated ratio Treg:Teff as tested in thymidine incorporation assays, in presence of NOD or B6g7 TGF-Treg and respective ex vivo Tregs. (Right) Compilation of results from four independent experiments at ratio 1:1 Treg:Teff. (C) Proliferation of Teffs in presence of B6g7, NOD, or NOD.Eα16 TGF-Tregs (n = 3). (D) NOD (CD45.1+) or B6g7 (CD45.2+) naive Tconv cells were cultured in presence of IL-2, anti-CD3/28–coated beads, and TGF-β. After 4 d, Foxp3+ cells were sorted and cultured with CD45.1+CD45.2+ (NOD × B6g7) F1 Teffs that were CFSE labeled. Proliferation of Teffs was analyzed 3 d later. The percentage of remaining NOD and B6g7 TGF-Treg Foxp3+ cells was calculated. (E) Proliferation of anti-CD3/28–activated NOD and B6g7 TGF-Tregs and respective ex vivo Tregs measured by CFSE dilution. Mean division was calculated (n = 3).
Because Foxp3 expression is usually unstable in TGF-Tregs, we asked whether a differential Foxp3 stability might account for the functional difference observed. This was not the case as Foxp3 expression was, if anything, more stable in NOD than in B6g7 TGF-Tregs when assayed in cocultures with target cells 72 h after removal of TGF-β (Fig. 1D).
TGF-Tregs, just like ex vivo Tregs, are usually anergic in vitro, most likely because of their inability to produce the IL-2 they require. Interestingly, this was not the case for TGF-Tregs derived from NOD mice. Whereas ex vivo NOD Tregs were largely unresponsive to stimulation with anti-CD3/28 beads and IL-2, as were both ex vivo Tregs and TGF-Tregs from B6g7 donors, NOD TGF-Tregs proliferated vigorously in response to TCR restimulation (Fig. 1E).
Thus, whereas Tregs from lymphoid organs of NOD mice are indistinguishable from their counterparts from other strains, NOD TGF-Treg cells could be distinguished by their poor suppressor activity and by an absence of in vitro anergy (the two likely being connected, as it stands to reason that a cell population that actively proliferates is unlikely to be a good suppressor). This trait was peculiar to NOD mice, as TGF-Tregs from BALB/c mice behaved like B6g7 in this respect (Fig. S2).
Gene-Expression Abnormalities Underlying Defective NOD TGF-Treg Function.
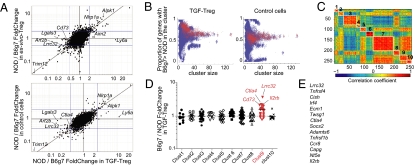
Given the striking difference in the suppressive capabilities of TGF-Tregs derived from NOD vs. B6g7 mice, we compared their transcriptomes, asking whether a discernable difference in transcript representation might explain the functional defect of NOD TGF-Tregs. Naive CD4+ Tconv cells from 6- to 8-wk-old NOD and B6g7 mice were converted to Foxp3 positivity with IL-2, anti-CD3/28, and TGF-β; after 4 d of culture, Foxp3+ cells were sorted and RNA was extracted and amplified for hybridization to Affymetrix ST1.0 microarrays (three independent replicates). The transcription profiles of cells from two inbred strains can differ quite considerably but, because ex vivo Tregs from the two strains showed similar functional competence, we could focus our search on transcripts that differed between TGF-Tregs but not between ex vivo Tregs. Fig. 2A plots the ratios of expression in NOD vs. B6g7 regulatory cells, for TGF-Tregs (x axis) vs. ex vivo Tregs (y axis). As expected, the profiles were similar overall, most transcripts lining up along the diagonal, indicative of differences present in both cell types. On the other hand, several transcripts did stand out as uniquely differential in NOD vs. B6g7 TGF-Tregs, including transcripts overrepresented in B6 TGF-Tregs such as Lgals3, Art2b, or Lrrc32 or, conversely, overrepresented in NOD TGF-Tregs (Ly6a, Aim2). Most of the differentially expressed transcripts also stood out in a second analysis, comparing of NOD/B6g7 ratios in TGF-Treg and in control cells (activated with anti-CD3/28 beads and IL-2 but without TGF-β; Fig. 2A, Lower). Of the highlighted transcripts, the most intriguing were Lrrc32, Cd73, and Ctla4, given their contribution to Treg function (30–32). As might be expected, a number of these genes belong to the “Treg signature,” a set of transcripts that distinguishes Tregs from Tconvs (26).
Fig. 2.
Differential gene expression in NOD and B6g7 TGF-Tregs. (A) Fold change/fold change plot depicting the NOD/B6g7 ratio of expression for TGF-Tregs (x axis) and for ex vivo Tregs (y axis, Upper) or control cells cultured in absence of TGF-β (y axis, Lower). (B) k-means clustering on the Treg signature for k ranging from 5:30 with 100 repetitions each. Clusters are depicted as a dot, and red dots denote the clusters that include Lrrc32. The plots show the proportion of genes with B6g7 > NOD expression in TGF-Tregs and in control cells as a function of cluster size. (C) Cluster analysis of expression correlation between Treg signature genes (258 genes), clustered by a k-mean cluster algorithm. Red represents positive correlation and blue negative correlation; a representative clustering result for k = 10 is shown. Each cluster is identified with a number from 1 to 10. (D) NOD/B6g7 ratio of expression for TGF-Tregs for each cluster (1–10) as shown in B. (E) List of transcripts most often associated with the Lrrc32 cluster, whose expression ratio for B6g7/NOD TGF Tregs is >1.5 fold.
These differences might be due to genetic variation acting independently in cis on each locus. Alternatively, the differences might reflect the differential activity in NOD of an upstream regulator(s) that would control the transcription of a defined gene cluster in TGF-Tregs. If the latter, one might expect that this cluster of coregulated genes would show correlated expression in other contexts as well. To test this notion, we performed a computational cluster analysis of Treg signature genes, using as data a large compilation of 178 microarray datasets from T lymphocytes at different stages of differentiation. This data group was compiled by assembling gene-expression profiles from T cells in several unrelated projects in our laboratory (Foxp3+ and Foxp3−), together with the αβ T-cell datasets from the ImmGen consortium (33) (see Table S1 for a listing of these datasets). Genes belonging to the Treg signature (305 up-regulated genes) were clustered using a k-means clustering algorithm, where repeated probes for genes were removed. Because the results of partitioning clustering such as k-means are dependent on the arbitrary choice of a k-factor and on the initial cluster centroids, we used a strategy based on 100 iterations of the algorithm, with random starting points for cluster centroids and k ranging from 5 to 30. For each resulting cluster, we computed the proportion of genes with B6g7 > NOD expression in TGF-Tregs and in control cells. The results are depicted in Fig. 2B, where each cluster is shown as a dot, and red dots denote the clusters that include Lrrc32, taken as an indicator. This strategy clearly identified a dominant gene cluster that included Lrrc32, which had biased expression in TGF-Tregs (Fig. 2B, Left) but not in control cultures for clusters of size 10–40 (Fig. 2B, Right). Fig. 2 C and D represents one such typical cluster solution, and the identities of the transcripts most often associated with the Lrrc32 cluster and whose B6g7/NOD ratio of expression in TGF-Tregs is >1.5 are listed in Fig. 2E. In this representation, the cluster's average B6g7/NOD ratio for TGF-Tregs was 1.54 (P < 0.0001, one-sample t test). None of the other clusters in either this clustering run or the runs in Fig. 2B showed a significantly biased distribution in this respect. Cluster 9 contains the main genes of interest with known ties to Treg physiology: Lrrc32, Cd73, Ctla4, and Il2rb (Fig. 2D). Thus, this analysis revealed the existence of a cluster of genes that tend to be coregulated throughout T-cell differentiation and whose expression was specifically defective in TGF-Tregs from NOD mice.
Validation of the Differentially Expressed Cluster.
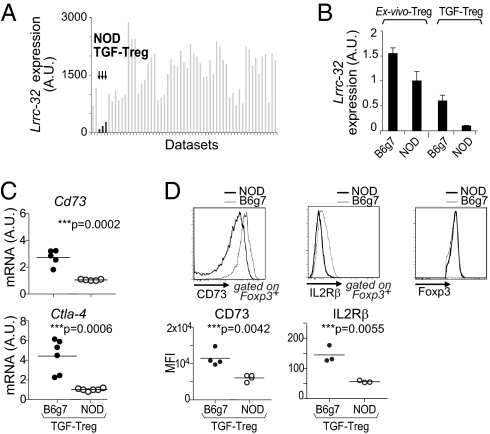
We then turned to validate the functional relevance of the members of the coregulated cluster. One of the transcripts most differentially expressed by TGF-Tregs was Lrrc32, which encodes GARP, a membrane protein expressed by human Tregs but not Tconvs (30, 34, 35). GARP associates with the latent TGF-β (LAP) complex and functions as a LAP-presenting molecule. It may be involved in the delivery of TGF-β during immunoregulation, and RNAi knockdown has demonstrated partaking in the suppressive activity of ex vivo Tregs (30). Close examination of Lrrc32 expression across a wide set of microarray profiles from diverse populations of Foxp3+ cells showed that the deficit in Lrrc32 was exclusive to NOD TGF-Tregs (Fig. 3A; see Table S2 for a listing of these datasets; all those cells showed comparable levels of Foxp3). We confirmed by quantitative real-time PCR (qPCR) the lower expression of Lrrc32 in NOD relative to B6 TGF-Tregs; a much more modest reduction was observed in ex vivo Tregs from spleen (Fig. 3B). We also confirmed by qPCR and flow cytometry the lower expression of other members of the Lrrc32 cluster such as Cd73, Ctla4, and Il2rb in NOD vs. B6 TGF-Tregs in cells that expressed the same amount of Foxp3 (Fig. 3 C and D).
Fig. 3.
NOD TGF-Tregs express lower levels of GARP. (A) Lrrc32 expression shown as arbitrary units (A.U.) across Foxp3+ T-cell microarray datasets. (B) Lrrc32 mRNA levels in NOD vs. B6g7 TGF-Tregs and respective ex vivo Tregs quantified by qPCR. (C) Cd73 and Ctla-4 mRNA levels in NOD vs. B6g7 TGF-Tregs quantified by qPCR. (D) Levels of CD73, IL2rb, and Foxp3 expressed by NOD or B6g7 TGF-Tregs and quantified as MFI (Lower).
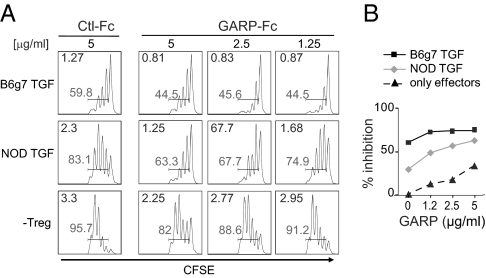
The lower expression of GARP by NOD TGF-Tregs could be directly relevant to their impaired suppressive activity, given the reported function of GARP as a TGF-β–carrier/presenting protein (34, 35). Thus, we asked whether provision of GARP might revert the functional deficit in NOD TGF-Tregs. Treg/Teffector test cultures were supplemented with soluble GARP-Fc chimeric protein or with control Fc protein. Addition of GARP-Fc during the suppression assay markedly increased the functionality of NOD TGF-Tregs, which became almost as effective as B6 TGF-Tregs (Fig. 4A). This dose-dependent effect of GARP-Fc was more marked in NOD than in B6 TGF-Tregs, whose activity tended to plateau (Fig. 4B). Thus, GARP-Fc partially complements the functional deficit of NOD TGF-Tregs, an effect we attribute to increased TGF-β presentation.
Fig. 4.
Effect of GARP-Fc recombinant protein in suppression assay. (A) Proliferation of CFSE-labeled Teffs at ratio 1:1 with NOD or B6g7 TGF-Tregs in absence (Ctl-Fc) or presence of GARP-Fc protein. The percentage of proliferating cells (shaded numbers) and mean division (upper left of each graph) are calculated. (B) Quantification of Teffs inhibition by NOD or B6g7 TGF-Tregs in presence of an increasing amount of GARP.
Origin of the Lrrc32 Cluster Defect in NOD TGF-Tregs.
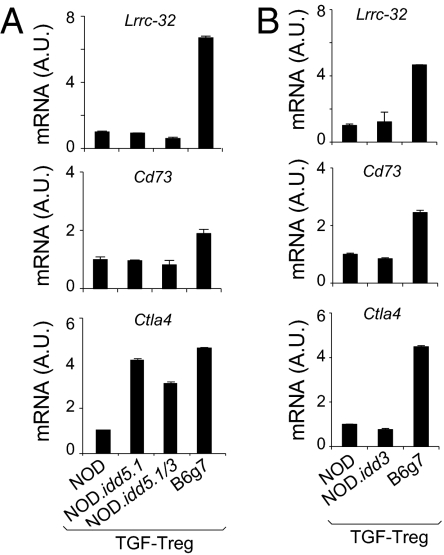
We next attempted to track the root of Lrrc32 cluster deficiency in TGF-Tregs from NOD mice. Immediate candidates were the diabetes-susceptibility regions idd3 and idd5. Idd5 includes Ikzf2 (Helios, a transcription factor that has been associated with Treg) (36) and Ctla4, which itself shows differential B6g7 vs. NOD expression in TGF-Tregs. Idd3 encodes Il2 and Il21 and has been strongly implicated in Treg function (37). The levels of Lrrc32, Cd73, and Ctla4 were quantitated by qPCR in TGF-Tregs derived from NOD, B6g7, and congenic mice (NOD.idd3 and two different NOD.idd5s) that carry the idd3 or the idd5 allele from B6g7 mice on the NOD background (38, 39). TGF-Tregs from all congenic mice exhibited the same low levels of Lrrc32 and Cd73 as NOD TGF-Tregs, indicating that the trans-control elements do not map to either idd3 or idd5 (Fig. 5). A more complex picture emerged for Ctla4. NOD-like low levels were detected in NOD.idd3 TGF-Tregs, consistent with Cd73 and Lrrc32 profiles. On the other hand, NOD.idd5 congenic mice showed a higher level of Ctla4 mRNA, similar to that of B6g7. Thus, whereas the Ctla4 locus is influenced by the same transregulator(s) as other members of the Lrrc32 cluster, this influence is also mitigated by cis-acting genetic interactions that overcome the trans-regulatory control. There have been discordant reports of cis control of Ctla4 levels (40–43), and it is quite possible that the balancing influences mapped here may account for some of the previous observations.
Fig. 5.
The defect of the Lrrc32 cluster in NOD TGF-Tregs does not map to idd5 and idd3 regions. (A and B) Levels of Lrrc32, Cd73, and Ctla4 assessed by qPCR in NOD, B6g7, NOD.idd5.1, and NOD.Idd5.1/3 TGF-Tregs (A) and NOD.idd3 TGF-Tregs (B).
Underexpression of the Lrrc32 Cluster in NOD Cells: In Vivo Relevance.
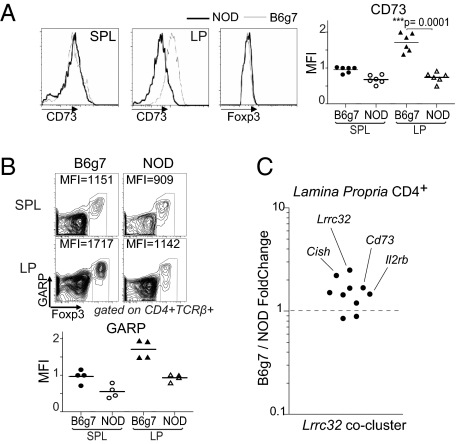
It was then important to determine whether any NOD Treg populations in vivo, defined by subphenotype or anatomical location, might have a functional defect similar to what we found for NOD TGF-Tregs. It is not clear which cell population, if any, is the in vivo counterpart of in vitro-generated TGF-Tregs. It has been argued that TGF-Tregs may represent Foxp3+ cells generated in the gut, under conditions of high levels of TGF-β and retinoic acid, reasoning that such conversion may be important to control the inflammatory response at a site that is continuously exposed to microbial stimuli (19–21). Direct support for this notion came from observations that mutation of a conserved noncoding DNA sequence in the Foxp3 promoter that dampened Foxp3 induction by TGF-β mainly affected the proportion of Foxp3+ Tregs in gut-associated lymphoid tissues (44). Because direct functional analysis of lamina propria (LP) Tregs was essentially impossible because of limitations in cell numbers, we tested the expression of the Lrrc32 cluster as a surrogate. Flow cytometric analysis revealed a clear deficit in CD73 expression in NOD LP CD4+Foxp3+ cells (Fig. 6A). These differences were independent of Foxp3 expression levels, which were similar for NOD and B6g7 LP cells. In contrast, CD73 was equivalently expressed in the spleen of both strains. Similarly, we found a reduced expression of GARP by CD4+Foxp3+ cells (after short activation) for the LP of NOD mice; in this case, a more modest deficit in GARP expression was also apparent for splenic Tregs (Fig. 6B). To attempt to generalize these observations, we analyzed the expression of the set of genes from the Lrrc32 cluster in LP CD4+ T cells (in total CD4+ cells because it is essentially impossible to rigorously purify sufficient LP Foxp3+ cells for expression profiling, even with our optimized protocols). NOD LP CD4+ T cells had a lower expression of many of the Lrrc32 cluster genes relative to their B6 counterpart cells, most notable for Lrrc32 itself but also for others such as the suppressor of cytokine signaling, Cish (Fig. 6C).
Fig. 6.
GARP-cluster expression in LP. (A) Expression of CD73 on gated CD4+Foxp3+ cells isolated from spleen and LP of NOD and B6g7 mice. (Right) Compilation of data from independent experiments. (B) Cells isolated from spleen and LP of NOD and B6g7 mice were activated for 12 h in presence of anti-CD3 and then stained for Foxp3 and GARP. Numbers in dot plots indicate MFI calculated on Foxp3+ cells. GARP levels were expressed as MFI values normalized on spleen (n = 4, Lower). (C) Ratio of expression for B6g7 vs. NOD lamina propria CD4+ T cells of Lrrc32 cluster genes.
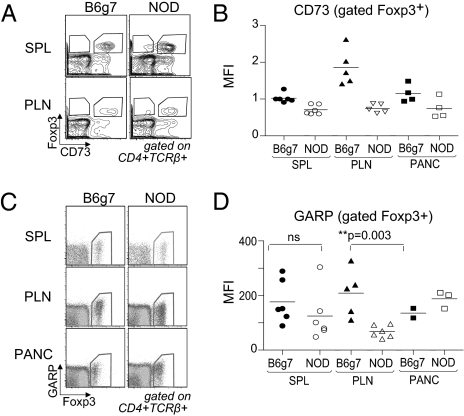
Finally, we asked whether the expression deficit of the Lrrc32 cluster in LP Tregs might also extend to locations key to the pancreatic autoimmunity characteristic of the NOD strain, the pancreatic lymph node (PLN) and the islet infiltrate. Indeed, several studies have suggested a link between the gut immune system and islet-infiltrating lymphocytes (45). For instance, islet-infiltrating lymphocytes in the NOD pancreas express the α4β7 integrin, a gut homing receptor. In addition, a preferential trafficking route from the peritoneal cavity and gut to the PLN has been demonstrated (46). To compare insulitis on both genetic backgrounds, we used BDC2.5 transgenic mice, which have a T-cell repertoire skewed for a TCR reactive against a pancreatic autoantigen, which results in profound autoimmune infiltration of the pancreas of both the NOD and the B6g7 backgrounds. BDC2.5/NOD and BDC2.5/B6g7 male mice were analyzed between 21 and 25 d of age. Interestingly, NOD Foxp3+ Tregs showed a reduced level of CD73 and GARP especially in the PLN, a key site for the presentation of islet cell antigen (Fig. 7).
Fig. 7.
CD73 and GARP expression by FoxP3+ Tregs at the sites of inflammation. (A) CD73 and Foxp3 expression on gated CD4+TCR-β+ T cells isolated from spleen and PLN of BDC2.5.NOD and BDC2.5.B6g7 mice. (B) Levels of CD73 in spleen, PLN, and pancreas were quantified as MFI from three independent experiments. (C) Flow cytometry of GARP and Foxp3 expression among gated CD4+TCRβ+ cells from spleen, PLN, and pancreas of BDC2.5.NOD and BDC2.5.B6g7 mice. (D) Levels of GARP, indicated as MFI on gated Foxp3+ T cells.
Discussion
In exploring reports of the varying functional efficacy of TGF-β–induced Foxp3+ cells, this study arrived at two important conclusions. First, genetic variation can markedly influence the functional activity of TGF-Tregs through the differential activation of a coregulated cluster of suppressive genes, which likely accounts for the contradictory results reported by certain groups. Second, there is a focalized defect in a subphenotype of Tregs in the autoimmune-prone NOD strain, one whose tissular distribution is consistent with a causative involvement in autoimmune susceptibility.
It has still not been established what proportion of the gut Treg pools is composed of locally generated iTregs, rather than reflecting the local accumulation and phenotypic alteration of thymus-derived cells. The gut is certainly the location where conversion is likely to occur most effectively, due to supportive DC populations and high TGF-β and retinoic acid concentrations. The present observations, showing parallel genetic defects in TGF-Treg and LP Treg pools from NOD mice, are consistent with the notion that the proportion of iTregs in the gut may indeed be substantial.
NOD mice are susceptible not solely to type-1 diabetes, but also to several other autoimmune conditions such as thyroiditis, sialitis, or a particularly aggressive form of the disease elicited by Aire deficiency including lethal exocrine pancreatitis (47). Although there is evidence for a central tolerance defect in NOD mice (48), such generic autoimmune susceptibility is also consistent with lower efficacy of peripheral tolerance mechanisms, in particular Foxp3+ Treg cells. It is now clear that there are no overall defects in the thymic selection and total numbers of Tregs in the secondary lymphoid organs of NOD mice and, like Tang et al. (8), we observed no global changes over time related to progression toward diabetes. The present results highlight a quite focal defect, not visible in bulk Treg populations, but only after TGF-β–enhanced conversion in vitro and in particular locales in vivo. This deficit is not one of numbers, but rather rests in the expression of a set of molecules important for immunoregulatory function. The locations where the defect is manifest (the PLN and the gut) are suggestive of an association between this NOD-specific defect in Treg function and susceptibility to autoimmunity, not only to diabetes but also to exocrine pancreatitis, given the aforementioned connections between the gut and pancreatic immune systems. That the defect is manifest only in these locations suggests that Treg cells do not recirculate from there back to lymphoid organs, at least not in sizeable numbers. However, it should be acknowledged that this association is only a correlation at this stage. Unfortunately, none of the genetic manipulation tools in hand allow us to experimentally test this connection (i.e., no factor has been shown to be required by all iTreg cells and only by them).
At a practical level, these results imply that explorations of human Treg function must be evaluated with caution: The in vitro suppression assay performed on bulk Tregs from lymphoid organs or blood yields only a restricted window on the activity of the entire Treg population and is likely to miss focal perturbations in cell pools that may be more directly relevant to disease. Thus, more specific analyses of human patients will be necessary. Suggestively, Badami et al. observed a reduced frequency of Foxp3+ Tregs in duodenal biopsies from T1D patients (49). Whereas this result is not exactly superimposable on our data (numbers rather than function), they do support the notion that broad explorations of Treg subphenotypes will be necessary and that the defect in NOD iTregs may have a counterpart in human diabetes.
From a molecular standpoint, what accounts for the defective function of TGF-Tregs? The comparative gene-expression profile revealed not one but several highly valid candidates, and it seems likely that the combined deficit, rather than any single one, explains the deficiency. That NOD alleles of several genes would all have cis-acting sequence variation resulting in reduced expression in the specific context of TGF-Tregs seemed rather implausible, a view supported by the observation of a coregulated gene cluster that includes many of the NOD/B6 differentially expressed genes. Thus, NOD mice would have a defective controlling factor or pathway particularly called upon during the induction phase of the TGF-Tregs and in gut Treg subphenotypes. It is quite striking that this cluster includes a veritable “bouquet” of molecules directly relevant to Treg suppressive activity, each representing different mechanisms of action (inhibitory costimulation, TGF-β signaling, and purinergic inhibition). Coregulation of genes that partake in a concerted pathway is a common theme in biological regulation, and it is interesting that distinct immunoregulatory pathways would be coordinated in this manner in the transcriptional control of T cells.
It will be important to identify the cause of the iTreg-specific underexpression of the Lrrc32 cluster. Foxp3 itself is not a candidate, as it is equivalently expressed in NOD and B6g7 mice and is not coregulated with the Lrrc32 cluster. Helios (encoded by Ikzf2) was an attractive candidate because it actually maps to the idd5 diabetes-susceptibility region. However, we excluded Ikzf2 (and idd5), as well the idd3 locus, which has also been implicated in Treg function, because NOD.idd5 and NOD.idd3 congenic mice exhibited defective TGF-Tregs and the same low level of GARP as NOD mice.
One might also speculate that there is a molecular relationship between this Treg phenotype and the overreactivity of mature CD4+ Tconv cells, manifest as increased phosphorylation cascades immediately downstream of TCR engagement and more robust proliferation (12, 50). NOD Tconv cells might keep a “molecular memory” of these robust responses, with an inefficient induction of the Lrrc32 cluster, even while Foxp3 is normally induced. Indeed, NOD TGF-Tregs fail to establish the usual trait of in vitro anergy. Thus, one might speculate that an altered balance of signaling downstream of the TCR results in increased proliferation on the one hand and in lower activation of the pathway controlling the Lrrc32 cluster on the other. It is easy to envisage that such a dual imbalance would lead to increased susceptibility to autoimmunity.
Materials and Methods
Mice.
NOD/LtDOI (NOD), NOD.Eα16, C57BL/6.H2g7 (B6g7), BDC2.5/NOD, and BDC2.5/B6g7 TCR transgenic mice were maintained in specific pathogen-free facilities at Harvard Medical School (Institutional Animal Care and Use Committee 99–20, 02954). NOD.idd3 and NOD.idd5 were purchased from Taconic.
Cell Sorting and Flow Cytometry.
Flow cytometric analysis was performed as previously described (26) and is discussed in SI Materials and Methods.
In Vitro Conversion Assay.
In vitro Foxp3+ converted cells were generated as described (26) and as detailed in SI Materials and Methods.
In Vitro Suppression Assay.
In vitro suppression assay was performed as previously described (12) and details are given in SI Materials and Methods.
Gene Expression Analysis.
RNA was prepared as described (26). Details are provided in SI Materials and Methods.
Supplementary Material
Acknowledgments
We thank K. Hattori for assistance with mice, J. LaVecchio and G. Buruzala for help with flow cytometry, and J. Ericson for microarrays. Interpretation of results benefited from data assembled by the ImmGen consortium (33). This work was supported by Grant 4-2007-1057 from the Juvenile Diabetes Research Foundation, including the use of the Manipulated NOD mouse Core of the Juvenile Diabetes Research Foundation Center at Harvard, and by Grant R01 5R37AI051530 from the National Institute of Allergy and Infectious Diseases (to C.B. and D.M.). A.M.D. was supported by a mentor-based postdoctoral fellowship from the American Diabetes Association (7-07-MN-07).
Footnotes
The authors declare no conflict of interest.
This article contains supporting information online at www.pnas.org/lookup/suppl/doi:10.1073/pnas.1105364108/-/DCSupplemental.
References
- 1.Salomon B, et al. B7/CD28 costimulation is essential for the homeostasis of the CD4+CD25+ immunoregulatory T cells that control autoimmune diabetes. Immunity. 2000;12:431–440. doi: 10.1016/s1074-7613(00)80195-8. [DOI] [PubMed] [Google Scholar]
- 2.Tarbell KV, Yamazaki S, Olson K, Toy P, Steinman RM. CD25+ CD4+ T cells, expanded with dendritic cells presenting a single autoantigenic peptide, suppress autoimmune diabetes. J Exp Med. 2004;199:1467–1477. doi: 10.1084/jem.20040180. [DOI] [PMC free article] [PubMed] [Google Scholar]
- 3.Tang Q, et al. In vitro-expanded antigen-specific regulatory T cells suppress autoimmune diabetes. J Exp Med. 2004;199:1455–1465. doi: 10.1084/jem.20040139. [DOI] [PMC free article] [PubMed] [Google Scholar]
- 4.Herman AE, Freeman GJ, Mathis D, Benoist C. CD4+CD25+ T regulatory cells dependent on ICOS promote regulation of effector cells in the prediabetic lesion. J Exp Med. 2004;199:1479–1489. doi: 10.1084/jem.20040179. [DOI] [PMC free article] [PubMed] [Google Scholar]
- 5.Chen Z, Herman AE, Matos M, Mathis D, Benoist C. Where CD4+CD25+ T reg cells impinge on autoimmune diabetes. J Exp Med. 2005;202:1387–1397. doi: 10.1084/jem.20051409. [DOI] [PMC free article] [PubMed] [Google Scholar]
- 6.Mellanby RJ, Thomas D, Phillips JM, Cooke A. Diabetes in non-obese diabetic mice is not associated with quantitative changes in CD4+ CD25+ Foxp3+ regulatory T cells. Immunology. 2007;121:15–28. doi: 10.1111/j.1365-2567.2007.02546.x. [DOI] [PMC free article] [PubMed] [Google Scholar]
- 7.Feuerer M, et al. Enhanced thymic selection of FoxP3+ regulatory T cells in the NOD mouse model of autoimmune diabetes. Proc Natl Acad Sci USA. 2007;104:18181–18186. doi: 10.1073/pnas.0708899104. [DOI] [PMC free article] [PubMed] [Google Scholar]
- 8.Tang Q, et al. Central role of defective interleukin-2 production in the triggering of islet autoimmune destruction. Immunity. 2008;28:687–697. doi: 10.1016/j.immuni.2008.03.016. [DOI] [PMC free article] [PubMed] [Google Scholar]
- 9.You S, et al. Autoimmune diabetes onset results from qualitative rather than quantitative age-dependent changes in pathogenic T-cells. Diabetes. 2005;54:1415–1422. doi: 10.2337/diabetes.54.5.1415. [DOI] [PubMed] [Google Scholar]
- 10.Gregori S, Giarratana N, Smiroldo S, Adorini L. Dynamics of pathogenic and suppressor T cells in autoimmune diabetes development. J Immunol. 2003;171:4040–4047. doi: 10.4049/jimmunol.171.8.4040. [DOI] [PubMed] [Google Scholar]
- 11.Thomas DC, Mellanby RJ, Phillips JM, Cooke A. An early age-related increase in the frequency of CD4+ Foxp3+ cells in BDC2.5NOD mice. Immunology. 2007;121:565–576. doi: 10.1111/j.1365-2567.2007.02604.x. [DOI] [PMC free article] [PubMed] [Google Scholar]
- 12.D'Alise AM, et al. The defect in T-cell regulation in NOD mice is an effect on the T-cell effectors. Proc Natl Acad Sci USA. 2008;105:19857–19862. doi: 10.1073/pnas.0810713105. [DOI] [PMC free article] [PubMed] [Google Scholar]
- 13.Schneider A, et al. The effector T cells of diabetic subjects are resistant to regulation via CD4+ FOXP3+ regulatory T cells. J Immunol. 2008;181:7350–7355. doi: 10.4049/jimmunol.181.10.7350. [DOI] [PMC free article] [PubMed] [Google Scholar]
- 14.Apostolou I, von Boehmer H. In vivo instruction of suppressor commitment in naive T cells. J Exp Med. 2004;199:1401–1408. doi: 10.1084/jem.20040249. [DOI] [PMC free article] [PubMed] [Google Scholar]
- 15.Kretschmer K, et al. Inducing and expanding regulatory T cell populations by foreign antigen. Nat Immunol. 2005;6:1219–1227. doi: 10.1038/ni1265. [DOI] [PubMed] [Google Scholar]
- 16.Curotto de Lafaille MA, et al. Adaptive Foxp3+ regulatory T cell-dependent and -independent control of allergic inflammation. Immunity. 2008;29:114–126. doi: 10.1016/j.immuni.2008.05.010. [DOI] [PubMed] [Google Scholar]
- 17.Feuerer M, et al. Genomic definition of multiple ex vivo regulatory T cell subphenotypes. Proc Natl Acad Sci USA. 2010;107:5919–5924. doi: 10.1073/pnas.1002006107. [DOI] [PMC free article] [PubMed] [Google Scholar]
- 18.Finney CA, Taylor MD, Wilson MS, Maizels RM. Expansion and activation of CD4(+)CD25(+) regulatory T cells in Heligmosomoides polygyrus infection. Eur J Immunol. 2007;37:1874–1886. doi: 10.1002/eji.200636751. [DOI] [PMC free article] [PubMed] [Google Scholar]
- 19.Coombes JL, et al. A functionally specialized population of mucosal CD103+ DCs induces Foxp3+ regulatory T cells via a TGF-beta and retinoic acid-dependent mechanism. J Exp Med. 2007;204:1757–1764. doi: 10.1084/jem.20070590. [DOI] [PMC free article] [PubMed] [Google Scholar]
- 20.Mucida D, et al. Oral tolerance in the absence of naturally occurring Tregs. J Clin Invest. 2005;115:1923–1933. doi: 10.1172/JCI24487. [DOI] [PMC free article] [PubMed] [Google Scholar]
- 21.Sun CM, et al. Small intestine lamina propria dendritic cells promote de novo generation of Foxp3 T reg cells via retinoic acid. J Exp Med. 2007;204:1775–1785. doi: 10.1084/jem.20070602. [DOI] [PMC free article] [PubMed] [Google Scholar]
- 22.Nishio J, Feuerer M, Wong J, Mathis D, Benoist C. Anti-CD3 therapy permits regulatory T cells to surmount T cell receptor-specified peripheral niche constraints. J Exp Med. 2010;207:1879–1889. doi: 10.1084/jem.20100205. [DOI] [PMC free article] [PubMed] [Google Scholar]
- 23.Atarashi K, et al. Induction of colonic regulatory T cells by indigenous Clostridium species. Science. 2011;331:337–341. doi: 10.1126/science.1198469. [DOI] [PMC free article] [PubMed] [Google Scholar]
- 24.Chen W, et al. Conversion of peripheral CD4+CD25- naive T cells to CD4+CD25+ regulatory T cells by TGF-beta induction of transcription factor Foxp3. J Exp Med. 2003;198:1875–1886. doi: 10.1084/jem.20030152. [DOI] [PMC free article] [PubMed] [Google Scholar]
- 25.Floess S, et al. Epigenetic control of the foxp3 locus in regulatory T cells. PLoS Biol. 2007;5:e38. doi: 10.1371/journal.pbio.0050038. [DOI] [PMC free article] [PubMed] [Google Scholar]
- 26.Hill JA, et al. Foxp3 transcription-factor-dependent and -independent regulation of the regulatory T cell transcriptional signature. Immunity. 2007;27:786–800. doi: 10.1016/j.immuni.2007.09.010. [DOI] [PubMed] [Google Scholar]
- 27.Aricha R, Feferman T, Fuchs S, Souroujon MC. Ex vivo generated regulatory T cells modulate experimental autoimmune myasthenia gravis. J Immunol. 2008;180:2132–2139. doi: 10.4049/jimmunol.180.4.2132. [DOI] [PubMed] [Google Scholar]
- 28.Davidson TS, DiPaolo RJ, Andersson J, Shevach EM. Cutting edge: IL-2 is essential for TGF-beta-mediated induction of Foxp3+ T regulatory cells. J Immunol. 2007;178:4022–4026. doi: 10.4049/jimmunol.178.7.4022. [DOI] [PubMed] [Google Scholar]
- 29.Huter EN, et al. TGF-beta-induced Foxp3+ regulatory T cells rescue scurfy mice. Eur J Immunol. 2008;38:1814–1821. doi: 10.1002/eji.200838346. [DOI] [PMC free article] [PubMed] [Google Scholar]
- 30.Wang R, et al. Expression of GARP selectively identifies activated human FOXP3+ regulatory T cells. Proc Natl Acad Sci USA. 2009;106:13439–13444. doi: 10.1073/pnas.0901965106. [DOI] [PMC free article] [PubMed] [Google Scholar]
- 31.Deaglio S, et al. Adenosine generation catalyzed by CD39 and CD73 expressed on regulatory T cells mediates immune suppression. J Exp Med. 2007;204:1257–1265. doi: 10.1084/jem.20062512. [DOI] [PMC free article] [PubMed] [Google Scholar]
- 32.Wing K, et al. CTLA-4 control over Foxp3+ regulatory T cell function. Science. 2008;322:271–275. doi: 10.1126/science.1160062. [DOI] [PubMed] [Google Scholar]
- 33.Heng TS, Painter MW Immunological Genome Project Consortium. The Immunological Genome Project: networks of gene expression in immune cells. Nat Immunol. 2008;9:1091–1094. doi: 10.1038/ni1008-1091. [DOI] [PubMed] [Google Scholar]
- 34.Tran DQ, et al. GARP (LRRC32) is essential for the surface expression of latent TGF-beta on platelets and activated FOXP3+ regulatory T cells. Proc Natl Acad Sci USA. 2009;106:13445–13450. doi: 10.1073/pnas.0901944106. [DOI] [PMC free article] [PubMed] [Google Scholar]
- 35.Stockis J, Colau D, Coulie PG, Lucas S. Membrane protein GARP is a receptor for latent TGF-beta on the surface of activated human Treg. Eur J Immunol. 2009;39:3315–3322. doi: 10.1002/eji.200939684. [DOI] [PubMed] [Google Scholar]
- 36.Thornton AM, et al. Expression of Helios, an Ikaros transcription factor family member, differentiates thymic-derived from peripherally induced Foxp3+ T regulatory cells. J Immunol. 2010;184:3433–3441. doi: 10.4049/jimmunol.0904028. [DOI] [PMC free article] [PubMed] [Google Scholar]
- 37.Yamanouchi J, et al. Interleukin-2 gene variation impairs regulatory T cell function and causes autoimmunity. Nat Genet. 2007;39:329–337. doi: 10.1038/ng1958. [DOI] [PMC free article] [PubMed] [Google Scholar]
- 38.Lyons PA, et al. Congenic mapping of the type 1 diabetes locus, Idd3, to a 780-kb region of mouse chromosome 3: identification of a candidate segment of ancestral DNA by haplotype mapping. Genome Res. 2000;10:446–453. doi: 10.1101/gr.10.4.446. [DOI] [PMC free article] [PubMed] [Google Scholar]
- 39.Hunter K, et al. Interactions between Idd5.1/Ctla4 and other type 1 diabetes genes. J Immunol. 2007;179:8341–8349. doi: 10.4049/jimmunol.179.12.8341. [DOI] [PubMed] [Google Scholar]
- 40.Lamhamedi-Cherradi SE, et al. Further mapping of the Idd5.1 locus for autoimmune diabetes in NOD mice. Diabetes. 2001;50:2874–2878. doi: 10.2337/diabetes.50.12.2874. [DOI] [PubMed] [Google Scholar]
- 41.Ueda H, et al. Association of the T-cell regulatory gene CTLA4 with susceptibility to autoimmune disease. Nature. 2003;423:506–511. doi: 10.1038/nature01621. [DOI] [PubMed] [Google Scholar]
- 42.Vijayakrishnan L, et al. An autoimmune disease-associated CTLA-4 splice variant lacking the B7 binding domain signals negatively in T cells. Immunity. 2004;20:563–575. doi: 10.1016/s1074-7613(04)00110-4. [DOI] [PubMed] [Google Scholar]
- 43.Lundholm M, et al. Defective induction of CTLA-4 in the NOD mouse is controlled by the NOD allele of Idd3/IL-2 and a novel locus (Ctex) telomeric on chromosome 1. Diabetes. 2006;55:538–544. doi: 10.2337/diabetes.55.02.06.db05-1240. [DOI] [PubMed] [Google Scholar]
- 44.Zheng Y, et al. Role of conserved non-coding DNA elements in the Foxp3 gene in regulatory T-cell fate. Nature. 2010;463:808–812. doi: 10.1038/nature08750. [DOI] [PMC free article] [PubMed] [Google Scholar]
- 45.Vaarala O, Atkinson MA, Neu J. The “perfect storm” for type 1 diabetes: the complex interplay between intestinal microbiota, gut permeability, and mucosal immunity. Diabetes. 2008;57:2555–2562. doi: 10.2337/db08-0331. [DOI] [PMC free article] [PubMed] [Google Scholar]
- 46.Turley SJ, Lee JW, Dutton-Swain N, Mathis D, Benoist C. Endocrine self and gut non-self intersect in the pancreatic lymph nodes. Proc Natl Acad Sci USA. 2005;102:17729–17733. doi: 10.1073/pnas.0509006102. [DOI] [PMC free article] [PubMed] [Google Scholar]
- 47.Jiang W, Anderson MS, Bronson R, Mathis D, Benoist C. Modifier loci condition autoimmunity provoked by Aire deficiency. J Exp Med. 2005;202:805–815. doi: 10.1084/jem.20050693. [DOI] [PMC free article] [PubMed] [Google Scholar]
- 48.Mathis D, Benoist C. Back to central tolerance. Immunity. 2004;20:509–516. doi: 10.1016/s1074-7613(04)00111-6. [DOI] [PubMed] [Google Scholar]
- 49.Badami E. Defective FoxP3+ Treg cell differentiation in the gut of type 1 diabetic patients. 2010. Nat Precedings. Available at http://hdl.handle.net/10101/npre.2010.4417.1. Accessed February 21, 2011.
- 50.Iwai LK, Benoist C, Mathis D, White FM. Quantitative phosphoproteomic analysis of T cell receptor signaling in diabetes prone and resistant mice. J Proteome Res. 2010;9:3135–3145. doi: 10.1021/pr100035b. [DOI] [PMC free article] [PubMed] [Google Scholar]
Associated Data
This section collects any data citations, data availability statements, or supplementary materials included in this article.


