Abstract
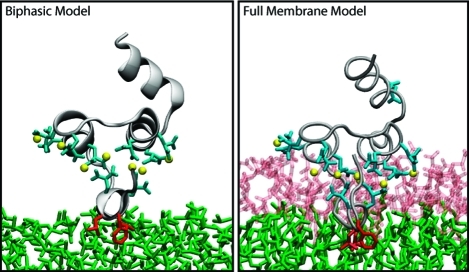
Membrane binding of peripheral proteins, mediated by specialized anchoring domains, is a crucial step for their biological function. Computational studies of membrane insertion, however, have proven challenging and largely inaccessible, due to the time scales required for the complete description of the process, mainly caused by the slow diffusion of the lipid molecules composing the membrane. Furthermore, in many cases, the nature of the membrane “anchor”, i.e., the part of the protein that inserts into the membrane, is also unknown. Here, we address some of these issues by developing and employing a simplified representation of the membrane by a biphasic solvent model which we demonstrate can be used efficiently to capture and describe the process of hydrophobic insertion of membrane anchoring domains in all-atom molecular dynamics simulations. Applying the model, we have studied the insertion of the anchoring domain of a coagulation protein (the GLA domain of human protein C), starting from multiple initial configurations varying with regard to the initial orientation and height of the protein with respect to the membrane. In addition to efficiently and consistently identifying the “keel” region as the hydrophobic membrane anchor, within a few nanoseconds each configuration simulated showed a convergent height (2.20 ± 1.04 Å) and angle with respect to the interface normal (23.37 ± 12.48°). We demonstrate that the model can produce the same results as those obtained from a full representation of a membrane, in terms of both the depth of penetration and the orientation of the protein in the final membrane-bound form with an order of magnitude decrease in the required computational time compared to previous models, allowing for a more exhaustive search for the correct membrane-bound configuration.
Introduction
The plasma membrane serves as a highly dynamic platform for binding of peripheral membrane proteins and their complexes, a phenomenon that is involved in the regulation of a wide range of cellular and physiological processes, e.g., intercellular signaling, membrane trafficking, and coagulation.1−3 As the association of peripheral membrane proteins is often intended to be transient, these proteins have evolved specialized domains, termed membrane anchoring domains, which are responsible for reversibly binding to the membrane. These membrane-anchoring domains take advantage of different molecular strategies (various types of specific lipid–protein interactions) in achieving membrane affinities tuned to the function of the proteins, although the binding can be broadly viewed as a combination of electrostatic interactions with (often anionic) lipids and hydrophobic interactions with the apolar core of the membrane.4−7 In many cases, membrane binding constitutes a step in the activation of the protein,5−8 a process which is chiefly controlled through modulation of the lipid composition of the membrane in specific areas. Developing a molecular view of how membrane-anchoring domains interact with the membrane is therefore crucial to our understanding of peripheral proteins’ function.
Despite the high relevance of the phenomenon, due to technical challenges involved in obtaining high-resolution information on the process of membrane insertion/binding, there have been relatively few studies achieving atomistic details on the membrane-bound forms of peripheral proteins.(9) Furthermore, different experimental approaches have often resulted in different membrane-bound models for the same anchoring domain, adding to the uncertainty of the problem. For instance, a variety of experimental techniques, including EPR,10−13 fluorescent labeling,(12) and NMR,(14) have been utilized to characterize the membrane-bound forms of the C2 domain, a common anchoring domain in signal transduction and membrane trafficking of proteins.15,16 These experiments, however, have resulted in membrane-bound models ranging from 5.2 Å insertion and making an angle of 77° with the membrane normal12,17 to the domain being inserted 10 Å and making an angle of 52° with the membrane normal.10,11,18 The roles of the three Ca2+-binding loops (CBL) and the β-groove in membrane binding are also disputed.(16) Similar discrepancies are found in the studies of the GLA domains, the anchoring domain of vitamin K-dependent coagulation factors, where the relative orientation and depth of penetration into the membrane are largely disputed,19−21 and the FYVE domain,22−25 where the membrane binding motif has not even been characterized. (Clarification: “Gla” refers to γ-carboxyglutamic acid; “GLA” refers to a Gla-rich anchoring domain.)
Computational studies on membrane anchoring domains have proven equally difficult. In contrast to integral membrane proteins, whose membrane binding mode is fairly well understood, and for which even semiautomated insertion protocols exist,26,27 there are currently no robust methods to determine how deep and in what orientation a peripheral membrane protein will insert into a biological membrane, or even in some cases which residues comprise the “membrane anchor”. These anchors usually comprise a small portion of the anchoring domain and could be as small as a few amino acids, making the prediction of the anchors rather difficult. Compounded further by the need of describing the protein’s structural changes that are induced/accompanied by insertion into the membrane, especially with regard to the side chains in and around the anchor region, and the slow diffusion of lipid molecules around the insertion point, describing the process of membrane insertion has proven extremely challenging in simulation studies. Of the small number of computational studies conducted on peripheral proteins, a majority have focused on only a handful of anchoring domains, namely, the BAR,28−30 C2,(31) GLA,(21) FYVE,(32) PX,33−35 and membrane binding domain of prostaglandin H2 synthase.36,37 Naturally, most of these studies had to rely on initial embedding (partially or fully) of the anchoring domain into the lipid bilayer.31−36 While these studies have provided important information on how the anchoring domains might be stabilized within the membrane, they give little detail on the extremely dynamic process of insertion. Modeling the membrane-bound form in these studies also requires a priori knowledge of the anchoring region (the anchor). In addition, manually embedding the protein in the membrane introduces biased sampling and might restrict the states available to the protein. A few studies to date have simulated the complete process of insertion. However, in order to observe membrane insertion within the time scales accessible to molecular dynamics (MD) simulations, these studies had to make use of methods such as implicit membranes,38,39 steered molecular dynamics (SMD)(21) or relaxing the anchoring domain into a vacuum created by removal of lipids.21,36,37 Furthermore, and most importantly, most of the computational studies investigating membrane binding of the anchoring domain at atomic resolutions are extremely costly, requiring at least 100s of nanoseconds of simulation time to observe relevant phenomena. Thus, these (MD) simulations are often too expensive to conduct multiple trials, collect sufficient statistics, and ensure the validity of the models proposed.
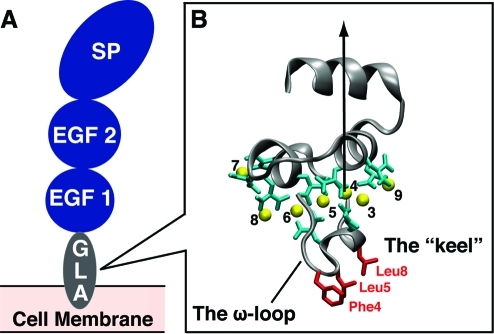
In this study we have utilized the GLA domain of human protein C (hPrC) as a representative membrane anchoring domain to test the effectiveness and efficiency of a simple biphasic solvent, membrane-mimetic model in characterizing the nature of the membrane anchoring domain and in capturing and describing the process of hydrophobic insertion of membrane anchoring domains. During the coagulation cascade, activated protein C (APC) acts as an anticoagulant(40) helping to stop clot formation. hPrC has a similar overall structure to other vitamin K-dependent coagulation proteins (Figure 1A) containing a serine protease (SP) catalytic domain, two EGF-like domains and the membrane-anchoring GLA domain.(41) The structure of the hPrC GLA domain is very similar to the GLA domains of other vitamin K-dependent hemostatic proteins such as factor VIIa (FVIIa) and prothrombin,(42) containing seven bound Ca2+ ions coordinated by nine Gla residues (Figure 1B). Binding of these Ca2+ ions is necessary for the formation of an active tertiary structure, as this causes the conformational change necessary to expose the 11-residue hydrophobic ω-loop and prepare the anchoring domain for insertion into the plasma membrane.21,43−46 Recent studies have also demonstrated that membrane insertion involves mainly the ω-loop and the bound Ca2+ ions, with the hydrophobic triad known as the keel forming the penetrating surface.21,47,48
Figure 1.
Structure of human protein C. (A) A general representation of hPrC showing the relative positions of the GLA anchoring domain, the two EGF-like domains, and the catalytic serine protease (SP) domain. (B) The GLA domain of hPrC. The backbone is shown in gray while the seven bound Ca2+ ions are shown as yellow spheres and numbered according to the crystal structure of the GLA domain of FVIIa.(69) The nine Gla residues of hPrC-GLA are colored in cyan, and the hydrophobic residues of the keel are shown in red. The arrow represents the vector connecting Ca2+-4 and the Cα of Phe40 which was used to represent the GLA domain’s axis in subsequent angle calculations. This structure is the starting point for all the simulations in the biphasic solvent system.
This report proposes a conceptually simple, but very efficient MD-based method for characterizing the depth of hydrophobic penetration and obtaining initial membrane-bound models of anchoring domains in peripheral membrane proteins. After construction of a water/DCLE (1,1-dichloroethane) biphasic system, multiple short simulation trials were performed to ensure the fidelity of the calculated properties of the organic phase to true experimental values.(49) The viability of this model as a membrane mimetic was then tested by placing the GLA domain of hPrC into the equilibrated biphasic system in multiple initial orientations with respect to the interface and performing unconstrained, equilibrium MD simulations. These simulations consistently resulted in spontaneous penetration of the GLA domain into the DCLE phase with exactly the same anchor (the keel), and achieving the same final height and angle of membrane insertion in a few nanoseconds. It is apparent from these simulations that the keel plays a pivotal role in the insertion dynamics of this anchoring domain much as it does in FVIIa.21,46 The convergence of the final inserted structures for all trials is also discussed. It appears that DCLE provides an optimal organic phase for the devised simplified membrane model, as employing several other organic solvents, including dimethyl sulfide (DMS), ethyl propyl ether (EPE), or heptane did not successfully capture the process of membrane insertion of the anchoring domain. To our knowledge, this study represents the first use of a biphasic solvent system to investigate the atomistic details of membrane insertion of the anchoring domains.
Methods
Materials and Methods
The GLA domain of hPrC was placed into the aqueous phase of organic/water biphasic solvent systems in different initial configurations and simulated with all-atom MD, in order to describe the process of its hydrophobic insertion and to determine the depth of its penetration into this membrane-mimetic model. In this section the details of the modeling steps and the protocols used for the MD simulations are described. While several different organic solvents were tested, DCLE turned out to be the most effective solvent in terms of capturing the process of membrane binding and insertion of the studied anchoring domain. Therefore, we will describe the modeling steps in detail only for the DCLE/water biphasic model in the following, noting that similar protocols and procedures were employed when using other organic solvents.
Constructing the Biphasic Solvent System
A single DCLE molecule was constructed by exchanging two hydrogen (H) atoms for two chlorine (Cl) atoms in an ethane molecule. The resulting structure was then relaxed in vacuo for 100 ps. A 60 × 60 × 60 Å3 box of DCLE was then generated using the Packmol program(50) replicating the relaxed DCLE structure 1,578 times, in order to produce the correct density of this organic solvent. A similar 60 × 60 × 60 Å3 box containing 6,845 waters was generated and placed on top of the DCLE box using the SOLVATE plugin in VMD(51) to create a biphasic solvent system with final dimensions of 60 × 60 × 120 Å3 containing ∼34,000 atoms and with the interface normal aligned along the z-axis. This structure was then energy minimized and equilibrated for 2 ns using an NPT ensemble with a target pressure and temperature of 1.0 atm and 310 K, respectively. Similar procedures were employed when constructing biphasic solvent boxes composed of water and either DMS, heptane, or EPE. The resulting biphasic solvent boxes were used for all subsequent simulations.
Modeling of the GLA Domain of Human Protein C
A partial structure of the GLA domain of hPrC(52) was taken from the RCSB Protein Data Bank (PDB)(53) (PDB entry 1LQV) containing residues 1–33 of the protein segment and the seven bound Ca2+ ions. The missing eleven residues of hPrC GLA domain, comprising the C-terminal helix, were modeled using the bovine factor X GLA domain(48) (PDB entry 1IOD) and making the following mutations using the PSFGEN plugin of VMD:(51) A34V, γ35D, Q36D, D38L, γ39A, and Y44H (where γ stands for Gla). The complete 44-amino acid hPrC GLA domain was then solvated in 10,263 water molecules and neutralized with 3 Na+ ions using the SOLVATE and AUTOIONIZE plugins of VMD(51) to give the system final dimensions of 56 × 48 × 45 Å3 containing ∼11,000 atoms. The system was energy minimized and simulated for 50 ps under NPT conditions (P = 1.0 atm, T = 310 K) during which all Cα atoms were harmonically constrained (k = 5.0 kcal mol–1 Å–2). Subsequently, the system was equilibrated for an additional 500 ps without constraints. The resulting structure of hPrC-GLA was used as the initial structure for all insertion simulations.
Initial Configurations
The equilibrated hPrC GLA domain was added to the aqueous phase of the equilibrated biphasic solvent system. The GLA domain of hPrC was then rotated and/or translated to produce a total of six different initial configurations for the DCLE/water system. These initial configurations were chosen to represent a wide variety of height from the aqueous–organic interface in addition to different orientations ranging from parallel with the aqueous–organic interface to perpendicular to the aqueous–organic interface. Overlapping solvent molecules were then removed, and the resulting systems were simulated using the protocol below. For DMS, EPE, and heptane biphasic systems, only one initial configuration of the protein was used, namely, with the keel positioned 10 Å from the interface and the protein’s axis (Figure 1B) aligned with the interface normal.
Simulation Procedures
All simulations were performed using the NAMD2 molecular dynamics software,(54) utilizing both the CHARMM27 force field with ϕ/ψ cross term map (CMAP) corrections(55) and CHARMM36(56) (CGenFF) set of force field parameters. The TIP3P model(57) was used for water. All simulations were run under NPT conditions with 1.0 atm as the target pressure, 310 K as the temperature, and the time step of 2 fs. Constant pressure was maintained using the Nosé–Hoover Langevin piston method.58,59 Constant temperature was maintained by Langevin dynamics using a damping coefficient, γ, of 1 ps–1 applied to all atoms. Nonbonded interactions were cut off after 12 Å with a smoothing function applied after 10 Å. The particle mesh Ewald (PME) method(60) was used for long-range electrostatic calculations with a grid density greater than 1 Å–3.
Analysis
An important aspect of all subsequent calculations was the determination of the water/DCLE interface. This was done by first selecting a volume which is 5 Å on either side of the plane separating the aqueous and organic phases. The average z-coordinate for all DCLE molecules within 2.5 Å of a water molecule was calculated and represented the interface. To calculate the depth of penetration of hPrC-GLA, the center of mass of the keel’s three Cα atoms (Phe4, Leu5, and Leu8) was calculated. The depth of penetration of hPrC-GLA is defined as the z-coordinate difference between the center of mass of the keel and that of the interface. Aqueous solubility was calculated by counting the number of DCLE molecules that were both within 2.5 Å of water and farther than 2.5 Å from other DCLE molecules in every frame. This was then averaged over the number of frames and divided by the equilibrated volume of water to give the number solubility, which was converted to g/mL of water to give the aqueous solubility.
Calculation of Diffusion Constant
To determine the mobility of the various organic phases used, the self-diffusion constant, D, of each organic phase was calculated as the asymptotic value of the Einstein relation:
where r(t0) is the position of a molecule at time t0 and r(t0 + Δt) is the position of the molecule after time Δt. Although, in actuality, Δt is limited by the length of the simulation, the value of D converged quickly (t < 10 ns). Because the diffusion coefficient is calculated as a function of the time difference, Δt, the number of sample points decreases as Δt increases, thus making the final points in the diffusion calculation prone to error. Therefore, the asymptotic value was calculated as the mean of the final 10 ns of the trajectory, excluding the last 5 ns.
Results and Discussion
Below the results obtained from modeling and simulation of various biphasic solvent models will be first presented. Then, we turn our attention to the simulations in which insertion of an anchoring domain into the biphasic membrane was studied. As the DCLE/water biphasic system was found to be the most effective model with regard to capturing the phenomenon of protein insertion, we will primarily discuss this model in the following section. The results obtained with other biphasic models and their performance will be discussed only briefly and using the DCLE/water biphasic model as a reference.
Design and Physical Properties of the Biphasic Model
The main drive behind the design of a highly mobile membrane-mimetic model originates from a long-standing problem that we and others have been facing when studying protein insertion into lipid bilayers in simulation studies employing all-atom representations; lipid molecules exhibit slow lateral diffusion, and respond very slowly to an inserting protein, resulting often in their insufficient relaxation within the time scales accessible to MD simulations. One of the major factors contributing to the slow diffusion of lipid molecules within a bilayer environment is the long tails of the lipid molecules in a biological membrane, which tend to form highly disordered and entangled structures within the core of a bilayer. Because organic solvent molecules are generally much smaller than lipid tails, they diffuse much faster, having a diffusion coefficient on the order of 10–5 cm2 s–1 compared to 10–8 cm2 s–1 for most lipids.61−63 Faster diffusion will allow the organic phase to better accommodate the protein upon disruption of the interface, decreasing the time needed to simulate “natural” insertion of anchoring domains into the membrane core. We therefore based our choice of a molecular representation of the hydrophobic core in our model on the criteria of size, aqueous solubility, phase at the desired simulation temperature (room or body temperature), and availability of force field parameters. With the release of the CHARMM General Force Field, CGenFF,(56) there are myriad choices of possible organic solvents which are immiscible with water. Most of the organic solvents available in CGenFF, however, are either volatile at 310 K (e.g., acetone, methylene chloride, and ether) or are lengthy molecules which would not be optimal for constructing a highly mobile membrane-mimetic model. To determine the optimum solvent to be used in the biphasic solvent system, we tested four different organic species: DCLE, DMS, EPE, and heptane. Heptane was chosen due to its obvious similarity to the true membrane core and the fact that it is the smallest alkane which is liquid at the simulation temperature. Additionally, the parameters were readily created by extending the existing CGenFF parameters for pentane. DCLE, DMS, and EPE were chosen due to their small size (between 8 and 16 atoms), their nonpolar nature (each with permanent dipole moments less than 1.83 D),(49) and the availability of parameters of easily adaptable analogues.
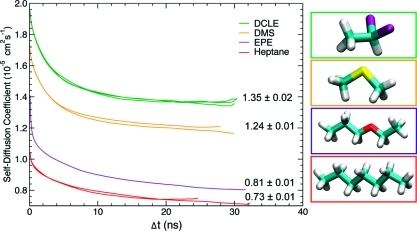
Since the fluidity of the solvent phase is a critical factor in determining the relaxation of the organic solvent in response to protein insertion, the self-diffusion constant (D) of the organic species was calculated (Figure 2). Out of the species tested, DCLE clearly has the largest self-diffusion coefficient (DDCLE = (1.35 ± 0.02) × 10–5 cm2 s–1) with DMS diffusing almost as rapidly (DDMS = (1.24 ± 0.01) × 10–5 cm2 s–1). The larger species, EPE and heptane, had much smaller self-diffusion constants (on the order of 10–6 cm2 s–1). The calculated diffusion constants suggest that the larger species will be less accommodating for the inserting protein.
Figure 2.
(Left) Plot of the self-diffusion coefficients D calculated for each species as a function of the time interval Δt; asymptotic values were taken as the value of D. In the plot, the D at a specific time interval is given in green for DCLE, orange for DMS, purple for EPE, and red for heptane. (Right) Molecular images of the organic species tested; the outline of each molecule corresponds to the same color line on the plot.
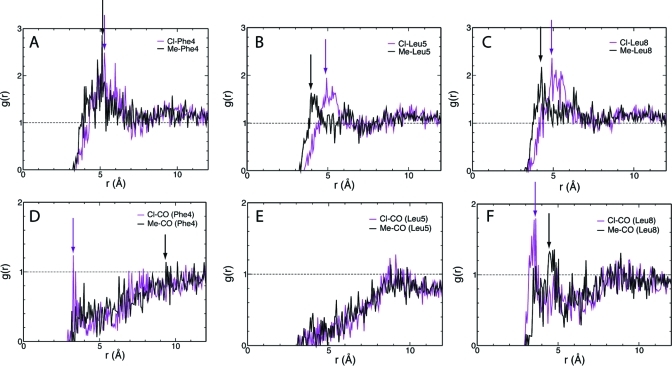
In fact, membrane insertion simulations clearly established the superiority of DCLE over the other three tested organic solvents as the organic solvent in our biphasic membrane model. The anchoring domain was found to have difficulty inserting and/or staying inserted in these particular organic phases composed of heptane and EPE, possibly due to the large size of the solvent molecules. For the case of the biphasic solvent system composed of DMS, the protein only partially inserted into the DMS phase; full insertion and formation of a stable membrane-bound form was only observed in the case of DCLE. We attribute this to the slight “amphipathic” nature of DCLE, which includes both hydrophobic (methyl) and weak polar (dichloromethyl) groups in its structure, rendering it with the ability to establish either mode of interaction with various groups in a protein, thus representing a membrane more effectively in such a simplified model as the one used here. Although, among the tested solvents, heptane is chemically the closest species to the core of a biological membrane, it completely lacks the ability of establishing partial polar interactions with the incoming protein, a factor that might have contributed to the inability of the biphasic heptane/water model in capturing membrane insertion of the anchoring domain. The distinct advantage that DCLE has over a strictly nonpolar species is its permanent dipole moment that allows for charge–dipole interactions between the solvent and the submerged portions of the protein backbone (Figure 3). Moreover, the methyl groups of DCLE are able to surround the hydrophobic moieties of the keel (i.e., side chains of Phe and Leu in hPrC GLA domain), providing a locally hydrophobic environment (Figure 3). The dipole moment together with the large diffusion coefficient allows DCLE to adapt optimally and quickly to the insertion of protein.
Figure 3.
Local structure of DCLE around the inserted keel. Radial distribution functions g(r) are shown for chloride (purple) and methyl (black) groups for (A) Phe4 side chain, (B) Leu5 side chain, (C) Leu8 side chain, (D) backbone oxygen of Phe4, (E) backbone oxygen of Leu5, and (F) backbone oxygen of Leu8. Arrows depict the position of the first peak for each distribution.
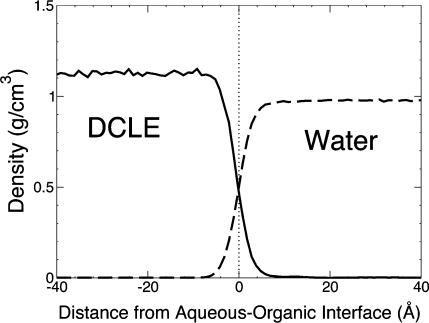
After simulating the DCLE/water biphasic solvent system for 2 ns, the density of the system was calculated to be 1.14 ± 0.05 g/mL, which shows good agreement with the accepted value of 1.2 g/mL (Table 1).(49) For a consistent interface to be maintained, the aqueous solubility of DCLE needed to be modeled very well by this system, and indeed, it was. The accepted value for the solubility of DCLE in water is 8.6 × 10⁻³ g/mL.(49) Over the 2 ns trajectory, we obtained an aqueous solubility of (9.89 ± 2.9) × 10–3 g/mL, which agrees with the accepted value reported in Table 1.(49) In addition, Figure 4 shows how well the interface is maintained; the steep density gradients on either side clearly indicate the separation of DCLE and water at the interface. Thus, the physical properties of DCLE vital to this study were reproduced in the simulations. During the equilibration, the DCLE solvent box did experience a small amount of shrinkage, but equilibrated to ∼86% of its original size within 89 ps. The z-dimension shrank ∼5 Å and fluctuated ∼0.5 Å around its equilibrated value. The freedom of the organic phase in modulating its dimension will be an added advantage of the biphasic system when used for integral proteins/peptides, as it will ensure an optimal match of the thickness of the hydrophobic layer to the inserted protein.
Table 1. Density and Aqueous Solubility of DCLE in Simulation Compared to Experimental Value.
| property | simulationa | experimentalb |
|---|---|---|
| density (g/mL) | 1.14 ± 0.05 | 1.2 |
| solubility (×10–3 g/mL H2O) | 9.89 ± 2.9 | 8.6 |
Calculated every 2 ps for the duration of the trajectory with the arithmetic mean and standard deviation displayed.
Experimental value found in Lide.(49)
Figure 4.
The density of DCLE (solid curve) and water (dashed curve) phases averaged over the simulation period of 2 ns. The dotted line at x = 0 represents the approximate location of the DCLE/water interface.
Spontaneous, Rapid Insertion of hPrC GLA Domain
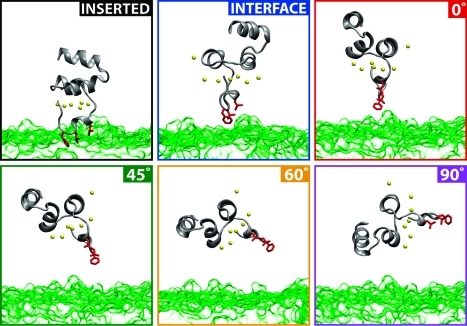
A common problem encountered when studying the membrane-bound forms of anchoring domains is the multitude of atomic models proposed, which seem to depend heavily on the initial orientation and position of the anchoring domain with respect to the membrane.21,64 Thus, we wished to test the ability of the reduced membrane model (DCLE/water biphasic model) to consistently reproduce a single equilibrium structure by simulating a variety of initial orientations. The six initial configurations chosen to test the viability of the biphasic solvent system as a model for membrane insertion are shown in Figure 5. These particular initial configurations display a variety of heights from the aqueous–organic interface, as well as a spectrum of angles ranging from parallel with the interface normal to perpendicular to the normal.
Figure 5.
Snapshots at t = 0 showing the six different initial configurations tested. The green surface represents the DCLE volume while the water is implied in the empty space. Bound Ca2+ ions are represented as yellow spheres. The labels found in each box will be adopted throughout the text to simplify discussion of these systems.
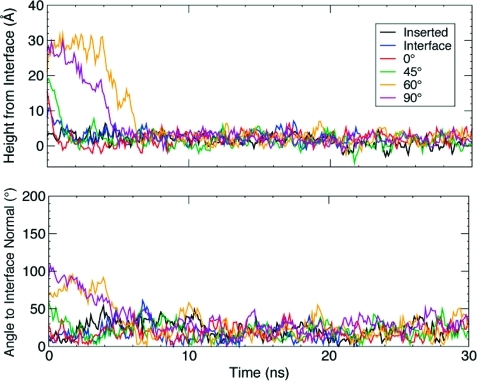
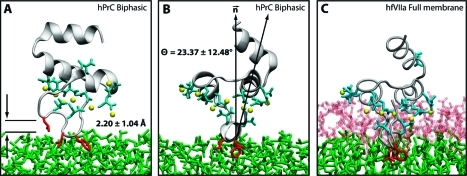
The time evolution of the height of the GLA domain from the interface over the entire 30 ns course of the simulations is displayed in Figure 6. It is clear from the plot that each initial configuration converges to a height of 2.20 ± 1.04 Å (Table 2) within a few nanoseconds and fluctuates slightly around this “equilibrium point” for the remainder of the simulation (Figure 6). The angle with respect to the interface normal also converges at approximately the same rate to 23.37 ± 12.48° (Figure 6); Figure 7 displays the converged structure of hPrC GLA domain (snapshot taken at t = 29 ns). As expected, the 60° and 90° trials were the slowest to insert, since they needed more time in solution to explore and find an optimal orientation toward the interface. However, even in these cases, insertion is completed within a few nanoseconds. This rate of insertion corresponds to at least 1 order of magnitude increase in the speed of insertion over previous studies,21,64 making this method more accessible to MD simulations. In the simulation study of FVIIa anchoring,(21) the GLA domain fluctuates ∼5 Å around its equilibrium height; in this study, we see a similar degree of fluctuation around the equilibrium height. The plot of the domain’s angle to the interface normal, however, shows a greater variability which is likely due to the absence of headgroup specific interactions with the anchoring domain. Ohkubo and Tajkhorshid(21) have demonstrated that the seven bound Ca2+ ions of the hFVII GLA domain interact significantly with the phosphate groups of the lipid headgroups resulting in the stabilization of the membrane-bound complex. This effect is clearly missing from our model, resulting in a larger degree of fluctuation of the domain at the interface. We note that specific contacts between the lipid headgroups and peripheral proteins are of utmost importance in interaction of proteins such as the Ras family64,65 and FERM domain(66) with the membrane. These interactions are not represented by the simple model used in our simulations, and while the model appears to be very efficient in determining mostly hydrophobic interactions, it is not able to describe specific lipid–protein interactions. We are currently working on including the effect of the headgroups in the model.
Figure 6.
(Top) The height of the keel Cα atoms above the DCLE/water interface, which was assumed to be the average position of the first layer of DCLE molecules in contact with water. (Bottom) The angle between the GLA domain’s axis, determined by the vector traced from the Ca2+-4 and the Cα of Phe40 (see Figure 1), and the interface normal (z-axis). The colors used in these plots correspond to the outline around each orientation found in Figure 5.
Table 2. Equilibrium height and angle of the GLA domain.
Figure 7.
Depiction of the hPrC GLA domain at t = 29 ns. In this figure, the green represents DCLE, the white represents water, the protein backbone is depicted in gray, and the keel residues are shown in red. (A) Figure shows a side view of the GLA domain with its average height above the interface of 2.20 ± 1.04 Å. (B) Figure shows a front view of the GLA domain together with the interface normal and the defined protein axis; the equilibrium angle of the protein was found to be 23.37 ± 12.48°. (C) A front view of the fully inserted hFVIIa GLA domain.(21) (B) and (C) demonstrate that the equilibrium structure of the inserted GLA domain using the biphasic solvent system is comparable to the structure obtained using an all-atom representation of the membrane.
In close agreement with previous simulations of the FVII GLA domain,(21) we observed a similar mechanism by which both FVIIa and hPrC GLA domains insert into the hydrophobic layer. No matter what angle the anchoring domain initially makes with the interface normal, it has an apparent “grab-and-pull” motion. The keel approaches the interface at an angle until Phe4 inserts itself into the hydrophobic volume; this is followed by a domino-like falling of the other two keel residues into the organic phase which coincides with the domain “standing up” and the angle between the domain and the interface normal decreasing. Capturing the insertion dynamics is important to the study of anchoring domains, and the observed dynamics of hPrC-GLA provides further qualitative support for the ability of the model to capture similar phenomena to those obtained from full membrane simulations. Energetic analysis of the interaction between the GLA domain and the organic phase of the membrane mimetic model clearly indicates that nonpolar interactions are the main driving force for association and insertion of the GLA domain into the organic phase. Using the last 5 ns of each of the six membrane insertion simulation of the GLA domain into the DCLE/water biphasic system, an average electrostatic interaction of only ∼−11 kcal/mol between the GLA domain and the organic phase is calculated, whereas the van der Waals component of the interaction energy amounts to more than −47 kcal/mol.
Discussion
Membrane binding of peripheral proteins is a key step in regulating their activity in physiological processes as diverse as endosomal trafficking and hemostasis. These proteins have evolved specialized “anchoring” domains, which play a pivotal role in recognition of specific membrane regions and the proteins’ subsequent binding and insertion. However, given the fluid nature of the membrane and the reversible nature of the binding process, current experimental techniques have not been able to conclusively determine the relative depth and orientation of the membrane-bound forms of these anchoring domains. There still remains an ongoing debate on depth of penetration, equilibrium angle, and even the identity of the domains involved in anchoring these proteins. Limitations to the time scales accessible by MD simulations have also made computational studies of membrane anchoring domains very challenging. In this paper, we present, to our knowledge, the first use of a biphasic solvent model as a simple representation of a membrane to identify the membrane-interacting portion and to investigate the membrane-bound orientations of anchoring domains.
The developed biphasic solvent model is demonstrated to be an efficient method to probe a protein and to determine the specific moieties involved in membrane penetration. The model is computationally very efficient, owing to purposefully keeping the size of the molecular species composing the hydrophobic core (organic phase) small, an aspect which is in contrast to previously reported models used to represent simplified membranes, e.g., octanol/water phases. At the same time, since the model remains atomistic, one does not have to be concerned with the potential complications of coarse-grained and/or multiscale representations, or shortcomings arising from implicit representations of membrane and water. Throughout our multiple trials sampling a variety of initial orientations and positions of a GLA domain (the anchoring domain of vitamin K-dependent coagulation proteins), the keel residues of the domain, known to be the membrane penetrating residues, were consistently found to be the only residues which spontaneously inserted into the organic solvent within a few nanoseconds, demonstrating their unique affinity for the hydrophobic core. In addition to identifying the anchor, this model also allows for rapid analysis of the depth of penetration of the anchoring domain and equilibrium angle relative to the interface normal. A clear advantage of the method over static analysis of hydrophobic surfaces of proteins is related to the dynamical description of the process during which conformational changes of the protein can be induced due to interaction with the hydrophobic phase.
In addition to hydrophobic insertion, which constitutes an important and necessary mode of interaction for membrane-anchoring domains, it is well-known that specific interactions with lipid head groups form another critical set of interactions for these proteins. Lipid head groups are very important in the process of reversible membrane binding by membrane anchors, and in many cases they control whether or not a peripheral protein should bind the membrane. Such specific protein–lipid interactions are clearly not represented in our simple model. We note, however, that the final structures obtained from the biphasic solvent model simulations can be used to construct models of membrane-bound proteins with accurate full membrane representations. The biphasic system can be used to efficiently identify how deep the protein penetrates into the membrane’s hydrophobic core, thereby providing a guide for placement and modeling of the protein in a full membrane system. By aligning the interfacial region of the full lipid bilayer to the aqueous–organic interface in the biphasic model, one can maximize the overlap between the hydrophobic regions of the two representations, thus ensuring an optimal initial insertion of the protein into the hydrophobic core of the full membrane. Work is in progress to add specific representations of the lipid headgroup to our biphasic solvent model while keeping the simulation times necessary to capture spontaneous membrane binding still on the nanosecond time scale.(67) Once completed, the model will provide a platform for more detailed computational studies on the variety of molecular mechanisms used by anchoring domains to bind to the membrane.
Acknowledgments
This work was supported in part by the National Institutes of Health (Grants R01-GM086749, R01-GM067887, U54-GM087519, and P41-RR05969 to E.T. and Molecular Biophysics Training Grant to M.J.A.) All simulations have been performed using TeraGrid resources (Grant No. MCA06N060).(68)
Abbreviations
- APC
activated protein C
- CBL
Ca2+-binding loops
- CGenFF
CHARMM General Force Field
- DCLE
1,1-dichloroethane
- DMS
dimethyl sulfide
- EPE
ethyl propyl ether
- γ/Gla
γ-carboxyglutamate residue
- hPrC
human protein C
- FVIIa
activated factor VII
- MD
molecular dynamics
- SMD
steered molecular dynamics
- SP
serine protease.
Funding Statement
National Institutes of Health, United States
References
- Cho W.; Stahelin R. V. Annu. Rev. Biophys. Biomol. Struct. 2005, 34, 119–151. [DOI] [PubMed] [Google Scholar]
- DiNitto J. P.; Cronin T. C.; Lambright D. G. Sci. STKE 2003, 2003, re16. [DOI] [PubMed] [Google Scholar]
- Leventis P. A.; Grinstein S. Annu. Rev. Biophys. 2010, 39, 407–427. [DOI] [PubMed] [Google Scholar]
- Ubach J.; Zhang X.; Shao X.; Sudhof T.; Rizo J. EMBO J. 1998, 17, 3921–3930. [DOI] [PMC free article] [PubMed] [Google Scholar]
- Stahelin R.; Long F.; Diraviyam K.; Bruzik K.; Murray D.; Cho W. J. Biol. Chem. 2002, 277, 26379–26388. [DOI] [PubMed] [Google Scholar]
- Stahelin R.; Burian A.; Bruzik K.; Murray D.; Cho W. J. Biol. Chem. 2003, 278, 14469–14479. [DOI] [PubMed] [Google Scholar]
- Stahelin R.; Long F.; Peter B.; Murray D.; DeCamilli P.; McMahon H.; Cho W. J. Biol. Chem. 2003, 278, 28993–28999. [DOI] [PubMed] [Google Scholar]
- Ford M. G.; Mills I. G.; Peter B. J.; Vallis Y.; Praefcke G. J.; Evans P. R.; McMahon H. T. Nature 2002, 419, 361–366. [DOI] [PubMed] [Google Scholar]
- Bond P. J.; Cuthbertson J.; Deol S. S.; Forrest L. R.; Johnston J.; Sansom M. S. P. In New algorithms for macromolecular simulation, 1st ed.; Springer: Berlin, 2006; pp 3–20. [Google Scholar]
- Malmberg N. J.; Buskirk D. R. V.; Falke J. J. Biochemistry 2003, 42, 13227–13240. [DOI] [PMC free article] [PubMed] [Google Scholar]
- Frazier A. A.; Wisner M. A.; Malmberg N. J.; Victor K. G.; Fanucci G. E.; Nalefski E. A.; Falke J. J.; Cafiso D. S. Biochemistry 2002, 41, 6282–6292. [DOI] [PubMed] [Google Scholar]
- Kohout S. C.; Corbalán-García S.; Gómez-Fernández J. C.; Falke J. J. Biochemistry 2003, 42, 1254–1265. [DOI] [PMC free article] [PubMed] [Google Scholar]
- Ball A.; Nielsen R.; Gelb M. H.; Robinson B. H. Proc. Natl. Acad. Sci. U.S.A. 1999, 96, 6637–6642. [DOI] [PMC free article] [PubMed] [Google Scholar]
- Gilbert G. E.; Baleja J. D. Biochemistry 1995, 34, 3022–3031. [DOI] [PubMed] [Google Scholar]
- Rizo J.; Südhof T. C. J. Biol. Chem. 1998, 273, 15879–15882. [DOI] [PubMed] [Google Scholar]
- Cho W.; Stahelin R. V. Biochim. Biophys. Acta 2006, 1761, 838–849. [DOI] [PubMed] [Google Scholar]
- Verdaguer N.; Corbalán-García S.; Ochoa W.; Fita I.; Gómez-Fernández J. EMBO J. 1999, 18, 6329–6338. [DOI] [PMC free article] [PubMed] [Google Scholar]
- Perisic O.; Fong S.; Lynch D. E.; Bycroft M.; Williams R. L. J. Biol. Chem. 1998, 273, 1596–1604. [DOI] [PubMed] [Google Scholar]
- McDonald J. F.; Shah A. M.; Schwalbe R. A.; Kisiel W.; Dahlbäck B.; Nelsestuen G. L. Biochemistry 1997, 36, 5120–5127. [DOI] [PubMed] [Google Scholar]
- Huang M.; Rigby A. C.; Morelli X.; Grant M. A.; Huang G.; Furie B.; Seaton B.; Furie B. C. Nat. Struct. Biol. 2003, 10, 751–756. [DOI] [PubMed] [Google Scholar]
- Ohkubo Y. Z.; Tajkhorshid E. Structure 2008, 16, 72–81. [DOI] [PubMed] [Google Scholar]
- Misra S.; Hurley J. H. Cell 1999, 97, 657–666. [DOI] [PubMed] [Google Scholar]
- Mao Y.; Nickitenko A.; Duan X.; Lloyd T. E.; Wu M. N.; Bellen H.; Quiocho F. A. Cell 2000, 100, 447–456. [DOI] [PubMed] [Google Scholar]
- Dumas J. J.; Merithew E.; Sudharshan E.; Rajamani D.; Hayes S.; Lawe D.; Corvera S.; Lambright D. G. Mol. Cell 2001, 8, 947–958. [DOI] [PubMed] [Google Scholar]
- Kutateladze T. G.; Capelluto D. G.; Ferguson C. G.; Cheever M. L.; Kutateladze A. G.; Prestwich G. D.; Overduin M. J. Biol. Chem. 2004, 279, 3050–3057. [DOI] [PubMed] [Google Scholar]
- Jo S.; Kim T.; Im W. PLoS One 2007, 2, e880. [DOI] [PMC free article] [PubMed] [Google Scholar]
- Wolf M. G.; Hoefling M.; Aponte-Santamaría C.; Grubmüller H.; Groenhof G. J. Comput. Chem. 2010, 31, 2169–2174. [DOI] [PubMed] [Google Scholar]
- Arkhipov A.; Yin Y.; Schulten K. Biophys. J. 2009, 97, 2727–2735. [DOI] [PMC free article] [PubMed] [Google Scholar]
- Cui H.; Ayton G. S.; Voth G. A. Biophys. J. 2009, 97, 2746–2753. [DOI] [PMC free article] [PubMed] [Google Scholar]
- Blood P. D.; Swenson R. D.; Voth G. A. Biophys. J. 2008, 95, 1866–1876. [DOI] [PMC free article] [PubMed] [Google Scholar]
- Jaud S.; Tobias D. J.; Falke J. J.; White S. H. Biophys. J. 2007, 92, 517–524. [DOI] [PMC free article] [PubMed] [Google Scholar]
- Diraviyam K.; Stahelin R. V.; Cho W.; Murray D. J. Mol. Biol. 2003, 328, 721–736. [DOI] [PubMed] [Google Scholar]
- Psachoulia E.; Sansom M. S. P. Biochemistry 2009, 48, 5090–5095. [DOI] [PubMed] [Google Scholar]
- Psachoulia E.; Sansom M. S. P. Biochemistry 2008, 47, 4211–4220. [DOI] [PubMed] [Google Scholar]
- Singh S. M.; Murray D. Protein Sci. 2003, 12, 1934–1953. [DOI] [PMC free article] [PubMed] [Google Scholar]
- Nina M.; Bernèche S.; Roux B. Eur. Biophys. J. 2000, 29, 439–454. [DOI] [PubMed] [Google Scholar]
- Fowler P. W.; Coveney P. V. Biophys. J. 2006, 91, 401–410. [DOI] [PMC free article] [PubMed] [Google Scholar]
- Im W.; Feig M.; Brooks C. L. III. Biophys. J. 2003, 85, 2900–2918. [DOI] [PMC free article] [PubMed] [Google Scholar]
- Kessel A.; Haliloglu T.; Ben-Tal N. Biophys. J. 2003, 85, 3687–2695. [DOI] [PMC free article] [PubMed] [Google Scholar]
- Furie B.; Furie B. C. Cell 1988, 53, 505–518. [DOI] [PubMed] [Google Scholar]
- Mather T.; Oganessyan V.; Hof P.; Huber R.; Foundling S.; Esmon C.; Bode W. EMBO J. 1996, 15, 6822–6831. [PMC free article] [PubMed] [Google Scholar]
- Nelsestuen G.; Shah A.; Harvey S. Vitam. Horm. 2000, 58, 355–389. [DOI] [PubMed] [Google Scholar]
- Freedman S. J.; Furie B. C.; Furie B.; Baleja J. D. Biochemistry 1995, 34, 12126–12137. [DOI] [PubMed] [Google Scholar]
- Soriano-García M.; Padmanabhan K.; de Vos A. M.; Tulinsky A. Biochemistry 1992, 31, 2554–2566. [DOI] [PubMed] [Google Scholar]
- Sunnerhagen M.; Forsén S.; Hoffrén A.-M.; Drakenberg T.; Teleman O.; Stenflo J. Nat. Struct. Biol. 1995, 2, 504–509. [DOI] [PubMed] [Google Scholar]
- Ohkubo Y. Z.; Morrissey J. H.; Tajkhorshid E. J. Thromb. Haem. 2010, 8, 1044–1053. [DOI] [PMC free article] [PubMed] [Google Scholar]
- Falls L. A.; Furie B. C.; Jacobs M.; Furie B.; Rigby A. C. J. Biol. Chem. 2001, 276, 23895–23902. [DOI] [PubMed] [Google Scholar]
- Mizuno H.; Fujimoto Z.; Atoda H.; Morita T. Proc. Natl. Acad. Sci. U.S.A. 2001, 98, 7230–7234. [DOI] [PMC free article] [PubMed] [Google Scholar]
- Lide D. R.CRC Handbook of Chemistry and Physics, 90th ed.; CRC Press: Boca Raton, FL, 2009. [Google Scholar]
- Martínez L.; Andrade R.; Birgin E.; Martínez J. J. Comput. Chem. 2009, 30, 2157–2164. [DOI] [PubMed] [Google Scholar]
- Humphrey W.; Dalke A.; Schulten K. J. Mol. Graphics 1996, 14, 33–38. [DOI] [PubMed] [Google Scholar]
- Oganesyan V.; Oganesyan N.; Terzyan S.; Qu D.; Dauter Z.; Esmon N. L.; Esmon C. T. J. Biol. Chem. 2002, 277, 24851–24854. [DOI] [PubMed] [Google Scholar]
- The RCSB Protein Data Bank, http://www.rcsb.org/pdb.
- Phillips J. C.; Braun R.; Wang W.; Gumbart J.; Tajkhorshid E.; Villa E.; Chipot C.; Skeel R. D.; Kale L.; Schulten K. J. Comput. Chem. 2005, 26, 1781–1802. [DOI] [PMC free article] [PubMed] [Google Scholar]
- MacKerell A. D. Jr.; Feig M.; Brooks C. L. III. J. Comput. Chem. 2004, 25, 1400–1415. [DOI] [PubMed] [Google Scholar]
- Vanommeslaeghe K.; Hatcher E.; Acharya C.; Kundu S.; Zhong S.; Shim J.; Darian E.; Guvench O.; Lopes P.; Vorobyov I.; A. M. Jr. J. Comput. Chem. 2009, 31, 671–690. [DOI] [PMC free article] [PubMed] [Google Scholar]
- Jorgensen W. L.; Chandrasekhar J.; Madura J. D.; Impey R. W.; Klein M. L. J. Chem. Phys. 1983, 79, 926–935. [Google Scholar]
- Feller S. E.; Zhang Y.; Pastor R. W. J. Chem. Phys. 1995, 103, 4613–4621. [Google Scholar]
- Martyna G. J.; Tobias D. J.; Klein M. L. J. Chem. Phys. 1994, 101, 4177–4189. [Google Scholar]
- Darden T.; York D.; Pedersen L. J. Chem. Phys. 1993, 98, 10089–10092. [Google Scholar]
- Yoshida K.; Matubayasi N.; Nakahara M. J. Chem. Phys. 2008, 129, 214501-1–214501-9. [DOI] [PubMed] [Google Scholar]
- Almeida P. F.; Vaz W. L.; Thompson T. Biophys. J. 2005, 88, 4434–4438. [DOI] [PMC free article] [PubMed] [Google Scholar]
- Gaede H. C.; Gawrisch K. Biophys. J. 2003, 85, 1734–1740. [DOI] [PMC free article] [PubMed] [Google Scholar]
- Gorfe A. A.; Hanzal-Bayer M.; Abankwa D.; Hancock J. F.; McCammon J. A. J. Med. Chem. 2007, 50, 674–684. [DOI] [PubMed] [Google Scholar]
- Janosi L.; Gorfe A. A. Biophys. J. 2010, 99, 3666–3674. [DOI] [PMC free article] [PubMed] [Google Scholar]
- Anthis N. J.; Wegener K. L.; Ye F.; Kim C.; Goult B. T.; Lowe E. D.; Vakonakis I.; Bate N.; Critchley D. R.; Ginsberg M. H.; Campbell I. D. EMBO J. 2009, 28, 3623–3632. [DOI] [PMC free article] [PubMed] [Google Scholar]
- Ohkubo Y. Z.; Pogorelov T. V.; Arcario M. J.; Christensen G.; Tajkhorshid E. Submitted. [DOI] [PMC free article] [PubMed]
- TeraGrid, The TeraGrid portal, 2010, http://www.teragrid.org/.
- Banner D. W.; D’Arcy A.; Chène C.; Winkler F. K.; Guha A.; Konigsberg W. H.; Nemerson Y. Nature 1996, 380, 41–46. [DOI] [PubMed] [Google Scholar]


